 Jordan Peterson writes at National Post Canada must offer Alberta more than Trump could. Excerpts in italics with my bolds and added images.
We have been terrible friends to the Americans
There is little doubt that one Donald J. Trump has truly and effectively rattled his northern neighbour’s chains. Aren’t the Americans our friends — and vice versa? Is the president serious in his desire to make Canada the 51st state? He certainly seemed serious enough when discussing his proposed takeover of Greenland with the Danish prime minister last week. Such intensity and unpredictability of purpose has sent the leaders of that country, reminiscent of the Canadian Liberals in their political orientation, into a tizzy — one that has extended to their socialist and globalist European compatriots. Who is this horrible orange-haired man, they wonder, and what does he want?
We’re all about to find out — and, not least, in Canada. Why is all this happening, we ask, wringing our hands; and to us, the self-proclaimed greatest best friend and staunch ally of the elephant who parades so theatrically on the far side of our southern border?

We might begin to answer that suddenly so relevant question by scrupulously questioning the nature of that friendship — and on our side. Perhaps we’re not the partners and collaborators we think we are, for starters. It could well be argued, for example, that our much-vaunted Canuck niceness (that second-rate virtue) in relation to the superpower who overshadows us in every manner is and has been a matter of blunt necessity, rather than a consequence of our genuine reliability as well-wisher and supporter. It is true that Canada has made sacrifices alongside the Americans, when freedom and democracy was truly threatened. That was real — but it was a long time ago. Since then, we have played and continue to play a crooked game with regard to our hypothetical U.S. allies in many other important and consequential regards.
My fellow countrymen continually said things that would have been regarded as clearly racist, sexist or ethnocentric had they been uttered to anyone other than an American citizen — assuming, rightly (given the civilized nature of the people in question) that they would take them politely, and without evident offence. Such comments were much more likely to emanate, as well, from precisely the sort of leftists prone to proclaim first that such behaviour is utterly unacceptable and second that such conduct would of course never show its face among people as good in their thoughts as them.

Such behaviour is, sadly, a Canadian norm, particularly wherever the country is left-leaning; particularly wherever everyone believes axiomatically that we have all the virtues of our democratic compatriots to the south, and then some; particularly wherever everyone is inclined to point self-righteously to the wonders of our now-dreadful and even oft-murderous “free” health-care system and its associated highly dysfunctional, expensive and increasingly unsustainable social safety net and compare it to the free-for-all in the U.S. they inevitably resort to if death threatens and they have the money.
We Canadians also pride ourselves on our peaceful — and peacekeeping — nature (take that, Yanks), contrasting that with the war-mongering attitude of the gunslingers we secretly admire but publicly disdain, forgetting ever-so-conveniently that it is nothing but our positioning under the fearsome nuclear umbrella of the U.S.A. and our knowledge of the certainty of their military protection if push comes to shove that allows us to be the sheep of peace who bleat their undeserved self-regard with so little shame.
This is hardly the way to signal to the U.S. either that we are capable of defending ourselves, thank you very much, or that we are grateful for their existence as big brother captain of the high school wrestling team — much-disdained protector of our junior hippy student radical selves. Such things matter, more than we think — and a lot more, now that middle America is in charge, given the well-deserved contempt that lot have for the niceties of hypocritical socialist smartest-kid-in-the-class peaceniks. Remember, Canucks: the U.S. is now run by exactly the kind of Americans that we tempt themselves so unforgivably to treat as our moral inferiors. This is not how friends behave. It is also no way to keep friends, once they have hypothetically been made. And we’ve been put on serious notice in that regard.

And we are only scratching the surface in our analysis of the problems with Canada-U.S. relations, and with Canada itself, with that nothing-but-preliminary analysis. For the last nine years, Canada has been run by exactly the type of contemptible elitists who are, if anything, even more anti-capitalist, anti-nationalist, and anti-industrial state than the typical Canadian. This has set us against our putative American allies, in a manner much deeper than we want to think — and don’t be thinking that any of this is lost on Trump. He clearly despises the recently departed Justin, and has as much respect for those who elected him as he does for the Democrats, so much like them, who tortured, tormented and despised him and the flyover country MAGA middlebrows who were so much wiser in their political instincts than their Ivy League wannabe masters.
Canadians are Democrats, in Trump’s view, except more so..
We think that’s a virtue. It’s not. It’s a liability.
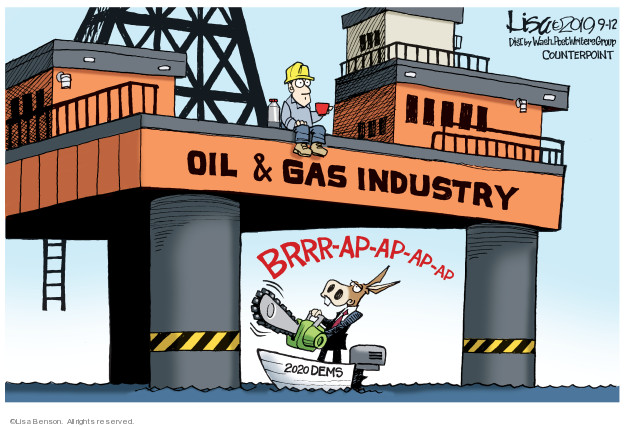
More specifically, it is a liability in relation to the U.S., particularly now. It has also and more seriously (as if irritating our mighty neighbours is not enough) threatened both Canada’s economic viability and the likelihood it will survive as a nation. We might also note, in that regard, that the newly ordained and inevitable grand poobah of the currently wretched but still dangerously powerful Liberals, one Mark Carney, is one of the world’s prime advocates of the insane inanities of net zero.

He is a man who has planned in writing, not least in his bestselling book Values, the complete destruction of the fossil fuel industry (bye, bye, Alberta). If that’s not bad enough, and it is, he is also simultaneously an advocate of the same “post-national” view of Canada defined by Trudeau junior and his moralistic minions. What are we, according to such good thinkers? Nothing: but if anything, the oppressive patriarchal white supremacist identity-less colonial settler state defined by the progressive ideologues in the think-tanks, the elite dining rooms in eastern Canada, and the protest encampments on the campuses of Canadian universities.

None of this fills the MAGA crowd with admiration, in case it has to be said. None of it bodes well, either, for the economy of Canada— doomed to replacement, according to Carney, by hydrogen, solar and wind power that either does not exist (that would be the hydrogen) or that would doom Canadians to starve and freeze in the dark if it ever came to replace the reliable grid and transportation we all so desperately depend on when it’s 40 bloody below. We may when arguing so expensively and incompetently with the Americans continue to congratulate ourselves on our comparative righteousness. That diet will become even thinner gruel, however, in a future characterized by their explosive economic growth and our rapid descent toward comparative poverty and irrelevance (green though that pathway may be argued, however falsely, to be).
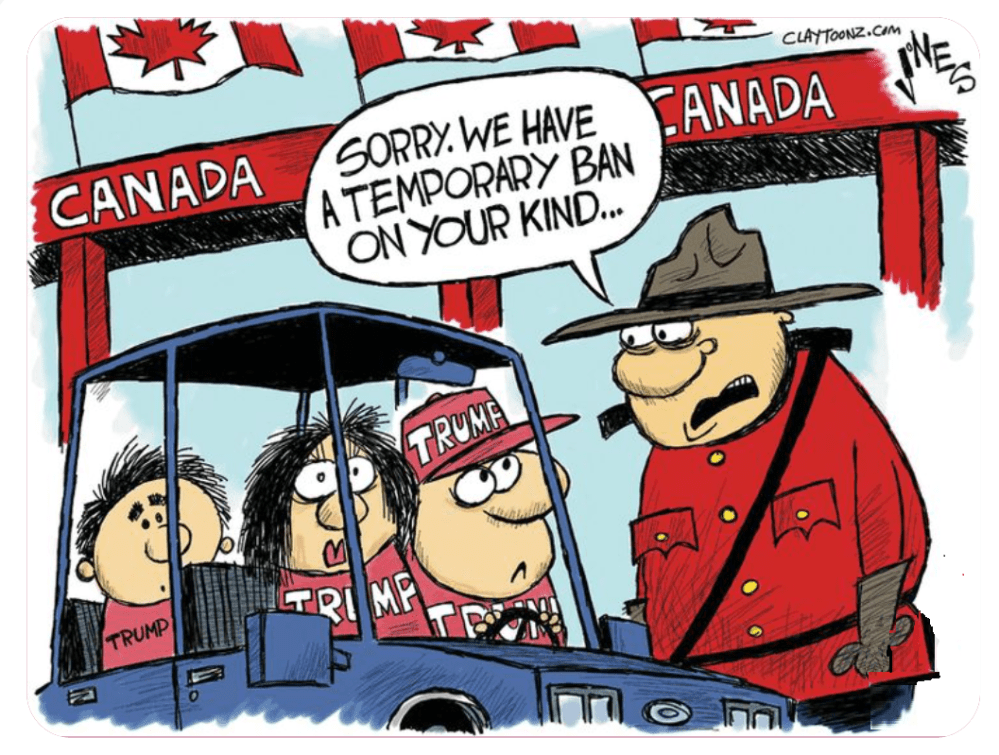
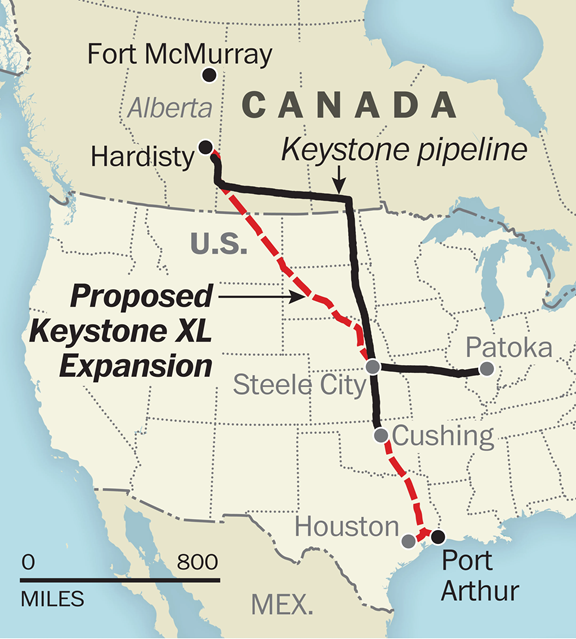
The consequence? No “business case” for the trade deals or infrastructure projects necessary to supply a self-admittedly desperate Europe and Japan with cheap and reliable Alberta energy. No new, plentiful and gratefully received pipelines running west to east in Canada. Abject economic dependence, in consequence, for Albertans (and Canada itself, as we are now finding out) on the purchasing decisions of the mad MAGA Yanks to the south. And now that same Alberta is being called upon to sacrifice its artificially and “morally” limited economy to fight off the looming tariffs of Donald J. Trump, the imposition of which should come as no surprise to anyone the least bit awake. We walked right into this, folks — and boy, we deserved it — but we felt good about ourselves all the way. And what is likely to result?
Trump has offered Canada status as the 51st state. If we had
a well-constituted country, this would have never happened,
or the suggestions would have been laughable.
I see damn few people laughing, however, and more’s the pity. A strong case can be made that such subordinate status would not at all be a good deal for the Great White North as a whole. For Alberta, however — and perhaps for the West as such — the situation is not so clear. Here’s what I might do, given that, if I were in Premier Danielle Smith’s shoes — or at least what I might threaten to do, taking a page from Trump’s art-of-the-deal book, because it’s high time for the Albertans to play hardball. I might travel, say, to Mar-a-Lago (where I did in fact recently encounter that premier). I might have, while there, a forthright, even blunt, chat with Donald J., where I might say to him something like the following:
“Mr. President: My fellow Canadians have for decades compelled us to climb into bed with an eight-hundred pound gorilla. That would be you, Mr. Trump. Now you’ve decided to consummate the deal, so to speak — and we’ve given you the upper hand, on a silver platter (to mix metaphors terribly), while you’re doing so. Canada is unlikely to become the 51st state, however — not even Alberta — as you well know, sir. After all, you’d have to offer us something better than what has been put forward by our fellow Canadians.
“That would be:
- the continued privilege and expense of subsidizing Quebec, half of whose citizens constantly clamour to secede from the country, while we impoverish ourselves for their benefit;
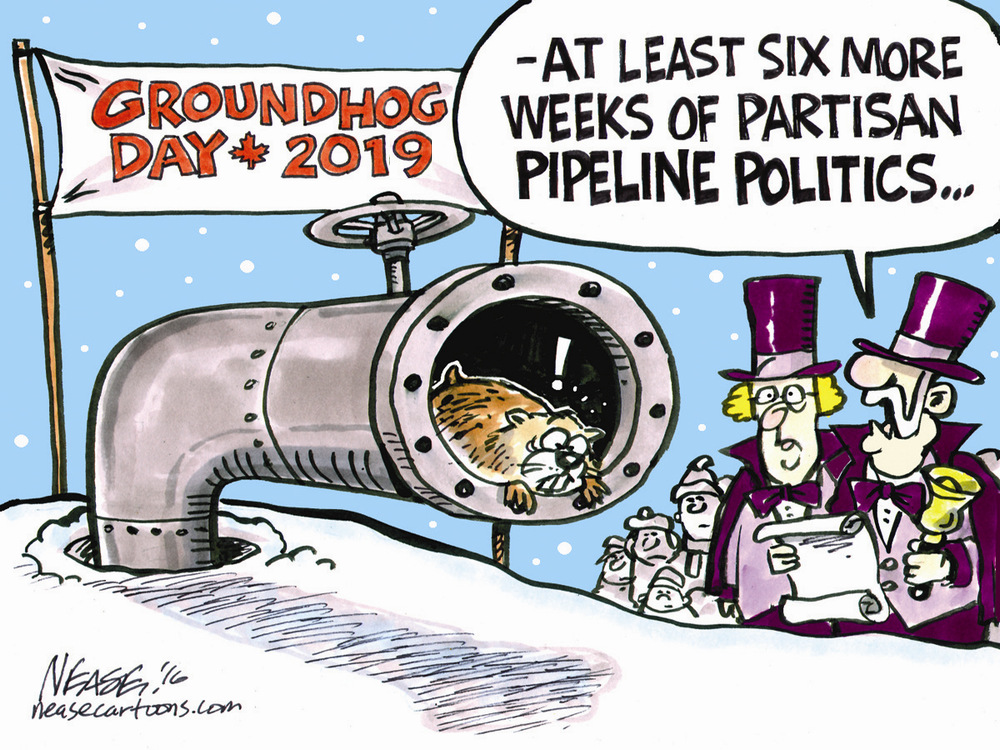
- the constant imposition of serious practical impediments from the federal and other provincial governments (hint, hint, British Columbia) to the international business deals and pipelines that would help Alberta bring its resources to market;
- continual insult on top of such injury in the form of unbearable and naïve moralizing about their superiority in conviction with regard to the “sustainability” of the planet — and, to top it all off,
- the accusation that I am not patriotic enough to start a trade war with my strange bedfellow in the name of a country whose very leaders proclaim both identitylessness and a multiculturalism that none of my citizens want.”

And Trump might well say (or perhaps is even right now saying): “I think I could top that offer, Ms. Premier, fine as it is.
- I could offer Albertans the American dollar;
- full access to our markets for their resources, at full international price;
- lower costs on almost all manufactured goods and on food;
- lower taxes, both corporate and personal;
- membership in a country that prides itself on being a country, and that does not plan to dissolve itself into an unstable multicultural mishmash;
- genuine admiration for your economic and industrial endeavours, along with a can-do, visionary and deeply entrepreneurial culture;
- immediate, reliable and guaranteed access to ports and pipelines, and full military defence.
“And, if that’s not enough, dear lady — no transfer payments! And the additional psychological advantage for Albertans in foregoing the perpetual and bullying eastern Canadian attitude of grievance and moral superiority, emanating in particular from the Quebec (‘give us what we want forever or we’ll leave!’) who also shamelessly disdains your dirty fossil fuel — such that they made the fracking Alberta’s economy depends upon literally illegal in their jurisdiction, just to make a point, while simultaneously accepting, and not with good grace, the filthy money so generated.”
What do you think would happen, Oh Canada, if those were the two choices put forth on a ballot before the citizens of Alberta? And why should Smith not take full advantage of this opportunity, to tell her fellow Canadians, in no uncertain terms, a few things that would both make Canada an attractive place for Alberta (and the rest of the West, perhaps) to stay, and much saner and richer, to boot?
And what would that be:
- Enough pathetic celebrity-wannabe pandering to the international elites of Davos — and, for good measure, the utterly degenerate UN.
- Enough overt and covert attempt to destroy the basis of the economy of my fair and hard-working province.
- Enough delaying critical infrastructure development and rejection of international trade offers for natural gas, oil and coal.
- Enough treatment of the resource economy upon which Quebec in particular so unacceptably depends as a moral pariah.
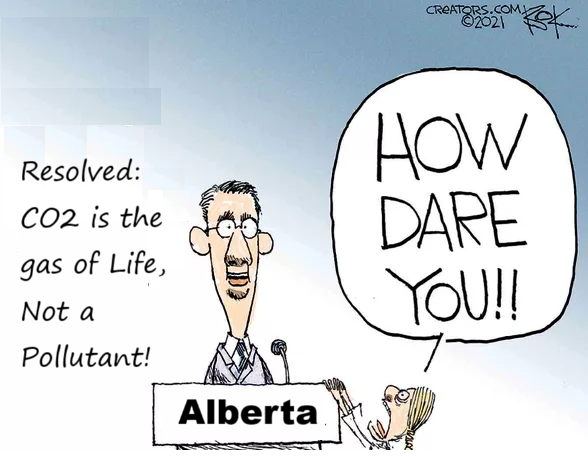
- Enough idiot green moralizing.
- Enough carbon tax.
- Enough bloody net zero. And how about this–
- Enough multiculturalism and destruction of the Canadian identity.
“Why belong, so expensively, to a country that despises its own history, economy
and people? Make us a better offer, and quickly, my Canadian friends—
or Trump’s tariffs will be the least of your problems.”
And all of this would be not only be good for Alberta — and, by extension, for the working people of Canada — it is also absolutely necessary for Canada, even, perhaps to survive, both economically and politically. There’s a reason we, like the Europeans, now make a measly sixty cents for every dollar made by our American “friends.” That reason has much to do with the attitudes we have adopted ever since the benighted 1960s that have made us not such good friends at all.
Trump is threatening the integrity of Canada, and very effectively. The fact of that threat, and of its effectiveness, might make us think twice. In such thinking, there could be the opportunity to shed the idiocy that is making us poor, weak, irrelevant on the international stage, and contemptible to our neighbours. We could make his sabre-rattling into an opportunity, increase our cross-border trade, get out of our own way on the energy front, rekindle our national pride at least to the point where we regard our country as both viable and valuable, seek the international markets that would make us more truly independent as a nation, strengthen our commitment to the military that would be increasingly and truly necessary if such independence was pursued, and make of the next hundred years Canada’s triumph instead of the story of its contemptible, self-aggrandizing, moralistic, falsely green and socialist demise.


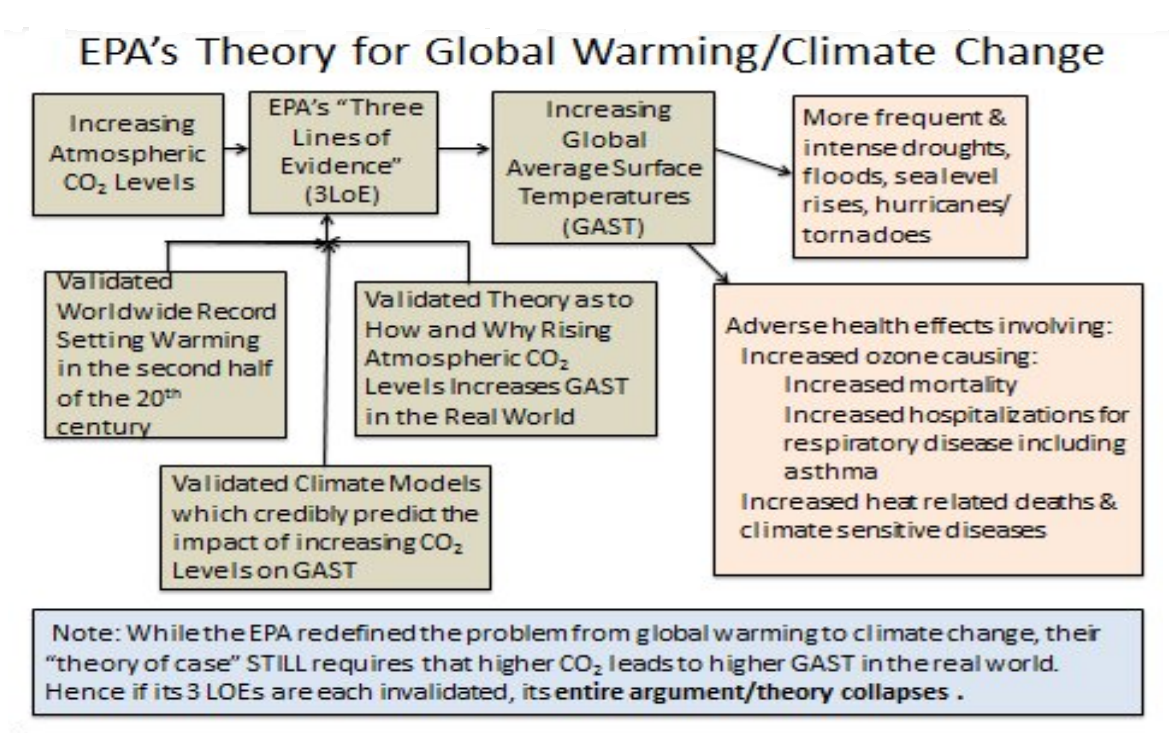
 The news is EPA Director Zeldin has submitted recommendations to President Trump but the content has not yet been made public. How significant is this issue for climate activists? Just read the hysterical response by Sierra Club
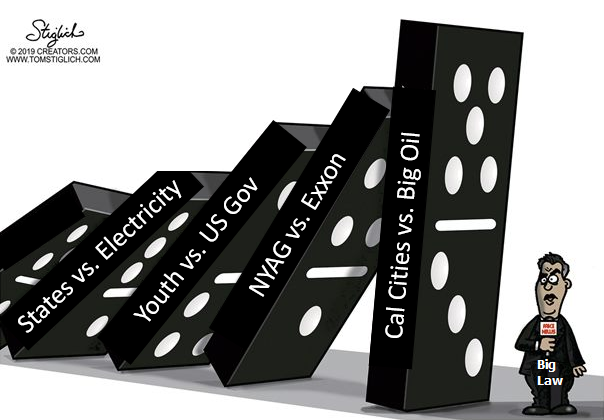


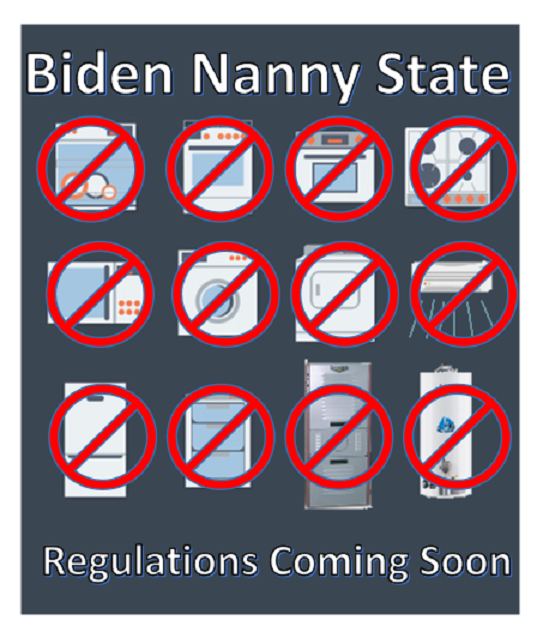
 Maydeen Merino reports at Washington Times House leadership lays out target list of Biden climate rules to cancel. Excerpts in italics with my bolds and added images.


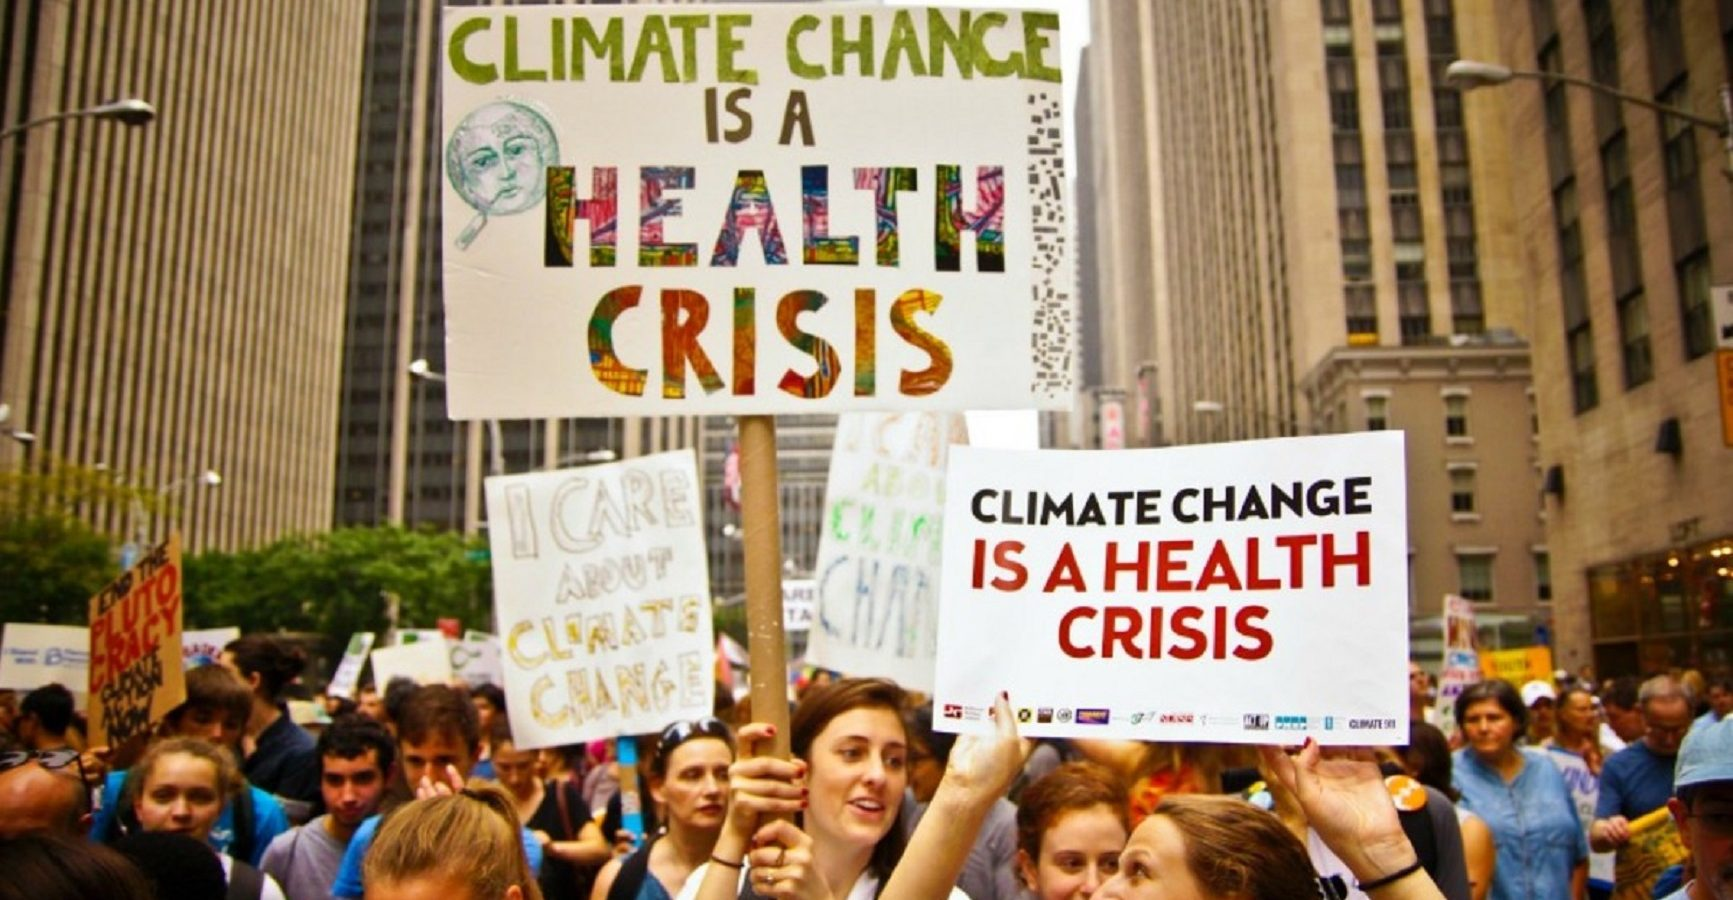
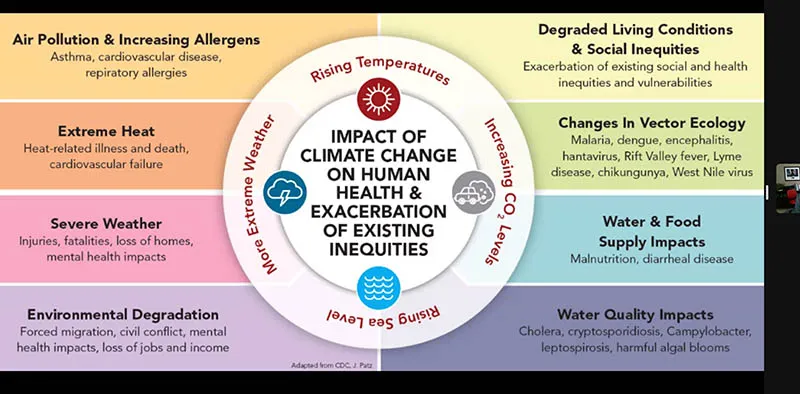
 Advances in medical science and public health have benefited billions of people with longer and higher quality lives. Yet this crucial social asset has joined the list of those fields corrupted by the dash for climate cash. Increasingly, medical talent and resources are diverted into inventing bogeymen and studying imaginary public health crises.