2025 ended with a steadily declining rate of rising CO2 in the atmosphere following a 20 month cooling since April 2024, peak of an unusual and unexplained warming spike. Historical records show that around 1875 was the coldest time in the last 10,000 years. That was the end of the Little Ice Age (LIA), and since then temperatures have warmed at an average rate of about 0.5C per century. The recovery of the biosphere and ocean warming resulted in rising levels of CO2 in the atmosphere.

Syun-Ichi Akasofu, founder of the University of Alaska Fairbanks’ Geophysical Institute reported on this pattern in 2009.
At times, there are warming spikes, in the 1930s and 40s for example, and the rate of rising CO2 goes up. At other times, such as 1950s and 60s, temperatures cool, and rising CO2 slows down. More recently, in 2023 and 24, we saw temperatures spike up before falling back down in 2025. [Note: A study of ocean biochemistry processes confirms that since the end of the LIA rising temperatures have been accompanied by rising CO2 at a rate of ~2 ppm per year. [ See: Slam Dunk: Δtemp Drives Δco2, Ocean Biochemistry at Work ]
Furthermore, going back to previous warmings prior to the satellite record shows that the entire rise of 0.8C since 1947 is due to oceanic, not human activity.

Importantly, the theory of human-caused global warming asserts that increasing CO2 in the atmosphere changes the baseline and causes systemic warming in our climate. On the contrary, all of the warming since 1947 was episodic, coming from three brief events associated with oceanic cycles. And in 2024 we saw an amazing episode with a temperature spike driven by ocean air warming in all regions, along with rising NH land temperatures, now dropping well below its peak.
Previously I have demonstrated that changes in atmospheric CO2 levels follow changes in Global Mean Temperatures (GMT) as shown by satellite measurements from University of Alabama at Huntsville (UAH). A link to that background post is provided later below.
My curiosity was piqued by the remarkable GMT spike starting in January 2023 and rising to a peak in April 2024. GMT has declined steadily, and now 20 months later, the anomaly is 0.30C down from 0.94C. I also became aware that UAH has recalibrated their dataset due to a satellite drift that can no longer be corrected. The values since 2020 have shifted slightly in version 6.1, as shown in my recent report UAH Ocean Stays Cool, SH Land Warms, October 2025, The data here comes from UAH record of temperatures measured in the lower troposphere (TLT).
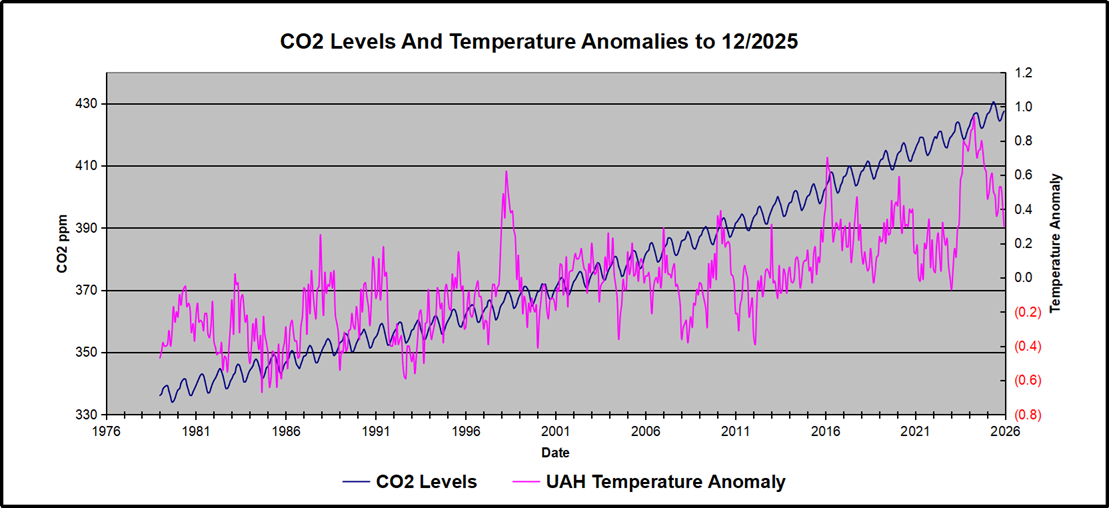
This post updates the analysis with the complete observations for 2025, testing the premise that temperature changes are predictive of changes in atmospheric CO2 concentrations. The chart at the top shows the two monthly datasets: CO2 levels in blue reported at Mauna Loa, and Global temperature anomalies in purple reported by UAHv6.1, both through December 2025. Would such a sharp increase in temperature be reflected in rising CO2 levels, according to the successful mathematical forecasting model? Would CO2 levels decline as temperatures dropped following the peak?
The answer is yes: that temperature spike resulted
in a corresponding CO2 spike as expected.
And lower CO2 levels followed the temperature decline.
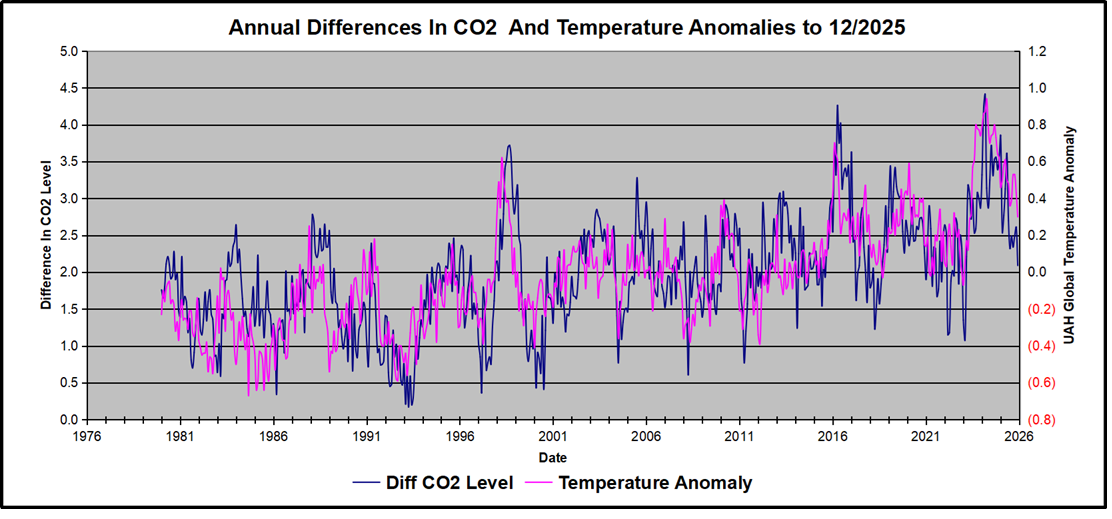
Above are UAH temperature anomalies compared to CO2 monthly changes year over year.
Changes in monthly CO2 synchronize with temperature fluctuations, which for UAH are anomalies referenced to the 1991-2020 period. CO2 differentials are calculated for the present month by subtracting the value for the same month in the previous year (for example December 2025 minus December 2024). Temp anomalies are calculated by comparing the present month with the baseline month. Note the recent CO2 upward spike and drop following the temperature spike and drop.
The table below shows clearly the pattern of observed temperatures declining along with declining rates of rising observed CO2. The CO2 rate peaked at 4.41 ppm, then declined over the next 21 months to 2.09 ppm, nearly the baseline rate since the LIA. There are fluctuations in the CO2 monthly response since the differential is influenced by the previous year as well as current year. By 2025/12, the rate of 2.09 ppm was less than half the peak rate of 4.41 ppm.
| Month | temperature anomaly | co2 Diff. from previous year |
| 2024\1 | 0.79 | 3.32 |
| 2024\2 | 0.86 | 4.23 |
| 2024\3 | 0.87 | 4.41 |
| 2024\4 | 0.94 | 3.14 |
| 2024\5 | 0.78 | 2.87 |
| 2024\6 | 0.70 | 3.25 |
| 2024\7 | 0.74 | 3.72 |
| 2024\8 | 0.75 | 3.31 |
| 2024\9 | 0.80 | 3.53 |
| 2024\10 | 0.73 | 3.56 |
| 2024\11 | 0.64 | 3.39 |
| 2024\12 | 0.62 | 3.54 |
| 2025\1 | 0.46 | 3.85 |
| 2025\2 | 0.50 | 2.54 |
| 2025\3 | 0.58 | 2.77 |
| 2025\4 | 0.61 | 3.13 |
| 2025\5 | 0.50 | 3.61 |
| 2025\6 | 0.48 | 2.70 |
| 2025\7 | 0.36 | 2.32 |
| 2025\8 | 0.39 | 2.49 |
| 2025\9 | 0.53 | 2.34 |
| 2025\10 | 0.53 | 2.49 |
| 2025\11 | 0.43 | 2.61 |
| 2025\12 | 0.30 | 2.09 |
The final proof that CO2 follows temperature due to stimulation of natural CO2 reservoirs is demonstrated by the ability to calculate CO2 levels since 1979 with a simple mathematical formula:
For each subsequent year, the CO2 level for each month was generated
CO2 this month this year = a + b × Temp this month this year + CO2 this month last year
The values for a and b are constants applied to all monthly temps, and are chosen to scale the forecasted CO2 level for comparison with the observed value. Here is the result of those calculations.
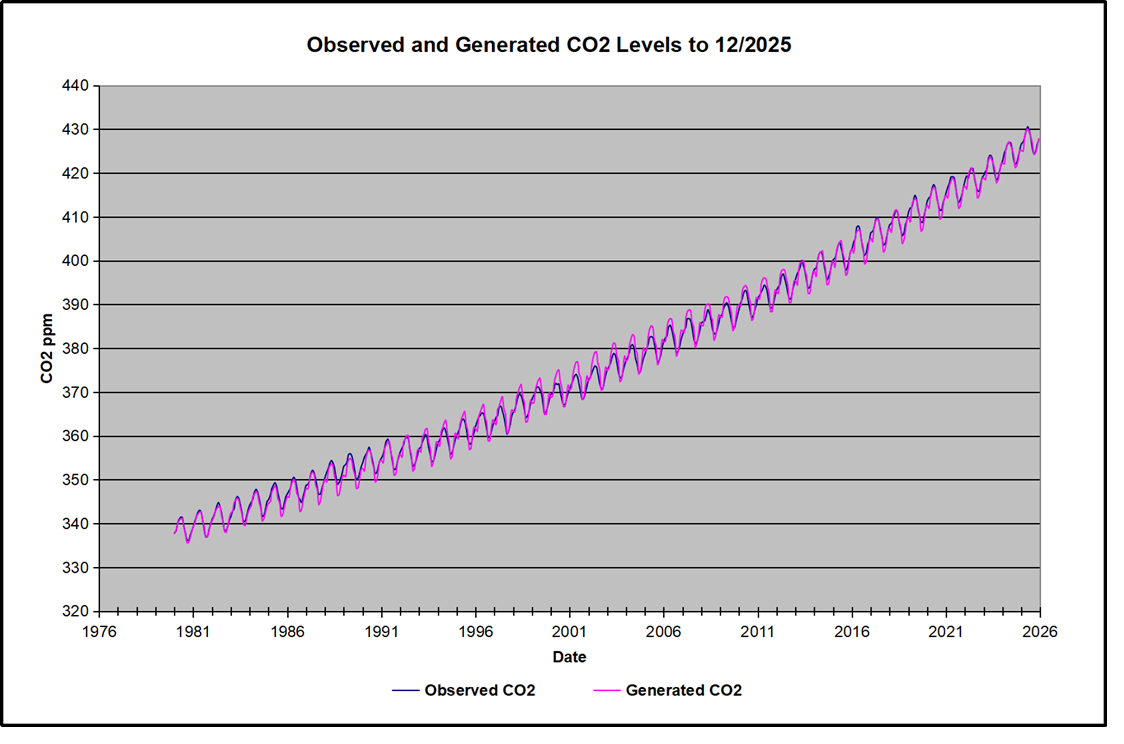
In the chart calculated CO2 levels correlate with observed CO2 levels at 0.9988 out of 1.0000. This mathematical generation of CO2 atmospheric levels is only possible if they are driven by temperature-dependent natural sources, and not by human emissions which are small in comparison, rise steadily and monotonically. For a more detailed look at the recent fluxes, here are the results since 2015, an ENSO neutral year.
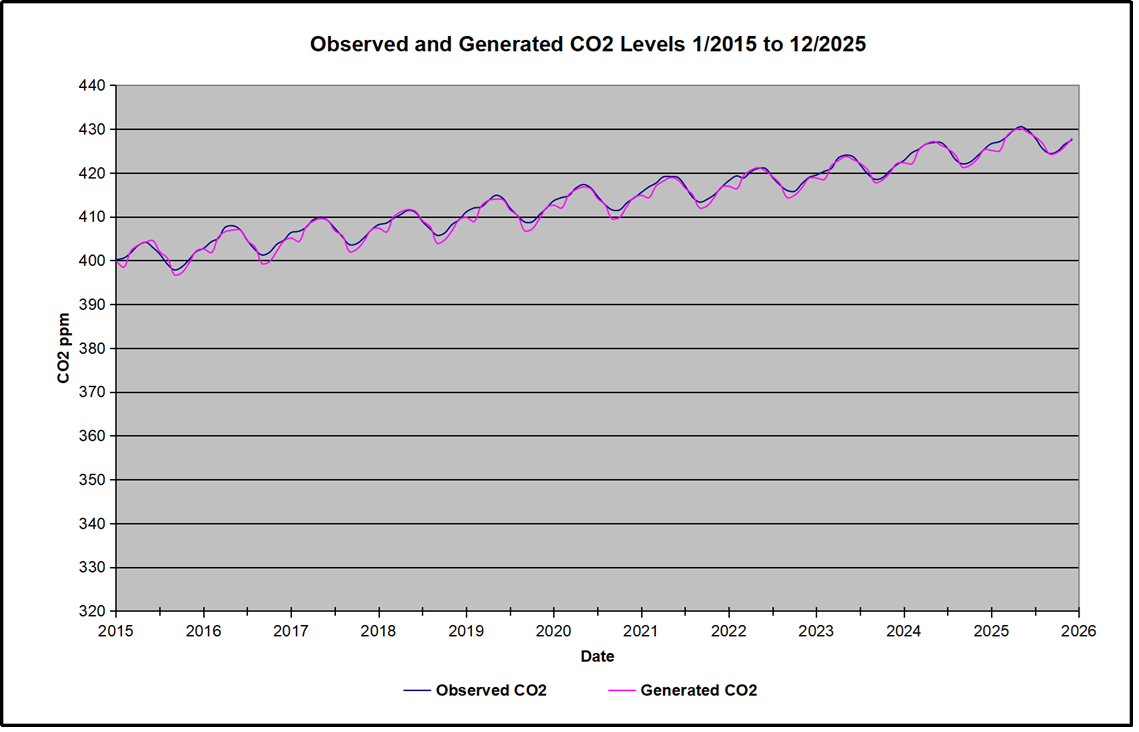
For this recent period, the calculated CO2 values match well the annual highs, while some annual generated values of CO2 are slightly higher or lower than observed at other months of the year. Still the correlation for this period is 0.9942.
Key Point
Changes in CO2 follow changes in global temperatures on all time scales, from last month’s observations to ice core datasets spanning millennia. Since CO2 is the lagging variable, it cannot logically be the cause of temperature, the leading variable. It is folly to imagine that by reducing human emissions of CO2, we can change global temperatures, which are obviously driven by other factors.

Background on Analytics and Methodology


It’s amazing that no matter how many times we present this unequivocal evidence, popular culture, official government, and industry pronouncements continue to insist the contrary! When does it end?
LikeLike
Ron, do you have, or have you already posted, a time. series comparison of Global Average Surface Temperature, Atmospheric CO2 increase and global anthropogenic CO2 production?
I’m being lazy and getting ready to head out for a bike ride. If not, I’ll do the research later.
LikeLike
Michael, lucky you. Here, north of Montreal a bike requires fat snow tires. Here’s some references on comparing natural and human co2 emissions.
LikeLike
Thanks! Great help.
Before I moved down to California in 2000 I lived in Fairbanks, Alaska, where I biked every day on snow machine trails, 8 miles in to town and 8 miles back home. 40, 50 below zero. Yep, fat tires, light weight lubes, layers of clothing, balaclava, pogies (hand covers on the handlebars), and neoprene shoe covers. The hardest part was meeting moose on the trail and having to backtrack to an alternate route.
Now I’m in biking paradise!
LikeLike