Tom Harris and Todd Royal explain why “official” temperature history from Canada government is distorted to invent warming where very little has actually ocurred. Their article: Is Canada basing its climate policies on ‘decision-based evidence-making?’ Excerpts in italics with my bolds and added images.
Politicians want us to believe that they base their decisions on solid, verifiable evidence. “Evidence-based decision-making,” they call it. But what if the decision is made first and then the data is selected, or left uncorrected, in order to support the now politically correct decision? That would then be “decision-based evidence-making.” In other words, a complete corruption of honest decision-making.

It seems that Environment and Climate Change Canada (ECCC) is doing exactly that with the country’s temperature data in order to support the government’s mantra that Canada is “warming twice as fast as the global average.” For, if the one-degree anomalous spike in Canada’s “mean temperature” in 1998 is removed from the data, as even ECCC researchers themselves advocated previously should be done to preserve data integrity in cases like this, then Canada is not warming at all and much of the $200 billion spent on the climate file by the federal Liberal government since 2015 is a complete waste.
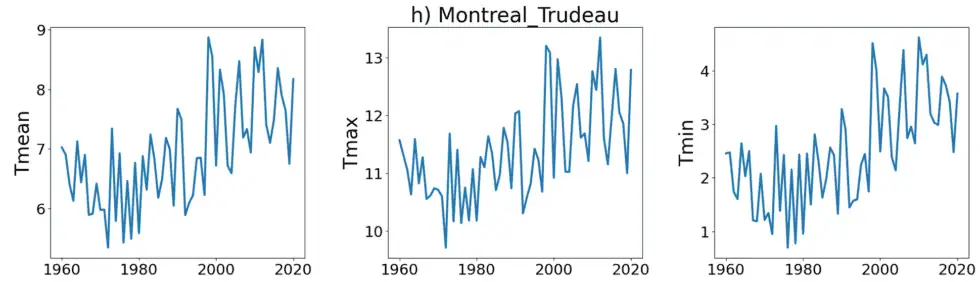
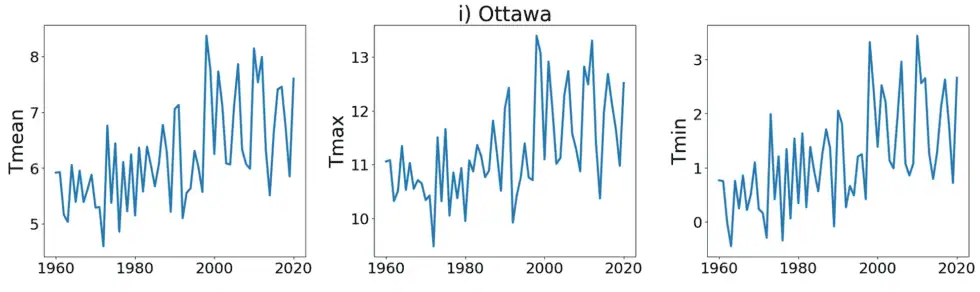
In 2021, Dr. Joseph Hickey, a data scientist with a PhD in Physics, specializing in complexity science, then an employee of the Bank of Canada, alerted ECCC to this one-degree jump in temperature data across much of Canada, and asked for an explanation. The below graphs of mean, maximum and minimum temperatures constructed with data from three Canadian cities—Moncton (on which Hickey illustrates the step change with red lines), Ottawa and Montreal—are samples of those created by Hickey using ECCC data downloaded on November 11, 2025, data that is the same as that he sent to ECCC researchers as an attachment to his email of June 24, 2021.
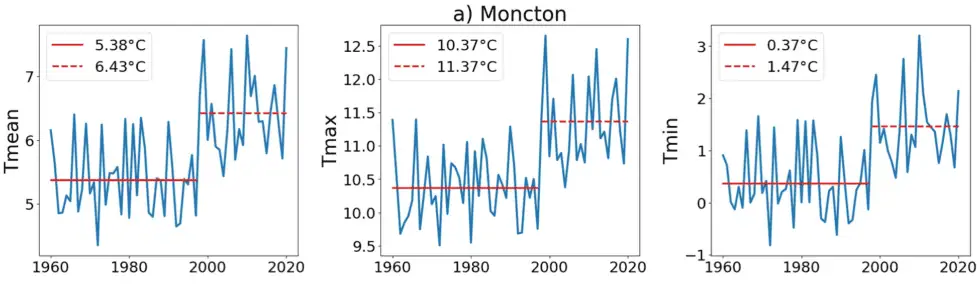
Ignoring their previous position about the need to remove such sudden discontinuities from the data, ECCC staff had little to say and left the anomaly in the record, asserting that it was “probably” a real sudden change in temperature.
Making matters worse, another Bank of Canada employee, economist Julien McDonald-Guimond, had already alerted ECCC by email on December 7, 2020, that he had found more than 10,000 instances of days for which the daily minimum temperature was greater than the daily maximum temperature. Again, ECCC staff had no reasonable justification.
With the Canadian government no longer his employer, so Hickey is now free to tell us all what has been going on behind the scenes. This Hickey did on December 23, 2025, when he published the blockbuster report “Artificial stepwise increases in homogenized surface air temperature data invalidate published climate warming claims for Canada.”
Dr. Hickey shows that, if you apply ECCC’s trend analysis method to their data, you find an increase of 1.74° C (which is statistically significant) from 1948 to 2018. And then, he tells us, if you correct for the one-degree step increase in 1998, you find only a 0.29°C rise. That small change “is indistinguishable from zero,” explains Hickey. “There is no evidence of warming.”
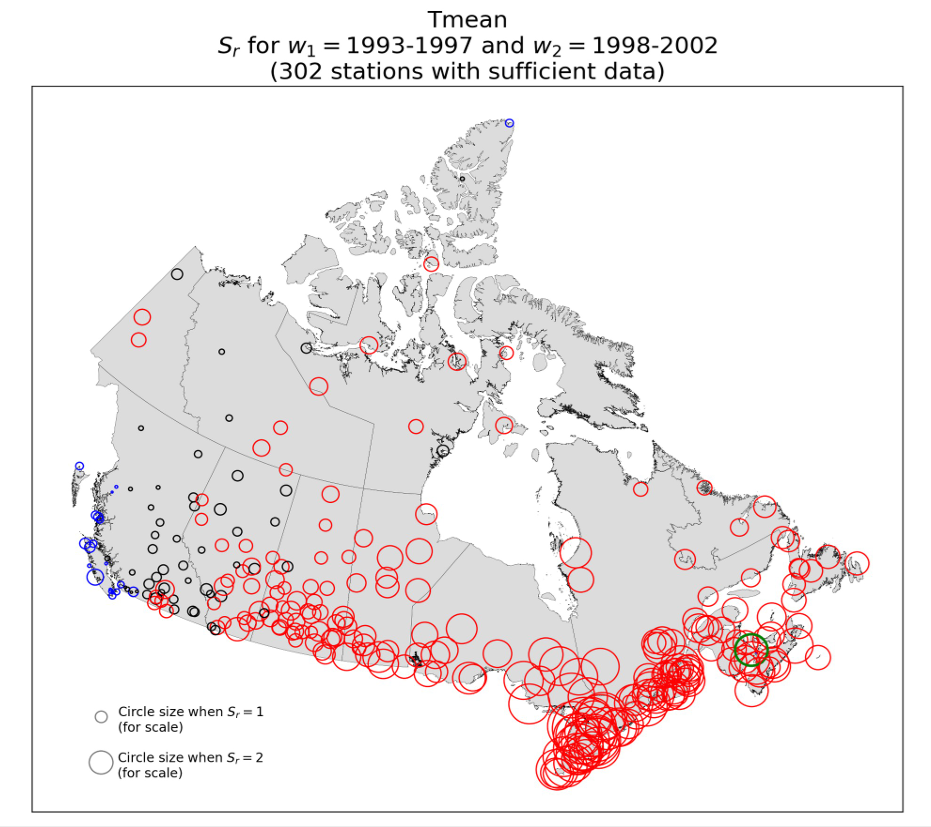
Figure 7: Map showing Sr calculated using Tmean, for the break year 1998 with two five-year windows (1993-1997 and 1998-2002) for the 302 3rd generation AHCCD stations with sufficient data. Circle radius is proportional to the absolute value of Sr. Circle colour indicates Sr ranges as follows: blue: Sr < 0; black: 0 ≤ Sr ≤ 1; red: Sr > 1. Moncton, NB (Sr = 2.74) is indicated with a green circle, for reference.
In Figure 7, AHCCD stations with Sr < 0 are coloured blue, while black indicates 0 ≤ Sr ≤ 1, and red indicates Sr > 1. The AHCCD records with the largest stepwise increases at 1998 are located in Eastern and Central Canada (including the stations listed in Table A), and there are many records with discernible steps at 1998 in the Prairies (provinces of Manitoba, Saskatchewan, and Alberta) and the north of the country. British Columbia remains the main outlier, with most ofits AHCCD stations having no discernible steps at 1998.
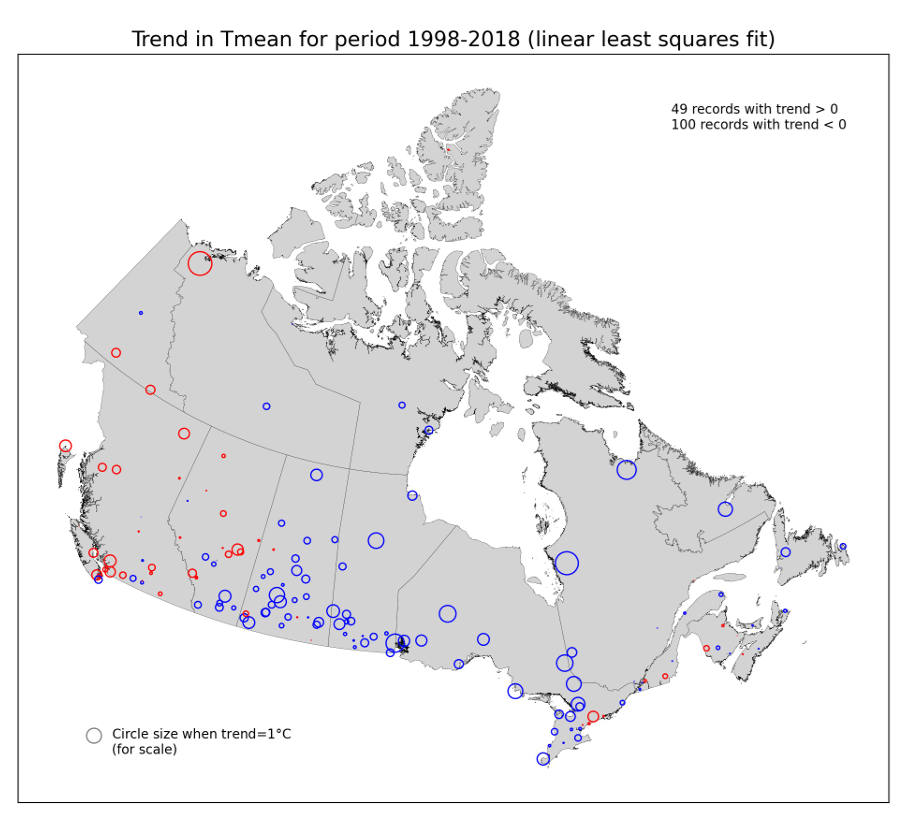
Figure 8: Map of trend in Tmean over the period 1998-2018, for the 3rd generation AHCCD stations with sufficient data, calculated using linear least-squares fitting. Circle radius is proportional to the absolute value of the trend. Blue circles correspond to negative trends (trend < 0) and red circles to positive trends (trend > 0).
In Figure 8, the trend for a particular Tmean record is equal to the slope (°C/year) from a linear least-squares fit to its data for 1998-2018, times 21 years. An AHCCD station was considered to have sufficient data if its record had at least 350 days of non-missing daily data per year for every year from 1998 2018. Approximately two thirds of the AHCCD records with sufficient data have negative trends for 1998-2018 using linear least-squares fitting.
Summation
This report demonstrates Environment Canada’s dismissive response to being alerted to a large, apparently non-climatic artifact in its flagship temperature time-series product, an artifact which could, on its own, be responsible for essentially all of the calculated warming for many Canadian locations over the past six or seven decades.
The said apparent artifact, referred to as the “1998 step-increase feature” in this report, is a stepwise increase of approximately 1°C in magnitude occurring at 1998 in the annual mean time-series of daily maximum, minimum, and mean temperatures for many stations across Canada in Environment Canada’s Adjusted and Homogenized Canadian Climate Data (AHCCD).

Thanks so much for boosting this, Ron!
Tom
LikeLike
You’re welcome Tom. Keep up the good work, hopefully our tippng point is happening.
LikeLike
Liquid in Glass to platinium resistance thermometer change ?
LikeLike
Not sure Paul. I did find this note regarding shift to metric thermometers:
“The Metric Commission’s plan was for Environment Canada to issue its forecasts in Celsius only on April 1, 1975, leaving it to media outlets to decide if they also wanted to include Fahrenheit readings. At least one American television station that also served a Canadian market, WCAX in Burlington, Vt. (which was seen in Montreal), decided to include Celsius in its forecasts.
A major hiccup occurred when Environment Canada did not ship new thermometers to weather stations in time for the conversion. Media reports quoted an unnamed agency official who suggested it was a money-saving move, and existing $10 instruments would be replaced as they broke. Environment Canada quickly changed the story, with Toronto-based service administrator Roy Lee claiming that orders for 10,000 thermometers were placed two years earlier, but only 2,000 had arrived, and required extensive calibration before being approved for use. It was expected all of the old thermometers would be replaced within nine months.”
There was also a technique for homogenizing station records introduced in the 1998-1999 period. Authors of the report extract above did note approvingly that warming results in Canada were consistent with US measurements and that 1998 was the “hottest year on record.”
Perhaps more important was the shift to digital thermometers in the 1980s and 90s. Those used thermocouples and metallic strips like platinum.
https://www.canadashistory.ca/explore/arts-culture-society/measuring-change
LikeLike