Canada Wildfire Data vs. Fears

Traffic moves along One World Trade Center in New York City amid smokey haze from wildfires in Canada.Andy Bao / AP June 2026

There’s been a lot of concern this summer about Canada wildfires along with claims about global warming/climate change being the cause.  This post is to provide data and history as context for understanding what happens in this boreal forest.  First an update from the Canadian Wildland Fire Information System (CWFIS).

The map shows the current distribution of wildfires in Canada and hotspots as of August 6, 2026. The Eastern part has now reduced down greatly.  The action now is in the West along the US border. The infographic provides the data on Active fires, new fires and extinguished fires. There are numbers for year to date and 10 yr. averages. The graph on the left shows area burned each year from 2017 through 2026 to date. Humans caused 42% of the number of wildfires, and nature caused 92% of the area burned.

As Chris Martz pointed out in an interview, boreal forests burn every year as part of their natural life cycle. Also Canada forests are vast and remote so that management is challenging.  A previous post here mentioned that some practices can and should be improved, especially since recent years have been more active and destructive, especially 2023, 25 and now 2026. Martz also provided some data contradicting the notion global warming is the cause.

The drought and heat wave indices are where climatic effects would show up.  Yes there are recent spikes, but also numerous precedents in the past. In neither case do the patterns reflect rising CO2, let alone human hydrocarbon use.  In fact there is a significant decrease in the worst of the drought categories despite the spike in 2023–24.


Climate Alarmists Gone?

Transcript (with my bolds and added images)

Who is still panicking about climate catastrophe?

The Davos crowd? European Commission President Ursula von der Leyen didn’t mention the climate even once in her 2026 annual address—unlike in the past.

U.S. voters? Americans rank climate change at number 28 of 30 problems, and according to the Searchlight Institute, voters in battleground states are prioritizing pocketbook issues over climate.  

Canada? Prime Minister Mark Carney once championed radical climate policies but now wants to increase oil production.

The Europeans? After worrying intensely about climate change for a decade, they have other things to worry about: sky-high energy prices, low growth and the war in Ukraine. In their latest ranking, climate hit a new decade low.

How about global warming poster child Greta Thunberg? She has moved on to other causes.

Certainly, not people in poorer countries. They’re primarily concerned about the necessities of life — health, food and education. According to a recent survey of Africans, climate ranks near the bottom of their priorities, at number 31 of 34. That’s behind unemployment, the economy, health, education, poverty, roads, electricity, hunger, and corruption.

Even media outlets that once peddled climate alarm have backed off. According to a Washington Post analysis, 2025 saw the fewest media mentions of climate change in three years.

What led to this global change of mind? How could so many people
be so worried just a few years ago, and care so much less now?

First, everyone has started to realize that there are many other challenges in the world. 

After the end of the Cold War, people claimed that climate change was the last big challenge to fix. That was a common idea at Davos and among many global leaders. Now, everyone recognizes that climate change is just one of many issues: wars, budget deficits, immigration pressures, declining educational achievements, artificial intelligence, and demographic changes are just a few.

Second, you can only cry wolf so many times. 

How many “the end is nigh” predictions over the last 50 years?

One peer-reviewed study counted at least 78 specific claims, like when King Charles insisted that the world only had 18 months left to fix climate change. That was in 2019. So, that statement was wrong. And every statement by every well-known climate alarmist that has been resolved by 2026 turned out to be wrong. Not to mention when Al Gore told us in 2008 we only had 10 years left.

Third, climate policies are incredibly expensive and do little. 

The world has spent more than 16 trillion dollars to curb climate change, and governments are looking to spend hundreds of trillions more in the future.

A Science study of 1,500 climate policies in 41 countries across the last two decades showed that only 4% worked. In total, they cut less than a quarter of one percent of total emissions. If a private company had this kind of record, they’d be out of business.

Fourth, the alarmist claims are often blatantly misleading. When you’re told that sea level rise could force 187 million people to move, that claim unrealistically assumes nobody will do anything to address the problem for a century. But when people adapt — for example, by building levies — that number goes down 99.8%.

The Dutch solution to floods: live with water, don’t fight it. The same thing applies to climate change.

We’re constantly told more people will die from heat waves. But nobody ever reveals that the cold kills many more. Right now, warming temperatures actually save lives. And of course, when there’s cheap and reliable power, more people can afford air conditioning. As the US warmed in the 20th century, heat deaths declined significantly, exactly for that reason.

Climate economists have consistently shown that by the end of the century, climate change will cost 2-3% of global GDP. It is a real problem, but nowhere near Armageddon.

In fact, as the UN expects the average person to be 450% richer in 2100, climate change simply means it is going to feel like we’re ‘only’ 435% richer than now. That’s still a much better world — just not quite as good as it could have been.

We still need to fix climate change, but we can do so smarter. Don’t pour trillions into policies that don’t move the needle, but billions into green energy R&D. This will help develop cheap green energy alternatives that can eventually outcompete fossil fuels on price.

Ending the climate panic means our kids won’t be needlessly scared, and neither will we. Being frightened without reason doesn’t lead to smart policies.

Rather, we can start focusing more on the many other pressing problems we need to fix now. Putting the climate panic behind us makes that possible.

I’m Bjorn Lomborg, president of the Copenhagen Consensus, visiting fellow at Stanford University’s Hoover Institution, and author of False Alarm, for Prager University.

July 2026 SH Ocean Cools, Land Warms, Global UAH Stable

The post below updates the UAH record of air temperatures over land and ocean. Each month and year exposes again the growing disconnect between the real world and the Zero Carbon zealots.  It is as though the anti-hydrocarbon band wagon hopes to drown out the data contradicting their justification for the Great Energy Transition.  Yes, there was warming from an El Nino buildup coincidental with North Atlantic warming, but no basis to blame it on CO2.

As an overview consider how recent rapid cooling  completely overcame the warming from the last 3 El Ninos (1998, 2010 and 2016).  The UAH record shows that the effects of the last one were gone as of April 2021, again in November 2021, and in February and June 2022  At year end 2022 and continuing into 2023 global temp anomaly matched or went lower than average since 1995, an ENSO neutral year. (UAH baseline is now 1991-2020). Then there was an usual El Nino warming spike of uncertain cause, unrelated to steadily rising CO2, and now dropping back toward normal values.

For reference I added an overlay of CO2 annual concentrations as measured at Mauna Loa.  While temperatures fluctuated up and down ending flat, CO2 went up steadily by ~66 ppm, an 18% increase.

Furthermore, going back to previous warmings prior to the satellite record shows that the entire rise of 0.8C since 1947 is due to oceanic, not human activity.

gmt-warming-events

The animation is an update of a previous analysis from Dr. Murry Salby.  These graphs use Hadcrut4 and include the 2016 El Nino warming event.  The exhibit shows since 1947 GMT warmed by 0.8 C, from 13.9 to 14.7, as estimated by Hadcrut4.  This resulted from three natural warming events involving ocean cycles. The most recent rise 2013-16 lifted temperatures by 0.2C.  Previously the 1997-98 El Nino produced a plateau increase of 0.4C.  Before that, a rise from 1977-81 added 0.2C to start the warming since 1947.

Importantly, the theory of human-caused global warming asserts that increasing CO2 in the atmosphere changes the baseline and causes systemic warming in our climate.  On the contrary, all of the warming since 1947 was episodic, coming from three brief events associated with oceanic cycles. And in 2024 we saw an amazing episode with a temperature spike driven by ocean air warming in all regions, along with rising NH land temperatures, now dropping well below its peak.

Chris Schoeneveld has produced a similar graph to the animation above, with a temperature series combining HadCRUT4 and UAH6. H/T WUWT

image-8

See Also Worst Threat: Greenhouse Gas or Quiet Sun?

July 2026 UAH Temps: SH Ocean Cools, Offsets Land Warming banner-blog

With apologies to Paul Revere, this post is on the lookout for cooler weather with an eye on both the Land and the Sea.  While you heard a lot about 2020-21 temperatures matching 2016 as the highest ever, that spin ignores how fast the cooling set in.  The UAH data analyzed below shows that warming from the last El Nino had fully dissipated with chilly temperatures in all regions. After a warming blip in 2022, land and ocean temps dropped again with 2023 starting below the mean since 1995.  Spring and Summer 2023 saw a series of warmings, continuing into 2024 peaking in April, then cooling off to the present.

UAH has updated their TLT (temperatures in lower troposphere) dataset for July 2026. Due to one satellite drifting more than can be corrected, the dataset has been recalibrated and retitled as version 6.1 Graphs here contain this updated 6.1 data.  Posts on their reading of ocean air temps this month are ahead the update from HadSST4 I posted recently on May 2026 SSTs Cease Warming. These posts have a separate graph of land air temps because the comparisons and contrasts are interesting as we contemplate possible cooling in coming months and years.

Sometimes air temps over land diverge from ocean air changes. 2025 showed a sharp contrast between land and sea, first with ocean air temps falling in January recovering in February.  Then in November and December SH land temps spiked while ocean temps showed litle change. In February 2026 NH land temps doubled, from Dec. 0.53C up to 1.14C last month.  Despite SH land changing little, and Tropical land cooling, the Global land anomaly jumped up from 0.53 to 0.93C.  That reversed in March with both NH land and Global land anomaly back down to 0.63C. That cooling offset SH Ocean warming doubling from 0.19C to 0.38C. In May was a warming spike in Tropics and SH ocean air while NH ocean air was flat. At the same time, Land air temps warmed in Tropics and NH while dropping in SH.  The unusual end result for May was Global, Land and Ocean air temp anomalies all showing the same 0.53C. In June SH land dropped sharply along with some SH ocean cooling, pulling down Global anomalies. Now in July, SH ocean cooled offsetting Global land warming.

Note:  UAH has shifted their baseline from 1981-2010 to 1991-2020 beginning with January 2021.   v6.1 data was recalibrated also starting with 2021. In the charts below, the trends and fluctuations remain the same but the anomaly values changed with the baseline reference shift.

Presently sea surface temperatures (SST) are the best available indicator of heat content gained or lost from earth’s climate system.  Enthalpy is the thermodynamic term for total heat content in a system, and humidity differences in air parcels affect enthalpy.  Measuring water temperature directly avoids distorted impressions from air measurements.  In addition, ocean covers 71% of the planet surface and thus dominates surface temperature estimates.  Eventually we will likely have reliable means of recording water temperatures at depth.

Recently, Dr. Ole Humlum reported from his research that air temperatures lag 2-3 months behind changes in SST.  Thus cooling oceans portend cooling land air temperatures to follow.  He also observed that changes in CO2 atmospheric concentrations lag behind SST by 11-12 months.  This latter point is addressed in a previous post Who to Blame for Rising CO2?

After a change in priorities, updates are now exclusive to HadSST4.  For comparison we can also look at lower troposphere temperatures (TLT) from UAHv6.1 which are now posted for July 2026.  The temperature record is derived from microwave sounding units (MSU) on board satellites like the one pictured above. Recently there was a change in UAH processing of satellite drift corrections, including dropping one platform which can no longer be corrected. The graphs below are taken from the revised and current dataset.

The UAH dataset includes temperature results for air above the oceans, and thus should be most comparable to the SSTs. There is the additional feature that ocean air temps avoid Urban Heat Islands (UHI).  The graph below shows monthly anomalies for ocean air temps since January 2015.

After sharp cooling everywhere in January 2023, there was a remarkable spiking of Tropical ocean temps from -0.5C up to + 1.2C in January 2024.  The rise was matched by other regions in 2024, such that the Global anomaly peaked at 0.86C in April. Since then all regions have cooled down sharply to a low of 0.27C in January.  In February 2025, SH rose from 0.1C to 0.4C pulling the Global ocean air anomaly up to 0.47C, where it stayed in March and April. In May drops in NH and Tropics pulled the air temps over oceans down despite an uptick in SH. At 0.43C, ocean air temps were similar to May 2020, albeit with higher SH anomalies. In November/December all regions were cooler, led by a sharp drop in SH bringing the Global ocean anomaly down to 0.02C. In 2026, ocean warming was evident, with Tropics and SH pulling up Global ocean air temps despite little rise in NH ocean. Now in June and July that has reversed with SH cooling and pulling down the Global ocean anomaly, even despite tropical warming.

Land Air Temperatures Tracking in Seesaw Pattern

We sometimes overlook that in climate temperature records, while the oceans are measured directly with SSTs, land temps are measured only indirectly.  The land temperature records at surface stations sample air temps at 2 meters above ground.  UAH gives tlt anomalies for air over land separately from ocean air temps.  The graph updated for July is below.

Here we have fresh evidence of the greater volatility of the Land temperatures, along with extraordinary departures by SH land.  The seesaw pattern in Land temps is similar to ocean temps 2021-22, except that SH is the outlier, hitting bottom in January 2023. Then exceptionally SH goes from -0.6C up to 1.4C in September 2023 and 1.8C in  August 2024, with a large drop in between.  In November, SH and the Tropics pulled the Global Land anomaly further down despite a bump in NH land temps. February showed a sharp drop in NH land air temps from 1.07C down to 0.56C, pulling the Global land anomaly downward from 0.9C to 0.6C. Some ups and downs followed with returns close to February values in August.  A remarkable spike in October was completely reversed in November/December, along with NH dropping sharply bringing the Global Land anomaly down to 0.52C, half of its peak value of 1.17C 09/2024. In 2026 January and February Global land rebounded up to 1.14C, led by a NH warming spike. That NH spike was reversed in March and April back down to 0.43C.  In May the Global land anomaly went back up to 0.53C with all regions around that value. Then in June land temps in SH plunged nearly 0.6C down to 0.2C, pulling Global land anomaly down more than 0.1C. July saw Global land temps up again with warming in all regions.

The Bigger Picture UAH Global Since 1980

The chart shows monthly Global Land and Ocean anomalies starting 01/1980 to present.  The average monthly anomaly is -0.02 for this period of more than four decades.  The graph shows the 1998 El Nino after which the mean resumed, and again after the smaller 2010 event. The 2016 El Nino matched 1998 peak and in addition NH after effects lasted longer, followed by the NH warming 2019-20.   An upward bump in 2021 was reversed with temps having returned close to the mean as of 2/2022.  March and April brought warmer Global temps, later reversed

With the sharp drops in Nov., Dec. and January 2023 temps, there was no increase over 1980. Then in 2023 the buildup to the October/November peak exceeded the sharp April peak of the El Nino 1998 event. It also surpassed the February peak in 2016. In 2024 March and April took the Global anomaly to a new peak of 0.94C.  The cool down started with May dropping to 0.9C, later months declined steadily until  August Global Land and Ocean was down to 0.39C. then rose slightly to 0.53 in October, before dropping. to 0.3C in December.  By May 2026 the anomaly was back up to 0.53C, now holding at 0.48C in July.

The graph reminds of another chart showing the abrupt ejection of humid air from Hunga Tonga eruption.

TLTs include mixing above the oceans and probably some influence from nearby more volatile land temps.  Clearly NH and Global land temps have been dropping in a seesaw pattern, nearly 1C lower than the 2016 peak.  Since the ocean has 1000 times the heat capacity as the atmosphere, that cooling is a significant driving force.  TLT measures started the recent cooling later than SSTs from HadSST4, but are now showing the same pattern. Despite the three El Ninos, their warming had not persisted prior to 2023, and without them it would probably have cooled since 1995.  Of course, the future has not yet been written.

Canada Govt. Aids and Abets Forest Fires

Traffic moves along One World Trade Center in New York City amid smokey haze from wildfires in Canada.Andy Bao / AP June 2026

Dr. Joseph Fournier explains the situation in his Daily Wire article Blame Canada’s Terrible Regulations For Wildfires Ruining America’s Summer.  Excerpts in italics with my bolds and added images.

It’s a perfect storm of the decline of local lumber industries
and the policies put in place to (mis)manage Canadian forests.

Americans often picture Canada as a vast northern forest — an endless expanse of pristine wilderness. But the truth is far more complex and increasingly relevant to U.S.–Canada policy debates. Eighty‑nine percent of Canada is Crown land, owned by federal or provincial governments. Yet only about 10–12% of that land receives detailed ecological monitoring.  This matters because U.S. trade policy, Canadian conservation policy, and federal herbicide permitting are now combining to reshape North America’s forests in ways few Americans recognize.

Over the past 20 years, Canada’s sawmill and pulp‑and‑paper sectors have entered a steep decline. Statistics Canada and industry reports show that mill closures have accelerated, especially in western Canada, where over 30% of softwood lumber capacity has disappeared. Employment has dropped sharply. Entire forestry towns have hollowed out.

And while multiple factors contribute — mountain pine beetle damage, wildfire losses, transportation bottlenecks — the most overlooked driver is the federal government’s long‑standing approval of spraying Roundup (glyphosate) herbicide across millions of hectares of Crown forests. For decades, glyphosate has been used to kill broadleaf species — birch, aspen, poplar — so that commercially valuable conifers can dominate.

But this practice has consequences. Roundup creates monoculture conifer stands, which are more resin‑rich and significantly more flammable than mixed‑species forests. Instead of diverse, moisture‑retaining ecosystems, Canada is producing vast tracts of single‑age, single‑species pine and spruce — exactly the kind of forests that burn explosively under extreme fire weather.

The result is a continental paradox: Policies meant to “manage” forests
have instead created more combustible landscapes,
contributing to the anomalous rise in total annual area burned.

The deterioration of Canada’s forests is also being accelerated by domestic policy. Rising carbon taxes on diesel and gasoline — critical fuels for logging, hauling, and mill operations — have increased costs across the supply chain. New layers of regulation slow approvals and reduce harvest flexibility. And when pulp mills close, sawmills lose buyers for residual chips and sawdust, further undermining their economics.

But the most consequential impact of this industrial contraction is ecological. Canada’s parklands — where monitoring exists — show a clear trend of rapidly aging boreal forests, with large stands now reaching 70 to 120 years old.

In Alberta’s eastern foothills, provincial parks contain dense, overmature, fuel‑loaded forests primed for high‑intensity wildfire. Decades of fire suppression, beetle kill, drought, and heavy recreational pressure have created extreme fire risk. As Parks Canada itself warns, “the reduction or exclusion of fire as a natural process … leads to increased risk of wildfires.”

The consequences are here. Alberta’s Jasper National Park recently nearly burned to the ground when extreme fire weather collided with decades of fuel accumulation, beetle‑killed forests, a highly vulnerable townsite, and infrastructure failures.

Nonetheless, long‑term fire data tell a more nuanced story.  According to Canada’s National Burned Area Composite and Canadian Interagency Forest Fire Centre wildfire statistics, forest‑fire frequency has declined since the 1980s. Canada is experiencing fewer fires overall.

What has changed is the total area burned, which had remained relatively moderate for decades but then spiked dramatically in 2023 and again in 2025, producing two of the worst years for fires in modern Canadian history.  These spikes reflect the dangerous combination of aging forests, heavy fuel loads, glyphosate‑driven monoculture, and extreme fire weather — not an increase in ignition frequency.

Meanwhile, federal biodiversity reports show that parks are not experiencing net improvement. Most ecosystems are stable, but among those changing, declines outnumber gains. And crucially, non‑park Crown lands are not monitored at all, meaning there is no empirical basis to claim that conservation designations improve biodiversity.

Yet Ottawa is moving ahead with its flagship 30×30 agenda — a plan
to place 30% of Canada’s land and water under conservation status by 2030.

In practice, this means restricting forestry across vast areas as forests age, become fuel‑loaded, and become increasingly prone to extreme fire behavior. By limiting private‑sector utilization, 30×30 will increase fuel loading, exacerbate forest aging, and reduce thinning and harvesting activities that mitigate catastrophic wildfire risk.

For Americans concerned about lumber prices or wildfire smoke drifting south, the lesson is simple. Canada’s forests are increasingly unmanaged, aging, and burning, not because Canadians don’t care, but because the economic and policy frameworks governing those forests are pushing the country toward less active management.

North America needs forestry — not just parks — to remain resilient.

Joseph Fournier, Ph.D., has worked in the energy industry and environmental sciences and is a member of the CO2 Coalition, Fairfax, Virginia. He writes from his family’s ranch east of Calgary.

See Also:

Canada Wildfires: Manage Forests or Lose Them


2026 July Arctic Ice Extents Return to Mean

Russian Nuclear Icebreakers on the Northern Sea Route, March 2025

The arctic ice extents are now reported through July 2026, and as noted previously the wavy polar vortex has hampered ice formation with incursions of warmer southern air into the Arctic circle.  This factor receded in May and June, with extents closing the gap with the averages. The Northern Sea Route (NSR) goes through the Russian shelf seas of Laptev, East Siberian, and Chukchi seas on the way to Bering Strait in Beaufort Sea.

As the image from July 31 shows, the Arctic Ocean core is still solid, while parts of the Eurasian NSR have open water on the left vertical side. Ice persists in Laptev (top left) and Chukchi (bottom Left).  As usual in July, Hudson Bay (bottom right) is full open water, as is Baffin Bay (middle right).  Canadian Archipelago retains considerable ice cover.

The chart below shows the 20-year July averages for Arctic ice extents, along with 2026, 2025 and 2007 as well as SII v.4. Note that on average during this period 2.7M km2 of ice extent is lost. MASIE tracked average throughout, slipping below mid month, before ending July with a slight surplus.  SII v.4 continues to underestimate Arctic ice extent, ending July 0.4M km2 in deficit to MASIE, and down 338k km2 for the July month average.

The table below shows the distibution of ice extents on day 212 across regions of the Arctic ocean.

Region 2026212 Day 212 AVe 2026-Ave. 2007212 2026-2007
 (0) Northern_Hemisphere 6931831 6921789 10042 6344860 586971
 (1) Beaufort_Sea 996685 800758 195927 760576 236109
 (2) Chukchi_Sea 749028 558330 190698 382350 366678
 (3) East_Siberian_Sea 668170 748092 -79922 445385 222785
 (4) Laptev_Sea 508311 368784 139527 314382 193929
 (5) Kara_Sea 113891 160107 -46216 239232 -125340
 (6) Barents_Sea 36 28134 -28098 23703 -23667
 (7) Greenland_Sea 131468 293251 -161783 324737 -193270
 (8) Baffin_Bay_Gulf_of_St._Lawrence 107049 149072 -42023 94179 12870
 (9) Canadian_Archipelago 561573 543590 17983 510063 51510
 (10) Hudson_Bay 114812 136490 -21678 93655 21158
 (11) Central_Arctic 2978659 3133437 -154778 3154837 -176178

The table shows that many regions are close to or above the 20-year average. The Eurasian shelf seas of Laptev, Chukchi and Beaufort are in surplus. The only sizeable deficits are Greenland Sea and Central Arctic. Bering and Okhotsk seas are left off the list since they are open water now as usual.


Illustration by Eleanor Lutz shows Earth’s seasonal climate changes. If played in full screen, the four corners present views from top, bottom and sides. It is a visual representation of scientific datasets measuring ice and snow extents.


Decoding the Flailing Climate Alarm Story

There have been various reports, including some reposted here, about the Climate Crisis narrative losing its grip on the public and leaders.  Signs the fad is waning include some advocates like Bill Gates recanting, ESG financiers like Larry Fink backtracking, falling media coverage and closure of some climate units, and the recent admission of implausible climate model scenarios.

Even so, there are still many in its thrall, and it’s important to understand how climate doomster culture took over and continues to demand attention and deference.  Garry Rogers provides a brief and insightful analysis of how this happened, and why its influence is rightfully dwindling.  His blog article is Why So Many People Fall For The Climate Crisis Narrative. Excerpts in italics with my bolds and some added images.

You’ve seen them. Earnest young activists shouting at clouds, gluing themselves to museum walls, and blocking traffic with coroplast signs warning that the world will end in twelve years unless we obey their vision of salvation—complete with windmills, solar panels, and vegan diets. They’re the same people Xing and Instagramming about carbon footprints from their iPhones made in Chinese factories run on sulphur and lignite coal-fired electricity.

It’s easy to dismiss them as naive or misguided, but the uncomfortable truth is this: many of these people are neither stupid nor insane. They are simply caught in a powerful psychological, cultural, and financial machine that has turned “climate change” into a form of religious belief—a doctrine too sacred to question and too profitable to abandon.

Let’s set something straight. I’m not a climate change denier. Climate change is real. The Earth’s climate has always changed. And it always will—human-contributed through emitted greenhouse gas or not.

But the apocalyptic narrative that dominates headlines, policy, and corporate strategy today isn’t just about facts. It’s about framing—about controlling how people think, feel, and act in relation to a deeply complex system they barely understand. And that makes the climate crisis one of the most successful psychological operations in modern history.

In this post, we’ll take a hard look at why so many people have bought in—blindly and without skepticism—to the idea that we’re on the brink of planetary collapse, and that the only solution is top-down control, mass compliance, and the destruction of energy systems that built the modern world.

Some of what I’m going to say may be uncomfortable to some, and I know some
will unsubscribe. But that doesn’t make it untrue, and this needs to be said.

The Climate Crisis as a Religion (aka The Church of Carbon)

First, let’s call it what it is. For a growing number of people—especially in the West (Europe particularly included)—the climate crisis has become a belief system. It functions just like a fundamentalist religion, complete with original sin (industrialization), prophets (Greta, Gore, Gates), sacred texts (IPCC reports), rituals (recycling, carbon offsets), heretics (climate skeptics), and a promised apocalypse for those who fail to convert.
It’s not about science anymore. It’s about meaning.  People—especially young people raised in secular cultures—are starving for purpose. They want to feel morally righteous, socially important, and part of a grand, redemptive story. The climate narrative offers all of that in a tidy, emotionally satisfying package. It turns ordinary people into saviors. It makes them matter.  You can’t underestimate how powerful that is.

Fear is the Fuel

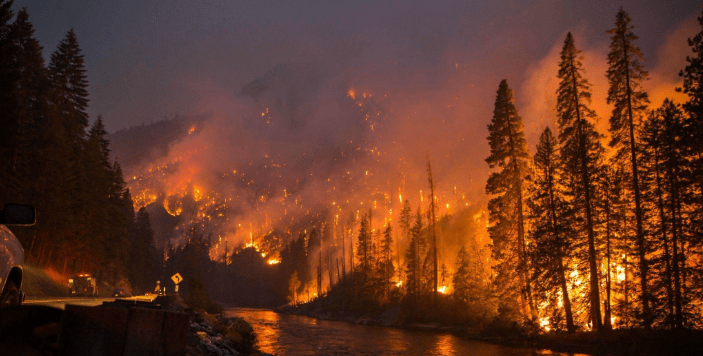
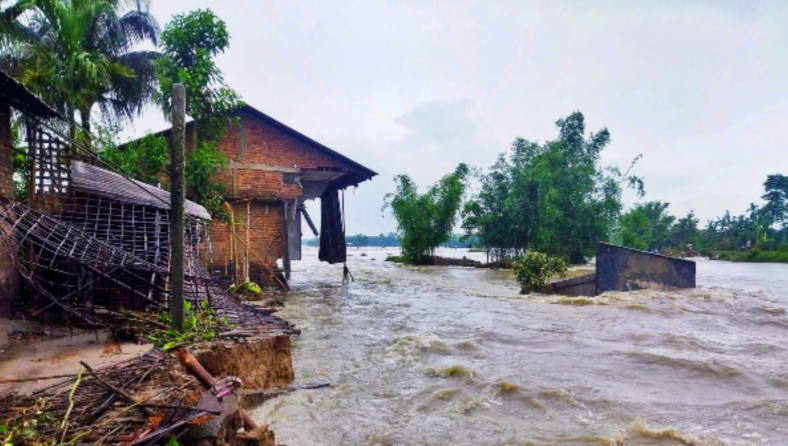
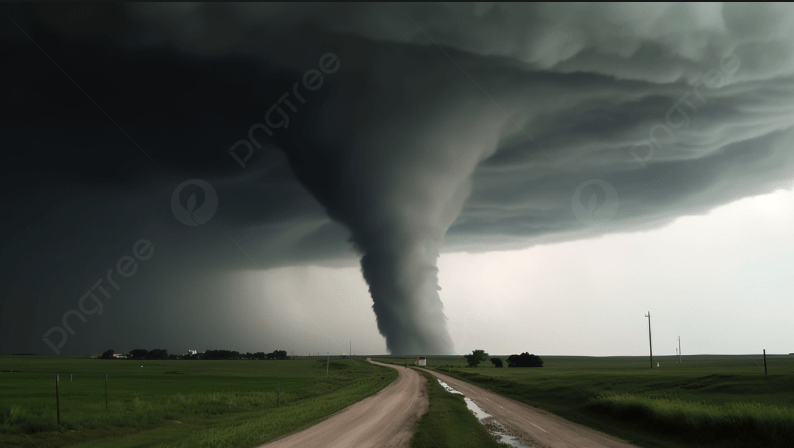
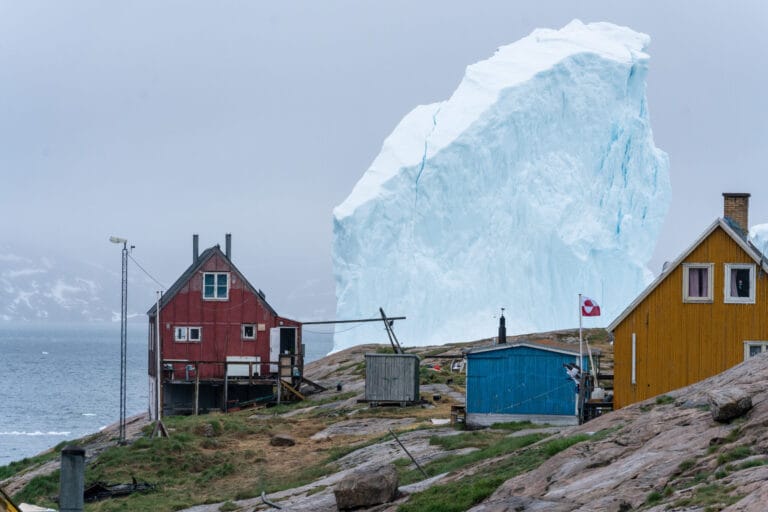
The second driver is fear. For decades, we’ve been bombarded with doom-laden, global-warming headlines: ice caps melting, oceans rising, hurricanes and tornados worsening, apocalyptical flooding, forests burning, deserts parching… The messaging is relentless—and expertly crafted to trigger our limbic systems. When people are afraid, they don’t reason. They react.

This isn’t new. Back in the 1970s, experts warned of an imminent ice age. Then came acid rain. Then ozone depletion. Each time, the world was supposed to end unless we handed over more power to government, more money to NGOs, and more control to unelected technocrats.

It’s always the same pattern:

  1. Declare a crisis.
  2. Blame human behavior.
  3. Offer a sweeping solution that just happens to consolidate control.

The only difference now is scale. The climate crisis is global,
not regional. And the proposed solutions are systemic, not marginal.

 The Collapse of Critical Thinking

But fear alone doesn’t explain the blind belief. There’s another piece of the puzzle: the steady erosion of critical thinking. Schools no longer teach logic, debate, or how to evaluate competing hypotheses. Instead, they promote conformity, activism, and groupthink. You don’t learn how to think. You learn what to think.

By the time students hit university, the programming is complete. Professors reinforce the dogma. Campus culture punishes dissent. Climate change isn’t a topic for exploration—it’s a moral litmus test. Students who question it risk grades, reputation, or worse. Being cancelled.

So, they comply. They absorb. They repeat. And when they graduate into journalism, academia, NGOs, or politics, they carry that unexamined belief system with them—passing it on like gospel.

The Media Echo Chamber

The next layer is media. Legacy outlets like CNN, BBC, CBC, and the New York Times frame climate change in religious terms: “Climate emergency,” “existential threat,” “code red for humanity.” Any nuance is treated as heresy. Any questioning is framed as denialism.

Science itself has been rebranded. Instead of a method of inquiry, it’s now a set of conclusions—conveniently aligned with elite interests. The phrase “The science is settled” is a dead giveaway. No real scientist would ever say that.

Meanwhile, dissenting voices—many with serious credentials—are marginalized, shadowbanned, or censored outright. Their data doesn’t fit the narrative. Their views make people uncomfortable. So, they are erased.

And most people? They never notice.They assume if something was true, they’d hear about it. But when every channel is playing the same tune, they don’t realize they’re listening to a carefully curated soundtrack.

Social Conformity and Virtue Signaling 

But here’s the deeper truth.  Most people don’t believe the climate crisis because they’ve studied the data. They believe it because everyone else does. That’s the power of social conformity. Nobody wants to be the outlier—the one who raises their hand and asks the uncomfortable question.  Especially in a culture obsessed with virtue.  Believing in the climate crisis is a modern form of moral signaling. You drive a Tesla. You compost. You use a keep-cup. You care. You’re not like those backward Boomer-deniers who love oil and hate penguins.

  • You’re evolved
  • You’re ethical
  • You’re better

That’s what this has become—not a conversation about climate,
but a competition for social status.

And once belief becomes part of your identity, it becomes non-negotiable. Any challenge feels like a personal attack. Facts don’t matter. Feelings do.

Follow the Money

Now let’s talk about power.

The climate industry is worth trillions—yes, trillions of dollars. It’s the perfect grift: a never-ending crisis that justifies endless funding, regulation, and surveillance.

  • Governments rake in carbon taxes.
  • Universities secure research grants.
  • Corporations get ESG ratings and subsidies.
  • NGOs fundraise on fear.

It’s an entire ecosystem of incentives, none of which reward skepticism or moderation. And when that much money is on the table, the truth becomes secondary to the narrative.

Even energy companies play along. They don’t want to be regulated out of existence, so they slap green labels on their products and talk about “net zero” while quietly hedging their bets. It’s theater. Everyone’s pretending.   But the costs are real.

China’s Role in the Global Equation

While the West ties itself in knots trying to decarbonize, one country is playing a different game entirely: China

Beijing talks green, but burns black. Coal remains its dominant energy source, powering steel, manufacturing, and military growth at a staggering scale. As of 2024, China alone consumes over half the world’s coal supply—and shows no sign of slowing down.

They’re not stupid. While we argue over wind farms and carbon credits,
they build aircraft carriers, drones, and power grids.
While we teach kids to fear climate collapse,
they teach theirs to master engineering and geopolitics.

They make the solar panels we install. They mine the rare earths we need. They profit from the very policies we impose on ourselves.  And we call that progress.

Weaponized Guilt

So why don’t people wake up?

Because they’ve been trained to feel guilty. Every gas-guzzling SUV trip, every propane-grilled burger, every jet-fueled flight—is framed as a moral failing. You’re killing the planet. You’re harming future generations. You’re part of the problem. It’s exhausting, and it’s effective.

People internalize this guilt. They try to cleanse themselves through ritualistic consumption: reusable straws, oat milk, biodegradable trash bags, canvas totes at the farmer’s market. None of it makes an infatismal sub-fraction of a surface dent in global emissions—but it feels redemptive.

That’s the point. It’s not about fixing the planet. It’s about managing the soul.

The Useful Idiots

Now we come to the crux.

The term “useful idiot” originated in Soviet times. It referred to Western sympathizers who unknowingly supported the goals of a regime they didn’t understand. They weren’t evil—just naive, manipulated, and eager to be on the “right side of history.”

That’s where we are today. Millions of well-meaning people have been seduced by a narrative that exploits their fears, flatters their vanity, and blinds them to the larger game at play. They march, post, and protest—believing they’re saving the world, while unwittingly aiding those who want to dominate it.

They’re not villains. They’re pawns. And when you try to wake-the-wokes, they look at you like you’re the crazy one. Then they viscerally turn on you.

What’s At Stake

Here’s what’s really at stake. If we continue down this path, we don’t just risk economic collapse or energy poverty. We risk civilizational suicide. We are dismantling the very systems—energy, industry, sovereignty—that made the modern world possible.

And we’re doing it not for the planet, but for appearances.

Meanwhile, the nations that reject this ideology are gaining power, leverage, and independence. They’re not afraid to use fossil fuels while experimenting with futuristics. They’re not ashamed of their ambitions. And they’re not held hostage by narratives designed to make them feel guilty for existing.

They’re playing to win. We’re playing to look virtuous. That’s a losing hand.

So, what do we do?

First, stop apologizing. There is no shame in using energy. Civilization runs on it. Human flourishing depends on energy, regardless of how it’s generated. Without it, we return to darkness—literally and figuratively.

Second, think for yourself. Ask questions. Follow incentives. Trace the money.
Be skeptical of anything presented as a one-sided moral truth.

Third, reclaim courage. Don’t be afraid to speak the truth, even when it’s unpopular. Especially when it’s unpopular. History doesn’t remember those who went along to get along. It remembers those who stood up, pointed at the naked emperor, and said, “This is madness.”

And finally, understand this: We are not in a climate crisis. We are in a clarity crisis. Clarity—real, hard-won, human clarity—is the first step back to sanity.

The next time someone tells you the world is ending, ask who’s funding the message—and what they’re selling with it. Because if you look closely, you’ll find it’s not about saving the planet. It’s about controlling the people on the planet by getting them to fall for the climate crisis narrative.

Background Resources

Why Climate Alarm is Fading (Matt Ridley)

No, WSJ: 9 Reasons Why “Green Energy” Makes Even LESS Sense Today

Charles MacKay: “Men, it has been well said, think in herds; it will be seen that they go mad in herds, while they only recover their senses slowly, and one by one.”