The response to Canadian Prime Minister Mark Carney’s address at the European Parliament in Strasbourg on September 17, a day after European Commission President Ursula von der Leyen opened the door to Canada becoming the EU’s first “associate member”, has reflected and aggravated the public policy and psychology gap between Western Europe and the United States. The federal European institutions began as an admirable attempt by Jean Monnet and others to bury once and for all the profound and sanguinary hostility between the principal European states. These were tariff reductions in the facilitation of cooperation at the economic level, especially between France, Germany and Italy. The original six-nation group, including Benelux, gradually intensified cooperation to a political union and expanded steadily to 28 states, from which the United Kingdom has withdrawn.
It was far from a smooth and constant progress. Several countries required consecutive referendato accede to the goal that was defined as “an ever closer union”, which clearly indicated ultimately a single senior government for all of Western and much of Central Europe. Britain had only voted for a common market and never to have the political institutions that it had developed fairly consistently for nearly 800 years subsumed into the well-intentioned but comparatively untried government machinery of Europe in Brussels. And when finally consulted, the British voted “no”. This was the first major post-Cold War geopolitical abrasion between Europe and America. President Trump offered the British a fast-track into the North American free-trade area, but Theresa May chose to define leaving Europe as in fact confirming its adhesion to it. Boris Johnson was more receptive but too disorganised and preoccupied with resolving the status of Northern Ireland in Europe to address Trump’s invitation, and soon found himself dealing with the irresolute Biden administration.
Trump, like previous Republican presidents Richard Nixon and Ronald Reagan, saw that a federal Europe was in some measure a revolt against the primacy of the United States in the West, based on the romantic delusion that the European powers, having squandered their world leadership in the world wars and totalitarian movements that Europe inflicted upon the world, could now stand on each other’s shoulders and regain the headship of the planet.American Democratic presidents have tended to view Europe more positively as potentially a welcome equal partner in Western leadership.
Carney has moved Canada past Britain as another important country
purporting to straddle between Europe and the United States.
When he was the governor of the Bank of England, he made short work of any notion of an independent central bank by joining the fear-mongering campaign of the British government to the effect that if Britain seceded from the European Union, grass would grow in the streets of the City of London. Having returned to his native Canada and become prime minister, he won an upset re-election victory for the Liberal Party which under Justin Trudeau had scandalously misgoverned the country as it tumbled down the comparative tables of the world’s most prosperous states, hobbled by an obsession with climate change and generating discontent through excessive but almost entirely legal immigration. (This is a relatively simple matter for Canada since its only substantial land border is with the United States, a country that almost nobody ever flees away from, and illegal entry by sea requires crossing a great ocean.)
The usual anti-American or naïvely globalist organs of the European and British media, such as The Guardian and The Economist, have grappled Carney to their bosoms as someone who validates the beleaguered European project. The United States economy has been growing more than twice as fast as the European Union’s for 20 years, and where Trump has been somewhat bumptious, he has been effective in reducing absurd trade deficits and warning inconstant allies. The principal European powers have floundered and only Italy can now be said to have a serious government. Germany, France and Spain, as well as the United Kingdom, are waiting for firm government from the civilised Right as Prime Minister Giorgia Meloni is asserting in Rome.
In Strasbourg, Carney revealed more vividly than he has to
his own countrymen his authoritarian, Davosian leftist biases.
He flattered his audience by rewriting modern history and current economic statistics. Freedom was won in Europe “thanks to the heroism of the European resistance during the war”. Of course, this is rubbish: Europe was liberated by the Americans and British and Canadiansand protected by the United States until the Soviet Union, under the American containment strategy, disintegrated. Europe is wallowing economically and its enfeebled response to the Chinese penetration of more than a third of its hybrid car market is to ask, unsuccessfully, for China voluntarily to restrain its presence to 15 per cent. Anyone, including apparently the majority of the citizens of the major European countries, can see that a sharp policy change is called for, and the insane climate change bugbear is being put to death at last.
Carney did not mention in Strasbourg that Canadian exports to the United States are 10 times as much as its exports to Europe, or that the United States represents more than a third of the entire economy of Canada while Canadian trade represents about 2% of the US economy. In Strasbourg, both speaker and audience were dreaming and to this end Carney quoted Goethe misleadingly and inflicted a number of hollow bucolic metaphors on his listeners topromote the notion of a reciprocal magnetic interest between Canada and Europe. It is a complete fantasy and it will not last long.
Addendum: Commentary from Europe
Also at Brussels Signal, Karl Pfefferkorn writes: An empire built on sand. Excerpts in italics with my bolds.
After the billing and cooing is over, what does the new partnership between Carney and von der Leyen have to offer their respective citizens? The official announcement suggested greater cooperation in defence, artificial intelligence and the provision of energy. Canada, which once earned its own invasion beach at Normandy, has only the ghost of a military these days and can contribute little to Europe’s efforts to deter Russia. In any case, Canada and the major European powers are guided by NATO’s defence planning, and not any EU attempts to supplant it. Carney clearly hopes to claim a share of Europe’s defence spending bonanza as a preferred partner, but has far less expertise and capacity to offer than the UK, which despite these attributes has yet to earn equal access to the EU’s common defence funds.
Neither Canada nor the EU has sired artificial intelligence companies capable of challenging China or the United States. Cooperation between also-rans is not likely to benefit either. Given their governing tendencies, they are far more likely to cooperate in suffocating their nascent AI industries through overregulation.
Canada does have immense energy resources, but lacks the infrastructure to supply much of it to Europe. Canadian pipelines run west to the Pacific in the service of Asian markets, or east to Ontario, by way of the United States. Any help solving Europe’s energy problems will require the construction of oil and gas loading facilities on Canada’s Atlantic coast, in violation of the environmental orthodoxies espoused by Carney’s Liberal Party. Canada’s oil resources are concentrated in the Alberta oil sands, which are the dirtiest and most carbon intensive of fossil fuels. Large-scale imports of Canadian oil will require a significant relaxation if not the outright abandonment of the EU Carbon Border Adjustment Mechanism.
Carney is reluctant to reveal his country’s most attractive
quality to the EU: a potential net payer into EU coffers.
If Canada can be lured into a bespoke arrangement, complete with new sinecures in Brussels for civil servants desperate to escape Ottawa, she will pay at least as much as Norway, which remits over half a billion dollars a year for its EEA status. Good for EU finances, but what will Canada get in exchange? Relaxed work rules and membership in the Erasmus study programme will benefit young Canadians, but visa reciprocity will also lure ambitious Europeans toward greater opportunities in North America. Industrial tariffs are already minimal under the CETA agreement, and there is no chance the EU will open the Single Market to increased Canadian agricultural imports.
None of this will offset the risks of alienating Canada’s biggest market, the United States. The prosperity of 40 million Canadians is dependent on the trade surplus they run with 340 million American consumers. Canadian industry is comprehensively integrated into the American market in everything from car parts to advertising. The EU cannot offer anything close to a replacement should the US retaliate against any Canadian deal with Europe.
Carney walked away from a good trade offer from Washington in a fit of performative hubris, preferring to risk the economic well-being of his people for the accolades of his European peers.
Given her fraught relations with the White House, Ursula von der Leyen sees little downside in her flirtation with Carney. She is empire-building, not in the old way of territorial conquest, but in the post-modern sense of attaining greater elite regard. The average Commission bureaucrat hopes to make the EU into a workable federal state, but von der Leyen sees it as a citadel of self-regarding virtue for affluent Western elites besieged by angry populists. Granting titles of privilege to loyal servants like Carney elevates her office to the status of a royal court in the realm of the global elect, an objective far more important than the tawdry material needs of factory workers in Duisburg or coal miners in Silesia.
Her neglect of the sources of Europe’s prosperity and her failure
to mobilise the resources of the Commission in their service
will expose her true achievement: an empire built on sand.
Jamie Sarkonak catalogs the Canadian experience in his National Post article with the subtitle: Regina is just the latest city to report problems with unreliable battery-powered transit. Excerpts in italics with my bolds.
The news slipped out during Regina city council’s Monday budget hearing, when transit union president Sukhwinder Singh was asked whether electric buses have impacted costs.
Aside from being more expensive to run — defeating their original purpose of saving on gas money — Singh said they were “not for the Saskatchewan weather.” He added that four buses had to be pulled off the line and re-charged the previous Friday, as they had fallen to 15 per cent battery. “I’m not in favour of electric buses at all,” he said.
“For the winter, their battery dies very quickly, and they can just run for two, three hours, that’s all. The buses weren’t good for the summer either, because the charge couldn’t reliably last.”
And over in Saskatoon, city council has been trying to grow the electric fleet. It’s unclear why: city staff have warned that electric buses can’t last a full day of service on one charge, and that it takes 1.2 electric buses to replace a single diesel bus.
This was always a predictable outcome, particularly since Edmonton already wasted millions on the same kind of failed project. In 2018, back when climate was the issue du jour, the city came up with a plan to spend $43 million on electric buses.
Fast forward to today and Edmonton has 60 of these buses in its fleet of 1,000. In December 2023, it was reported that only one quarter of these were in working order due to a range of problems. The company that built them, Proterra, filed for bankruptcy. Edmonton joined in on the bankruptcy proceedings, claiming that it was owed $82 million for the bus fiasco. Edmonton lawyers claimed:
“None of the buses have ever achieved 328 km on a single charge,” and “On average, the bus range has been approximately 165 km in the winter and, at best, 250 km in warmer weather.”
These same lessons are learned again and again. In 2022, the feds and the government of Manitoba helped Winnipeg purchase 40 electric buses, which the city claimed would drive for “10 to 15 hours.” Earlier trials in Winnipeg showed that heating the cabin resulted in “performance losses”; adding a diesel heater limited those losses to 20 per cent or less. In extreme cold, electric bus batteries lost as much as 25% of their capacity, and snow increased energy usage by an additional 15%. The city’s first electric buses began operating over the summer; it remains to be reported how their first winter is going.
Finally, Toronto, which also started its electric bus journey in 2017, is also reporting failure. A city report from July buries the unflattering figures under a deluge of emissions-reduction statistics: from the beginning, these buses had shorter ranges than diesel units, which renders them unusable for many existing bus routes. And because of their finicky charging requirements and limited range, the electric buses “face challenges in responding to emergency subway closures, route diversions, and other unexpected events.”
The Magic School Bus
In 2021, Quebec mandated that all new school buses purchased in the province be electric as part of a goal to electrify 65 per cent of its bus fleet by 2030.
in September 2025,1,200 Lion electric school buses were abruptly withdrawn from Quebec roads, prompting renewed criticism of the provincial government’s approach to electrification — and of its decision to give one local company a virtual monopoly. Many school bus routes in Quebec remained cancelled following the government’s decision to pull all Lion buses out of service after a bus in Montreal caught fire last week. Lion has sent instructions to school bus operators for the required inspections and repairs, apparently related to possible wiring issues. Three Lion buses have caught fire in the last year, though nobody has been injured and the buses’ batteries were not involved.
Andrew Jones, a Montreal-area school bus operator, said he has since cancelled orders for 20 new Lion buses, and has ordered diesel buses instead. He said:
“The eight Lion buses I already own are unreliable, in part because when they break down, it can take weeks to get the necessary parts or technicians from Lion.” “We’re subject to waiting on them 100 per cent of the time.”
FoxBusiness reports: Cities coast-to-coast grappling with broken-down e-buses that cannot be fixed
Between the federal government, states and municipalities, untold billions in taxpayer dollars have been spent adding electric buses to transit fleets across the U.S. in an effort to reduce carbon emissions.
Officials in Asheville, North Carolina, recently expressed frustration that three of the five e-buses the city purchased for millions in 2018 are now sitting idle due to a combination of software issues, mechanical problems and an inability to obtain replacement parts.
Earlier this month, The Denver Gazette reported two of the four e-buses Colorado Springs’ Mountain Metropolitan Transit acquired in 2021 are not running. They cost $1.2 million a piece, mostly paid for by government grants.
In 2020, The Philadelphia Tribune reported SEPTA’s entire $24 million fleet of Proterras had been pulled out of commission. A spokesperson for the transit agency would not get into the specifics of why the 25 buses – the third-largest fleet of all-electric buses in the U.S. at the time – were put on ice, but suggested the issues might be covered under the manufacturer’s warranty.
Attorneys representing Broward County, Florida, regarding Proterra’s bankruptcy, told the court Broward County purchased 42 buses from Proterra for $54 million, and the first batch only operated for an average of 600 miles before breaking down, while the second batch averaged 1,800. For comparison, the county’s diesel busesaverage 4,500 between failures, the filing said.
The MTA will buy 85 fewer electric buses as its manufacturer tries
to sort out a way to keep them in service without breaking down.
MTA officials briefed the board in June on the problems plaguing the five-dozen electric buses the authority currently has in service, which cover only about 2,500 miles on the road before a mechanical breakdown takes them out of service, compared to 8,500 miles for diesel buses.
Officials have previously sounded the alarm in 2025 that the batteries that power the buses overheat or fail hold a full day’s charge, and that electric components that power systems like the air brakes were failing while buses were in service.
Linda Poon provides a global picture in her Pacific Standard article, with this summary:
What prevents cities from adopting electric buses en masse is a mix of
technological, financial, and institutional challenges, according to
reports looking at efforts in 16 cities at various stages of adoption.
With the goal of curbing carbon emissions in mind, municipal leaders all over have pledged to partially, if not fully, replace their city’s fleet with e-buses over the next decades. A number of cities, from large metropolises like Mexico City to more modest ones like Philadelphia, have started pilot tests. One report from World Resource Institute focuses on three major types of barriers.
The cities studied range from Addis Ababa in Ethiopia—where there’s been “no substantial planning” around electric buses—to cities like Philadelphia and Campinas, Brazil, which, respectively, are running a pilot test and expanding its number of e-buses, to successful cases in Shenzhen and the nearby Zhengzhou. They vary geographically, with some in developed nations like Chile and Spain, and other in emerging countries like India.
It means that when cities consider adopting electric buses, they need to understand the power grid upgrades and charging infrastructure required, and challenges associated with that. Failure to do so is the most common mistake, according to Gorguinpour. Many cities just set up their charging stations thinking that things would “work themselves out.”
That’s why he says one of the most overlooked stories from Shenzhen’s experience is the city’s long process in setting up the charging infrastructure to support more than 16,000 electric buses. Each bus has a range of about 124 miles on a single charge of 252 kilowatt hours (KWh). In total, the fleet can eat more than 4,000 megawatt-hours (MWh). For comparison’s sake, 1 MWh is enough to power about 300 homes for an hour. “That’s an insane amount of power required, not to mention real estate,” he says. “And the process to identify what land is available, then to work with the utilities—even just figuring out the optimal location—is a hugely important task, and incredibly challenging.”
That gets into the financial barriers. Cities across the globe often cited higher expenses as the primary challenge to procuring a fleet. While cities that adopt e-buses do end up saving money over the longer term in things like fuel (not to mention the harder-to-quantify value of cleaner air and fewer greenhouse emission), the upfront costs represent significant challenges. In the case studies, the price of a new e-bus ranged between $300,000 and $900,000 per bus, with the report noting that the prices vary dramatically depending on the manufacturer, specifications, and the location of the transit agency. In the United States, an electric bus averages around $750,000, while a conventional diesel bus is around $435,000.
When cities decide to implement electric buses, Gorguinpour says the cities focus too much on those upfront costs and not enough on the “life cycle cost.” Or, in the case of Belo Horizonte in Brazil, to get operators on board with full adoption. In some cases—as in Chile’s capital city of Santiago, which has the largest e-bus fleet outside of China—it’s utility companies, not transit agencies, that have stepped up to finance the projects.
Dr Roger Watson reports on how Roman Catholic leaders have ventured into climatism wilderness by trusting the wrong proponents. His Daily Sceptic article is The Vatican’s Green Gospel. Excerpts in italics with my bold and added images.
Under Pope Francis and now Leo the Catholic Church has drunk deeply
of the climate Kool-Aid. It’s about time it quit the pseudo-scientific
scaremongering and got back to saving souls.
How the Roman Catholic Church moved from its great commission to save souls to its current obsession with saving the planet is not clear. But it is obvious that the hierarchy of the Church has drunk deeply of the climate change Kool-Aid and, and while it would be unfair to say that it has abandoned saving souls, its mission has certainly drifted considerably into an area which is not exactly within its area of expertise. Wherever it is getting its advice on climate change from, it is most definitely listening to the wrong people.
The problem, as some Catholics see it, is demonstrated amply in a column in the September issue of Middlesbrough Diocesan Catholic Voice – known locally as the Voice – which is distributed to and through parish churches in the Middlesbrough Catholic Diocese. It is always with trepidation that I take a copy from the pile at the back after Sunday Mass.
The Voice, while it contains useful diocesan information, dates of events and news from the parishes, almost always has at least one article which, for me, is an ‘occasion of sin’ as to read it conjures up thoughts which are far from Christian. My only justification being that this is engendered by reading content that is far from Christian. Inevitably, if we do not have a report on the oxymoronic concept of the Diocesan LGBT Masses it will be an article on the so-called climate emergency.
Blessed are the carbon conscious
The September issue of Middlesbrough Diocesan Catholic Voice contains an article by Sir John Battle, former Labour MP for Leeds West and a minister in the Blair government titled ‘Stop taking a climate change gamble’. A Roman Catholic and made a Knight Commander of the Order of St Gregory by Pope Benedict XVI – who clearly didn’t get everything right – Sir John hinges his argument on the gambling industry and the obvious love of gambling among the British people.
The first quarter of the article, on the popularity of gambling and its possibility of easy returns for one’s money, is rather tenuously linked to the gamble that we are taking over climate change. This expectation of quick profit is blotting out people’s minds to the realities of what we can do to mitigate the damage of global warming.
The customary superlatives are used to support his argument. Thus “wildfires rage” across Europe and “devastating floods” hit Bangladesh. Never mind that the fires in Europe were almost certainly deliberately causedby arsonists and that there have been floods in Bangladesh for as long as anyone can remember. Add to that the news that, far from melting, the polar caps are increasing in size, the polar bears and penguins are thriving and coral reefs are growing. The facts must not stand in the way of a good argument.
After all, there is a “scientific consensus” on the issue and
“daily news reports of worldwide extreme climatic events”. So, it must be true.
Sins of emission
Sir John explains that the much bandied Net Zero mantra“does not mean producing zero emissions but rather taking action to reduce emissions as much as possible”. If so, then why call it ‘Net Zero’ and why does the UK have a target of Net Zero by 2050? According to the University of Oxford’s Net Zero Centre, Net Zero means “balancing the greenhouse gases put into the air with an equal amount taken back out”. That is a subtlety I have never heard any of the zero carbon fanatics explain on BBC Radio 4 Today programme.
Sir John refers to the “merchants of doubt”, pointing the finger at Big Carbon (not Sir John’s description) who have “financial interests” in not reducing our use of hydrocarbon sources. This leads people to doubt anything untoward will happen to them because of climate change due to the gambling mentality referred to in the initial paragraphs of his article. These “powerful vested interests” – spoken like a true socialist Sir John – then try to shift the blame on to consumers and society. But the consumers in turn think ‘why bother?’ when places like China and America carry on emitting greenhouse gases like there is no tomorrow.
Having seemingly criticised Big Carbon and such vested interests in trying to offload their responsibilities for the planet onto the little people, Sir John then quotes arch climate catastrophist Gabriel Winslow-Yost, who reckons climate change to be a “crime” and that we are all “implicated”. Winslow-Yost, clearly a lover of dramatic prose, says, “car rides and plane trips, coffees and burgers, heating and cooling and clothing are paid for in blood, contributing every moment to the suffering and destruction global warming brings”. My goodness, but he sounds like he’d be a regular hoot on a night out, doesn’t he?
The catechism of climate change
As if to give his article some theological clout he quotes Pope Leo who “insists” that climate change is “a scientific reality and a moral responsibility”. I think you’ll find, Pope Leo, that you are wrong on both counts there. Laudato Si’, the late Pope Francis’s execrable encyclical letter, is quoted twice, including his ridiculous exhortation to “ecological conversion”. We Catholics had all hoped for better from Pope Leo, but he seems to have fallen for the climate change catastrophe agenda as much as anyone, referring to concepts such as “environmental justice” and how it is part of the Church’s mission to “promote human dignity, peace and care for creation”.
It is hard to know what lies behind all this nonsense being spouted by the hierarchy of the Catholic Church and by senior Catholics who should know better. Are they – as I fear they might be – genuine believers in the climate change catastrophe? Perhaps they are trying to be ‘relevant’ and ‘relatable’ by addressing topical concerns in a vain attempt to fill the pews. If so, why would that work? If people want to hear scientific social justice based gobbledygook, there is always the Anglican Church, the BBC or the Guardian.
The Catholic Church rightly encourages Christians to be good stewards of creation, but has that stewardship begun to eclipse salvation? Reducing carbon emissions seems to be a greater priority than reducing sin. The Church’s unique mission is to proclaim the Gospel, administer the sacraments and prepare souls for eternity. If it chooses to become just another voice in the chorus of climate activism, it should not be surprised if people conclude that it has become more interested in saving the planet than in saving the souls of the people who inhabit it.
File this under “They Have No Shame.” Desperate to regain momentum for Agenda 2030, activists’ new meme is that costs of living are rising because of global warming/climate change. It’s an obvious attempt to deflect from Greenflation due to the so-called “Energy Transition” and to blame realists who dissent from “consensus Climate Science.” Here’s the study from MIT disciples: Why climate change is costing U.S. households hundreds of dollars a year. Excerpts in italics with my bolds,
CAMBRIDGE, Mass., April 7, 2026 – As extreme weather becomes more frequent, climate-related costs are creeping into everyday expenses, adding hundreds of dollars a year to U.S. household expenses. From higher insurance premiums to rising utility bills and disaster-related income losses, climate change contributes to expenses at a time when Americans are already worried about rising food and energy costs. While their list of climate-related expenses is not exhaustive, the researchers found that climate change is already costing U.S. households between $400 and $900 a year, on average. In some places, the burden is far higher: in around 10% of U.S. counties, annual climate-related costs exceed $1,300 per household.
Coauthor Catherine Wolfram:
“A lot of the ways in which we discuss climate now are kind of abstract and in the future — maybe these impacts happen in 2050 or 2100 — but we really wanted to emphasize that this is already occurring and it’s having negative financial implications for households.”
Energy expenses are one important driver in household climate costs.
To estimate the growing household costs of energy from increased use, production disruption, and damage to electric companies’ infrastructure, the researchers compared energy use in 2020 to 2024 with that of 1981 to 1990. Recently, more utility companies have been increasing their rates in response to wildfires and hurricanes, either to fund recovery or to mitigate future damage.
Insurance costs represent another piece of households’ growing financial burden.
The researchers estimate climate change contributed to an average $360 increase in homeowners’ insurance premiums between 1990 and 2023. In some cases, households may be hit twice: by rising utility bills and higher insurance premiums at the same time.
Government climate-related costs are passed on to households
These typically include having to pay to repair schools, roads, bridges, and airports after natural disasters. They found that the annual average per household cost from these expenses from 2017 to 2021 was nearly $150. Other costs, including higher home prices in lower-risk areas and rising food prices from crops damaged during disasters, are likely contributing as well, but are outside the study. Migration costs could also play a role, as people move away from areas experiencing more frequent disasters.
Summary of Costs incurred by households due to climate change
Cost Factor Estimated
Annual Cost
Home insurance premiums
Over $600
Disaster recovery expenses
Varies by region
Increased utility bills
About $35
Health impacts from air quality
Exceeds $100
What They Are Not Telling You
Insurance Companies Making Record Profits Off Climate Change Panic
US property and casualty insurers nearly doubled their earnings between 2023 and last year despite costly extreme-weather events, according to research that highlights the pay-off from several years of rising customer prices.
A survey of companies that account for at least 97 per cent of US property and casualty cover by rating agency AM Best, found that the aggregate after-tax profits of the industry surged to $171bn last year, compared with $92bn the previous year.
Hurricanes, fires and other disasters caused an estimated $320bn of losses around the world in 2024, about a third more than the year before. In the US alone, five big hurricanes as well as other severe storms struck.
However, the data showed insurers more than offset larger losses by increasing premiums. Helen Andersen, an AM Best research analyst, told the Financial Times that the strong earnings figures were the result of “an aggressive push for significant rate and pricing increases” by insurers.
But some consumers — particularly in states historically less affected by wildfires and extreme weather such as hurricanes — have questioned the justification for price rises that have sometimes outstripped inflation.
Unreliable Wind and Solar Power Drives Higher Electricity Bills
EPA Reports US Air is Clean of Unhealthy Pollutants
The most powerful and enigmatic forces on our weather are the Pacific El Nino and La Nina phenomena which cause floods and droughts on opposite sides of the Pacific. Unfortunately, climate modelers can’t predict them much more than three to five months ahead, which tells us there’s some big driver they are missing. But a new paper from Chinese researchers suggests that a large blob of water in the North Eastern Pacific is responding to something in solar cycles.
This vast slab has the catchy name of The North Pacific eastern subtropical mode water (NPESTMW). It sits about 100m below the surface and grows and shrinks as the solar cycles rise and fall. It appears to be a very important blob. A different paper last year found that changes in the NPESTMW volume led the El Nino events by about 9 months.(Liu, 2025)
Remarkably, they found in the 1991–2022 record, seven of eight
large drops in this water volume were followed by El Niño,
while eight of nine large increases were followed by La Niña.
If they are right, it would confirm what skeptics have been saying for years — that climate modelers need to pay a lot more attention to solar cycles in their big models and that one day we might even learn to predict El Ninos (by crikey) a whole year ahead. Finally, the experts might be able to tell us if next summer really will be a barbecue summer, and the farmers might get a bit more warning on whether to plant seed early or sell off the cattle.
Awkwardly for 4,000 UN climate experts, the more solar factors we add to the climate models, the smaller the role is for CO2. (It’s even more awkward for nations that spent a trillion dollars on climate control before we understood the climate.)
The mechanism
The researchers suggest (see the top image) that it’s the solar UV which probably creates this effect on the oceans from the top down. High energy UV rays hit the oxygen molecules in the stratosphere and split them into ozone. Ozone then absorbs more UV and warms up that part of the atmosphere. This changes the jet streams and winds below. And winds close to the ocean can take energy or heat out of the water as it evaporates, but they also stir it up (or not). Peak solar activity seems to suppress the orderly settling of the NPESTMW blob. Once the blob forms and sinks to 100m to 300m down, surprisingly it is very stable and carries the temperature, salinity and other chemistry for a long time. This is what is called “the ocean memory” in the paper’s title.
To enlarge, open image in new tab.
After solar activity peaks, for the next year or two in every cycle, the formation of the NPESTMW block is suppressed. This may be due to cyclonic wind stress anomalies that drive upwelling. However, at the solar minima the winds change creating the opposite downwelling effect and the water flows into the blob.
Complicating everything, the Atlantic Multidecadal Oscillation (AMO) acts like a gate. During warm phases of the AMO, it amplifies the solar cycle effect on the NE Pacific, which is why after looking at eight decades of data, the effect has been strongest since 1990.
The Sun’s energy output follows an approximately 11-year cycle of stronger and weaker activity. Although this variation is small, it can nonetheless produce detectable effects on Earth’s climate. Here, we show that the solar-cycle consistently modulates the volume of a subsurface water mass in the North Pacific Ocean: the North Pacific Eastern Subtropical Mode Water, which forms at the ocean surface in winter and sinks, transferring heat and carbon to the deep ocean and influencing climate variability on timescales of years to decades. We find that during periods of high solar activity, anomalous cyclonic circulation over the formation region weakens surface winds and reduces ocean heat loss, suppressing winter mixed layer deepening and mode water formation, while the associated upwelling inhibits the sinking of this water mass; the opposite occurs during low solar activity. However, the strength of this solar influence is not constant over time: it is further amplified by a long-term natural climate fluctuation in the Atlantic Ocean, helping explain why the Sun’s imprint on climate has been particularly pronounced since the 1990s. These findings reveal a new mechanism through which the Sun may influence climate predictability via the ocean’s subsurface memory.
Figure 5
Schematic diagram illustrating the pathway from enhanced solar irradiance to reduced NPESTMW formation during solar-active periods. Enhanced solar forcing induces negative SLP anomalies over the North Pacific through “top-down” stratospheric-tropospheric coupling, producing anomalous cyclonic circulation and reduced air-sea heat loss. These atmospheric changes suppress winter mixed layer depth, preventing the water mass from penetrating enough to ventilate the thermocline and form mode water. Additionally, cyclonic wind-induced upwelling anomaly opposes downward subduction (shading schematic), further hindering NPESTMW formation and ventilation. Critically, this solar-driven pathway is strongly modulated by the AMO phase: during positive AMO phases, stronger atmosphere-ocean coupling and enhanced mixed layer sensitivity to atmospheric forcing amplify the solar-NPESTMW relationship, whereas during negative AMO phases, weaker coupling and sensitivity damp this signal, rendering the solar imprint less detectable.
Solar Cycle Progression September 15, 2026
Footnote: Oceans Oviously Drive Global Warming
Going back to previous warmings prior to the satellite record shows that the entire rise of 0.8C since 1947 is due to oceanic, not human activity.
The exhibit shows since 1947 GMT warmed by 0.8 C, from 13.9 to 14.7, as estimated by Hadcrut4. This resulted from three natural warming events involving ocean cycles. The recent rise 2013-16 lifted temperatures by 0.2C. Previously the 1997-98 El Nino produced a plateau increase of 0.4C. Before that, a rise from 1977-81 added 0.2C to start the warming since 1947.
Importantly, the theory of human-caused global warming asserts that increasing CO2 in the atmosphere changes the baseline and causes systemic warming in our climate. On the contrary, all of the warming since 1947 was episodic, coming from three brief events associated with oceanic cycles. And in 2024 we saw an amazing episode with a temperature spike driven by ocean air warming in all regions, along with rising NH land temperatures, then dropping well below its peak.
After a sub-par March maximum, 2026 Arctic ice in ensuing months closed the gap with the 20-year average. In August MASIE showed Arctic ice extent surplus to average. September Arctic ice added to the surplus and now during the annual minimum month of September 2026 there is Arctic ice aplenty at the day 260 average daily minimum.
During the annual dip in Arctic ice extent, the average year since 2006 is lowest on day 260 at 4.54M km2. It then rises to 4.8M km2 ten days later. The cyan line shows 2026 well above average throughout, its lowest extent at 4.74M km2 on day 257 and now up to 4.85M km2. SII v.4 was lower than MASIE throughout, but drew closer in recent days before ending 219k km2 in deficit. So far MASIE September average is 4.97M and SII is 4.64M, with 13 more days remaining in the month. Note 2007 was ~600k km2 in deficit to average at day 270, while last year was matching this one.
The regional distribution of ice extents is shown in the table below. (Bering and Okhotsk seas are excluded since both are now virtually open water.)
Region
2026260
Day 260 ave.
2026-Ave.
2007260
2026-2007
(0) Northern_Hemisphere
4852660
4544944
307716
4045776
806884
(1) Beaufort_Sea
550955
480711
70244
481384
69571
(2) Chukchi_Sea
320625
183714
136911
22527
298099
(3) East_Siberian_Sea
268872
267297
1575
311
268561
(4) Laptev_Sea
208038
141784
66254
235869
-27831
(5) Kara_Sea
18
28526
-28508
44067
-44049
(6) Barents_Sea
0
13149
-13149
7420
-7420
(7) Greenland_Sea
217002
185684
31318
333181
-116179
(8) Baffin_Bay_Gulf_of_St._Lawrence
51076
32165
18910
26703
24373
(9) Canadian_Archipelago
321919
273658
48261
225526
96393
(10) Hudson_Bay
16
4458
-4442
2270
-2254
(11) Central_Arctic
2912997
2932816
-19819
2665244
247753
The table shows large surpluses in Eurasian basins Laptev, Chukchi and Beaufort, more than offsetting smaller deficits in Central Arctic, Kara and Barents seas. Hudson Bay is mostly open water at this time of year. 2026 exceeds the average ice extents by 308k km2, or 7%, and is nearly a wadham greater than 2007 with a surplus of 0.808M km2 of ice extent.
September monthly average ice extent is considered the annual minimum for climate purposes. Note also that typically the lowest daily value occurs mid September, with a small positive gain between the end of August and end of September.
Why is this important? All the claims of global climate emergency depend on dangerously higher temperatures, lower sea ice, and rising sea levels. The lack of additional warming prior to 2023 El Nino is documented in a post SH Drives UAH Temps Cooler July 2025.
NSDIC acknowledged my query regarding the SII (Sea Ice Index) dataset. While awaiting an explanation I investigated further. My last download of the SII Daily Arctic Ice Extents was on July 30, meaning that the most recent data in that file was day 210, July 29. The header on that file was Sea_Ice_Index_Daily_Extent_G02135_v3.
Then on August 1, the downloaded file had the heading Sea_Ice_Index_Daily_Extent_G02135_v4. So it appears that these are now the values from a new version of SII. As I wrote in my query, since March 14 all of the values for Arctic Ice Extents are lower in this new record. The graph above shows the implications for August as an example of estimates from SIIv.4.
In the past, SIIv.3 tracked MASIE with slightly lower values. But with v.4, larger monthly average deficits to MASIE were reported in July 2025 ( -282k km2) and in August (-440k km2).
The change started in January 2025 and will be the basis for future reporting. The logic for this is presented in this document: Sea Ice Index Version 4 Analysis
In June 2025, NSIDC was informed that access to data from the Special Sensor Microwave Imager/Sounder (SSMIS) onboard the Defense Meteorological Satellite Program (DMSP) satellites would end on July 31 (NSIDC, 2025). To prepare for this, we rapidly developed version 4 of the Sea Ice Index. This new version transitions from using sea ice concentration fields derived from SSMIS data as input to using fields derived from the Advanced Microwave Scanning Radiometer 2 (AMSR2) sensor onboard the Global Change Observation Mission – W1 (GCOM-W1) satellite. On 29 July 2025, we learned that the Defense Department decision to terminate access to DMSP data had been reversed and that data will continue to be available until September 2026.
We are publishing Version 4, however, for these reasons:
• The SSMIS instruments are well past their designed lifespan and a transition to AMSR2 is inevitable. Unless the sensors fail earlier, the DoD will formally end the program in September 2026. • Although access of SSMIS will continue through September 2026, the Fleet Numerical Meteorology and Oceanography Center (FNMOC), where SSMIS data from the DMSP satellite are downloaded, made an announcement that “Support will be on a best effort basis and should be considered data of opportunity.” This means that SSMIS data will likely contain data gaps. • We have developer time to make this transition now and may not in the future. • We are confident that Version 4 data are commensurate in accuracy to those provided by Version 3.
At American Greatness, Leslie Matthews reviews a new book by geologist Gregory Wrightstone: A Very Convenient Warming. Excerpts with my bolds and added images.
Climate doomerism rests on far shakier ground
than its confidence would suggest.
Few books arrive with a thesis as deliberately provocative as its title. Gregory Wrightstone’s A Very Convenient Warming: How Modest Warming and More CO₂ Are Benefiting Humanity sets out to invert nearly every assumption underlying the modern climate conversation, and it does so armed less with rhetoric than with charts, ice core data, and centuries of documented harvests. A working geologist and executive director of the CO2 Coalition, Wrightstone builds his case on a canvas that stretches from the Carboniferous swamps to next year’s crop yields, and the sheer scale of that canvas is what gives the book its persuasive force.
Rather than opening with alarm, Wrightstone opens with arithmetic. Across the past 600 million years, he calculates, atmospheric CO₂ averaged roughly 2,600 parts per million, nearly seven times the concentration measured today and two and a half times the worst-case scenario the IPCC projects for the year 2100. Framed against that backdrop, today’s 420 parts per million looks less like a crisis and more like a modest recovery from what he calls a long era of carbon starvation, one that bottomed out near 182 parts per million during recent glacial advances, close to the 150 ppm threshold below which most land plants cannot survive at all.
Explaining what drove this decline is where the book’s account of sequestration becomes essential. Two mechanisms did most of the work, by Wrightstone’s reckoning. Roughly 80 percent of removed carbon became calcium carbonate rock, chiefly limestone, precipitated from saturated ocean water or built from the accumulated shells and skeletons of marine life. The remaining 20 percent took a slower, stranger path: algae and, later, lignin-rich trees died and were buried before microbial life had evolved the enzymes needed to decompose them, entombing carbon in what would eventually become coal, oil, and natural gas. Wrightstone leans on this history to reframe fossil fuels themselves, describing coal and oil as nothing more exotic than ancient sunlight, captured by photosynthesis and stored underground until combustion returns it to circulation.
Once that premise is established, the numbers Wrightstone marshals against the “unprecedented CO₂” narrative start to compound. Since the Industrial Revolution, atmospheric concentration has risen roughly 140 parts per million, from about 280 to 420, yet even that increase, he notes, still sits far below the 2,600 parts per million average of Earth’s deeper history and considerably below the levels present during most of the eras when complex life flourished.
If CO₂ truly functioned as the control knob of planetary temperature, as Wrightstone puts it, the geologic record ought to show the two moving in lockstep. Instead, he lines up four separate comparisons, each spanning a different length of time, and each one undercuts the correlation rather than confirming it. Between 1943 and 1976, even as postwar industrial output pushed emissions sharply upward, global temperature fell for 33 consecutive years, a cooling trend severe enough that many scientists of the era were predicting the onset of a new ice age rather than a warming one.
Reaching back further, the Central England Temperature record, the oldest continuous instrumental series in existence, shows roughly the first 250 years of post-Little Ice Age warming occurring while CO₂ levels remained at historic lows. The Medieval Warm Period presents a similar puzzle: comparable warmth occurred with concentrations some 140 parts per million below today’s figure. And looking across the full 8,000 years of the Holocene, Wrightstone finds temperatures gradually declining while CO₂ rose, an inversion he labels the Holocene Conundrum.
None of these four windows, spanning decades on one end and millennia on the other, produces the tight correlation the prevailing narrative would predict. Wrightstone instead points to Pacific Ocean cycles, particularly the El Niño Southern Oscillation, as tracking short-term temperature swings far more closely than carbon dioxide concentration ever does, a pattern he illustrates by charting El Niño events directly against satellite temperature records going back to 1950.
Wrightstone extends this skepticism to the computer models underpinning most climate policy, and here the book turns to harder arithmetic still. Citing the analysis of economist Ross McKitrick and atmospheric scientist John Christy, he reports that the models used in the latest IPCC assessment predicted warming of 0.42 degrees Celsius per decade, while satellite measurements actually recorded 0.17 degrees, an overprediction of roughly two and a half times.
If natural variability accounts for even half of the warming actually observed, he notes, the models’ error balloons to a factor of five. He adds that recent estimates of climate sensitivity indicate that the temperature rise expected from a doubling of CO₂ runs as low as 0.5 to less than 1.0 degrees Celsius, well beneath the assumptions baked into most model runs. Further, he cites Nobel laureate John Clauser’s contention that the models systematically underestimate the cooling effect of cloud cover, an error Clauser believes runs nearly twice as strong as the warming attributed to CO₂ itself.
The financial stakes Wrightstone attaches to this modeling gap are considerable. He calculates that achieving net zero emissions would cost roughly $275 trillion between 2021 and 2050, or about $9.8 trillion annually, a full tenth of global GDP. Running those figures through the MAGICC climate model, he finds that even a complete elimination of industrialized nations’ emissions starting in 2010 would avert only 0.28 degrees Celsius of warming by 2100, an outcome he prices at roughly $131 trillion for every tenth of a degree Fahrenheit avoided.
Having questioned both the mechanism and the models, Wrightstone turns to the historical record itself, and here the book’s argument sharpens into its most vivid form. Civilizations, he contends, have consistently suffered during cold periods and flourished during warm ones, a pattern he traces across nearly five millennia. His central illustration is the Greek Dark Ages, ushered in when temperatures across Europe fell 1 to 2 degrees Celsius at the close of the Minoan Warm Period around the thirteenth century B.C. Within roughly a century, the Hittite, Mycenaean, Minoan, and Canaanite civilizations had all collapsed, an episode historian David Kaniewski attributes to abrupt climate change that triggered region-wide crop failures and unsustainable conditions. Trade, art, and architecture receded across the region for four centuries or more, and Wrightstone extends the same pattern forward to the Dark Ages of the fifth through ninth centuries and to the Little Ice Age, both marked by famine and demographic collapse rather than the abundance he associates with the intervening warm periods.
Crucially, the book does not treat warmth above today’s alarm thresholds as theoretical. A 2020 study from the University of Barcelona, led by researcher Isabel Cacho, reconstructed Mediterranean temperatures across the last 2,000 years and identified the Roman period as the warmest stretch of that entire span, with conditions persisting for roughly 500 years. That warming, Wrightstone notes, exceeded the 1.5-degree Celsius threshold the IPCC treats as a point of no return, yet it produced no stagnation whatsoever. Instead, it coincided with the zenith of the Roman Empire and the Han Dynasty, an era so hospitable that olive trees grew in Germany’s Rhine Valley and wine grapes ripened as far north as Hadrian’s Wall, cultivation impossible in either location under today’s cooler climate. Sea level evidence corroborates the reconstruction: Pevensey Castle, once a coastal fortification of the Saxon Shore, now sits 1.5 kilometers inland, the submerged coastline having receded as the planet cooled again during the subsequent Little Ice Age.
Building on that historical foundation, Wrightstone devotes his closing chapters to cataloguing tangible benefits he attributes to rising CO₂ and modest warming. Because carbon dioxide is the essential raw material of photosynthesis, he argues that today’s still comparatively low concentrations continue to constrain plant growth and that recent increases have measurably improved agricultural yields worldwide. On natural disasters, he turns the conventional narrative on its head entirely. Citing direct correspondence with a database manager at the Centre for Research on the Epidemiology of Disasters, he reports that the apparent rise in recorded disasters between the 1970s and late 1990s reflected an expanding global reporting network rather than any actual increase in events, a distortion the organization itself later acknowledged. Once that reporting bias is corrected, the same data show disaster counts declining roughly ten percent since 2000, while global disaster deaths per decade have fallen more than ninety percent, from an average of 54,000 in the 1920s to about 4,500 in the most recent decade covered in the book.
My Mind is Made Up, Don’t Confuse Me with the Facts. H/T Bjorn Lomborg, WUWT
Wrightstone writes for a general readership, and the book largely succeeds at making paleoclimatology, carbon cycle chemistry, and climate modeling approachable without collapsing into oversimplification, aided by more than ninety charts drawn from ice cores, historical temperature series, and disaster databases. It should be read, however, with a clear sense of where it comes from. Wrightstone leads an organization explicitly dedicated to challenging the mainstream scientific consensus on climate change, and that mission shapes which studies he foregrounds and which he leaves aside. Still, judged on its own terms, the book assembles a genuinely substantial body of historical and empirical evidence, not merely assertion, for the claim that the relationship between carbon dioxide, temperature, and human flourishing is considerably less settled than the prevailing public narrative admits. For readers weary of forecasts of imminent catastrophe, Wrightstone’s accumulated evidence, spanning 600 million years of geology and two millennia of documented history alike, makes a strong case that climate doomerism rests on far shakier ground than its confidence would suggest.
The best context for understanding decadal temperature changes comes from the world’s sea surface temperatures (SST), for several reasons:
The ocean covers 71% of the globe and drives average temperatures;
SSTs have a constant water content, (unlike air temperatures), so give a better reading of heat content variations;
A major El Nino was the dominant climate feature in recent years.
Previously I used HadSST3 for these reports, but Hadley Centre has made HadSST4 the priority, and v.3 will no longer be updated. Reports since February are based on HadSST 4, but with a twist. The data is slightly different in the new version, 4.2.0.0 replacing 4.1.1.0. Product page is here.
The Current Context
The chart below shows SST monthly anomalies as reported in HadSST 4.2 starting in 2015 through August 2026. A global cooling pattern is seen clearly in the Tropics since its peak in 2016, joined by NH and SH cycling downward since 2016, followed by rising temperatures in 2023 and 2024 and cooling in 2025, now with a steady mild rising in 2026 pausing in May, resuming in June and rising sharply into July and August.
Note that in 2015-2016 the Tropics and SH peaked in between two summer NH spikes. That pattern repeated in 2019-2020 with a lesser Tropics peak and SH bump, but with higher NH spikes. By end of 2020, cooler SSTs in all regions took the Global anomaly well below the mean for this period. A small warming was driven by NH summer peaks in 2021-22, but offset by cooling in SH and the tropics, By January 2023 the global anomaly was again below the mean.
Then comes a third iteration of the pattern starting in 2023 and continuing through July 2026. Each year presents a summer NH warming spike with the highest in 2023, now approached by 2026. The Tropics have a different rhythm, rising dramatically in 2023, peaking in 2024, then rapidly declining hitting bottom end of 2025. Now in 2026 ENSO is returning with a spike raising temperatures in all regions pulling the Global anomaly upward. The August NH peak matches the 2023 NH peak along with higher values for SH, Tropics and Global anomaly.
Comment:
The climatists have seized on this unusual warming as proof their Zero Carbon agenda is needed, without addressing how impossible it would be for CO2 warming the air to raise ocean temperatures. It is the ocean that warms the air, not the other way around. Recently Steven Koonin had this to say about the phonomenon confirmed in the graph above:
El Nino is a phenomenon in the climate system that happens once every four or five years. Heat builds up in the equatorial Pacific to the west of Indonesia and so on. Then when enough of it builds up it surges across the Pacific and changes the currents and the winds. As it surges toward South America it was discovered and named in the 19th century It iswell understood at this point that the phenomenon has nothing to do with CO2.
Now people talk about changes in that phenomena as a result of CO2 but it’s there in the climate system already and when it happens it influences weather all over the world. We feel it when it gets rainier in Southern California for example. So for the last 3 years we have been in the opposite of an El Nino, a La Nina, part of the reason people think the West Coast has been in drought.
It has now shifted in the last months to an El Nino condition that warms the globe and is thought to contribute to this Spike we have seen. But there are other contributions as well. One of the most surprising ones is that back in January of 2022 an enormous underwater volcano went off in Tonga and it put up a lot of water vapor into the upper atmosphere. It increased the upper atmosphere of water vapor by about 10 percent, and that’s a warming effect, and it may be that is contributing to why the spike is so high.
A longer view of SSTs
To enlarge, open image in new tab.
The graph above is noisy, but the density is needed to see the seasonal patterns in the oceanic fluctuations. Previous posts focused on the rise and fall of the last El Nino starting in 2015. This post adds a longer view, encompassing the significant 1998 El Nino and since. The color schemes are retained for Global, Tropics, NH and SH anomalies. Despite the longer time frame, I have kept the monthly data (rather than yearly averages) because of interesting shifts between January and July. 1995 is a reasonable (ENSO neutral) starting point prior to the first El Nino.
The sharp Tropical rise peaking in 1998 was dominant in the record, starting Jan. ’97 to pull up SSTs uniformly before returning to the same level Jan. ’99. There were strong cool periods before and after the 1998 El Nino event. Then SSTs in all regions returned to the mean in 2001-2.
SSTS fluctuate around the mean until 2007, when another, smaller ENSO event occurs. There is cooling 2007-8, a lower peak warming in 2009-10, following by cooling in 2011-12. Again SSTs are average 2013-14.
Now a different pattern appears. The Tropics cooled sharply to Jan 11, then rise steadily for 4 years to Jan 15, at which point the most recent major El Nino takes off. But this time in contrast to ’97-’99, the Northern Hemisphere produces peaks every summer pulling up the Global average. In fact, these NH peaks appear every July starting in 2003, growing stronger to produce 3 massive highs in 2014, 15 and 16. NH July 2017 was only slightly lower, and a fifth NH peak still lower in Sept. 2018.
The highest summer NH peaks came in 2019 and 2020, only this time the Tropics and SH were offsetting rather adding to the warming. (Note: these are high anomalies on top of the highest absolute temps in the NH.) Since 2014 SH has played a moderating role, offsetting the NH warming pulses. After September 2020 temps dropped off down until February 2021. In 2021-22 there were again summer NH spikes, but in 2022 moderated first by cooling Tropics and SH SSTs, then in October to January 2023 by deeper cooling in NH and Tropics.
Then in starting in 2023 the Tropics flipped from below to well above average, while NH produced a summer peak extending into September higher than any previous year. 2024 and 2025 replicated summer peaks in the previous itertation. Now in 2026 July is nearly as high as 2023.
What to make of all this? The patterns suggest that in addition to El Ninos in the Pacific driving the Tropic SSTs, something else is going on in the NH. The obvious culprit is the North Atlantic, since I have seen this sort of pulsing before. After reading some papers by David Dilley, I confirmed his observation of Atlantic pulses into the Arctic every 8 to 10 years.
Contemporary AMO Observations
Through January 2023 I depended on the Kaplan AMO Index (not smoothed, not detrended) for N. Atlantic observations. But it is no longer being updated, and NOAA says they don’t know its future. So I find that ERSSTv5 AMO dataset has current data. It differs from Kaplan, which reported average absolute temps measured in N. Atlantic. “ERSST5 AMO follows Trenberth and Shea (2006) proposal to use the NA region EQ-60°N, 0°-80°W and subtract the global rise of SST 60°S-60°N to obtain a measure of the internal variability, arguing that the effect of external forcing on the North Atlantic should be similar to the effect on the other oceans.” So the values represent SST anomaly differences between the N. Atlantic and the Global ocean.
The chart above confirms what Kaplan also showed. As August is the hottest month for the N. Atlantic, its variability, high and low, drives the annual results for this basin. Note also the peaks in 2010, lows after 2014, and a rise in 2021. Then in 2023 the peak reached 1.4C before declining to 0.8, and now back up to 1.2C August 2026. An annual chart below is informative:
Note the difference between blue/green years, beige/brown, and purple/red years. 2010, 2021, 2022 all peaked strongly in August or September. 1998 and 2007 were mildly warm. 2016 and 2018 were matching or cooler than the global average. 2023 started out slightly warm, then rose steadily to an extraordinary peak in July. August to October were only slightly lower, but by December cooled by ~0.4C.
Then in 2024 the AMO anomaly started higher than any previous year, then leveled off for two months declining slightly into April. Remarkably, May showed an upward leap putting this on a higher track than 2023, and rising slightly higher in June. In July, August and September 2024 the anomaly declined, and despite a small rise in October, ended close to where it began.
Note 2025 started much lower than the previous year and headed sharply downward, well below the previous two years, and since April through September aligning with 2010. In October there was an unusual upward spike, now reversed down to match 2022 and 2016. The orange 2026 line started downward and is visible on top of 2016 purple line, then slightly higher, and now spiking higher in July and August up to 1.2C.
The pattern suggests the ocean may be demonstrating a stairstep pattern like that we have also seen in HadCRUT4.
The purple line is the average anomaly 1980-1996 inclusive, value 0.18. The orange line the average 1980-2026, value 0.42 also for the period 1996-2013. The red line is 2013-2026, value 0.72. As noted above, these rising stages are driven by the combined warming in the Tropics and NH, including both Pacific and Atlantic basins.
The oceans are driving the warming this century. SSTs took a step up with the 1998 El Nino and have stayed there with help from the North Atlantic, and more recently the Pacific northern “Blob.” The ocean surfaces are releasing a lot of energy, warming the air, but eventually will have a cooling effect. The decline after 1937 was rapid by comparison, so one wonders: How long can the oceans keep this up? And is the sun adding forcing to this process?
USS Pearl Harbor deploys Global Drifter Buoys in Pacific Ocean
In this interview, National Post’s Rob Breakenridge speaks with Carleton University business professor Ian Lee about the need for Canadians to accept some of the basic economic realities we’re facing and the potential economic damage from a prolonged trade war. If we’re not careful, Lee warns that we could stumble into a recession or even see capital flight out of the country. For those prefering to read I provide a transcript lightly edited from the captions with my bolds and added images.
RB: Hey folks, I’m Rob Breakenridge for NationalPost.com, and NP comment. Well this unfortunate trade war between Canada and the U.S. has indeed escalated further this week. Canada’s counter tariffs on the U.S. have taken effect and in response the Americans have widened the scope of their own new tariffs on Canadian goods. So Ian Lee, professor at the Sprott School of Business at Carleton University, is joining us for some further thoughts on the impact of this trade war, where this is all going, what Canada’s strategy might possibly be in all of this. Professor Lee, great to have you with us here. IL: My great pleasure. Thanks for inviting me, Rob.
RB: I think a lot of Canadians are looking at this with dismay wondering, you know, how did it get to this point? How did things go so sideways and would it otherwise been a productive trading relationship? Just your thoughts first of all on where we are right now.
IL: It’s almost a tragedy. This is almost a Shakespearean tragedy. I mean I don’t want to become overwrought and over the top but, I’ve been teaching business for 35 years. Before that I was nine years in commercial banking. I’ve lived in this country all my life but I’ve traveled around the world, lived twice in the States on sabbaticals, once in D.C., once in the West Coast just below Silicon Valley. I’ve traveled many, many times across the border because my sister’s an American and I’ve just never seen anything like this.
Our relationship, I mean I’ll say it again, we all know the history, it goes back a quarter of a millennium. It goes back 250 years, way before Confederation. We have the longest border in the world. I won’t even get into the border defended versus undefended. I mean it’s 8,800 kilometers long.It’s stunning. And we have had a pretty good relationship during that time, you know, a few ups and downs. Every now and then Lyndon Johnson got angry at Lester Pearson when he criticized the Vietnam War but by and large it was pretty good. And the trade continues to flow because of the tremendous integration between the two countries and the relationship.
So I’m looking at this and it just seems, I don’t believe that there’s a geopolitical logic to this in the Kissingerian sense. I think that, some emotions have got out of hand, some very unfortunate remarks, yes, and yes, I’m not trying to sugarcoat Donald Trump. I don’t agree with anything he says on tariffs because I support free trade agreements. I supported every free trade agreement since 1988 and free trade agreements take tariffs away. They’re the opposite of tariffs.
But I think that we need to get back to the negotiating table. It’s not going to be easy. It’s going to be hard.Winston Churchill taught us it’s far better to jaw jaw than to war war. War is only the very, very, very last resort. Kissinger taught us that too. So I think there’s been mistakes. Yes, I’m a Canadian so I think more mistakes on the American side but still, I think we have to get back to the table and get back to negotiating because we can’t let this fall apart.
RB: Right. And obviously with Trump the first time around we’ve managed to get a renegotiated free trade deal, what we refer to as CUSMA. Clearly Trump 2.0 has a different, more aggressive trade policy, a more protectionist trade policy and they’ve doubled down on a lot of those elements. Do you think Canadians and maybe this government were not prepared for that shift or they didn’t see it coming or that we just sort of thought that, okay, we dealt with this already. We weren’t going to have to worry about these issues.
IL: I think so, I think that they were honest mistakes on our side. We didn’t realize that Trump 2.0 was going to be much more aggressive in his second and final term, limited by the Constitution, we know that, older, maybe not, maybe not wiser. But certainly more aggressive in his speeches and comments in that secondcampaign. He was much more bitter twisted, you know, in terms of the way he’d been treated by the Democrats. So I think mistakes were made there. We underestimated, maybe we didn’t do our due diligence. And then I think it was, I believe, it was exacerbated. I’m not trying to blame, put on the blame and, you know, I don’t want to offend Andrew Coyne and have him coming after me or anyone else because he makes these arguments that we’re blaming ourselves.
But I know negotiations, whether it’s in a divorce or in a country to country or labor management, and I’ve certainly been involved in two of those categories, it involves both sides and there’s mistakes on both sides in negotiations and there’s interest in both sides. And I think that we used intemperate language at the beginning, at the very beginning. Yes, he was also, but I don’t think we should have responded.
I have all my life, I just believe that using pejorative language and insults is not the way to get a deal. And so I think that we, you know, we let the tempers and the emotions take charge rather than the logic and the data, the reality of the self-interest in the negotiations. So the U.S. imposed tariffs on Canada, the U.S. has imposed tariffs on most of its trading partners, and that’s sort of the approach now of this administration.
RB: In terms of Canada responding and the impact of counter tariffs, and now we’re at the point where, as we mentioned at the outset, things have really escalated between the tariffs and the retaliation. Do we have a good understanding in this country, Ian, of what it is we’re doingand the cost and the impact of these kinds of policies?
IL:I don’t, and I don’t belong to any political party, I do not donate funds to any political party, I don’t have a dog in this hunt, I don’t consult with any of these organizations, but I certainly have been teaching strategy in the capstone course and the MBA program and dealing, of course, necessarily with Canadian-American trade relations, because they are our largest trading partner and have been pretty well forever, and certainly in the 20th century and going forward.
I think that the emotions have become so raw and so heated that we have neglected to look, with very hard nose, at the results and the cost of this. I quote Stats all the time, and I mean Stats Canada Stats, also World Trade Organization Stats, government Stats of trade relations and so forth. We are one-thirteenth the size of the United States, but there’s another figure I want to throw up because, probably people know that one.
You know, they’re 32 trillion, we’re about 2.2 trillion expressed in U.S. dollars in terms of GDP, so they dwarf us. I mean, Pierre Trudeau taught us that, you know, we’re the mouse, they’re the elephant. But there’s a lot of Canadians who say, well, you know, they really depend on us, or they’re dependent on Canada. And this has been driving me crazy because I knew that wasn’t true. I understand arithmetic. The totality of Canadian exports annually are about 400 billion. And most people say, wow, that’s a huge amount of money. It’s 1.5% of U.S. GDP.
The idea that they are dependent and we can, ”bring them to their knees”
is just a denial of arithmetic.
This doesn’t require calculus.This doesn’t require a doctorate in economics. I really am being blunt here. You know, the U.S., if you look from a slightly different angle very quickly, the U.S. trades less with the outside world in percentage terms. The key point is we have to normalize the data to percentages. We can’t talk absolutes because the U.S. is so huge. In percentage terms, the U.S. trades less with the world than any other OECD country. 85% of American GDP is American companies trading with American companies in California or Illinois or, across the U.S., 15% with the rest of the world. And we’re a subset of that 15%.
So this idea that we can bring them to their knees because they’re completely dependent on Canada is just preposterous nonsense.The U.S. has relations with just about every country in the world because most countries in the world want to deal with the largest economy, the world hegemon. And so we do not have the leverage that many Canadians think we have. And so I think that that belief has caused us to perhaps be much less willing to compromise when it is in our national strategic self-interest to compromise.
RB: And maybe in certain states or certain industries, you know, Kentucky bourbon felt like it was punched in the nose. We can make, you know, little scores or little hits here and there. But in terms of something that’s really going to move the needle in terms of the American economy or overall cost pressures, is there much that Canada can do in that sense?
IL: I believe there is. I keep quoting Kissinger just because I’ve always admired him. He’s brilliant. He was a strategy prof at Harvard for 25 years before Richard Nixon appointed him to the administration and he convinced Richard Nixon that his policy of refusing to recognize the largest population in the world called China, red China, was just a bad thing. And he caused the Americans to finally recognize China, even though it was then and now an adversary.
So to your question, I think that our emotions have put us into a box. Our reaction is completely: How can we punch him back? How hard can we punch him back? We think only in mono response.It’s how much damage they just disrespected me. So how much disrespect back do we give? Instead of thinking much more strategically, don’t get mad, get even type of logic, and saying, well, you know, there’s things that the Americans want from us and there’s things that we want from them. They were at the table. People seem to forget when they say Donald Trump doesn’t want to negotiate with us. You and I’ve been involved with the negotiations, not at the country level, but people only go into negotiations because they want something from the other side. If there’s nothing I want from somebody else, I’m not going to waste my time talking to them.
And the Americans were at the table up until the very day that it broke. So there’s something they want from us. And we can look at the record. We know that China has the United States by the throat on critical minerals. We know they’re deeply interested in critical minerals to reduce their dependency on China. We know that because it’s in every just about every article in Foreign Policy magazine, Foreign Affairs magazine in Washington by very senior former decision makers, Republican and Democrat, military, legal, commercial. There is a unanimity in Washington, they see China as a mortal existential threat.
We think that this is all about the United States and Canada. It is not. This is really part of a much bigger crisis that’s going on, the whole debate over the so-called China shock 2.0. And those incredible, unsustainable balances, 1.4 trillion net exports and the Chinese Communist Party, the ruling Politburo has in their five-year plan a very short time ago, has promised to double their exports and their manufacturing.
So if we thought we had a crisis in the last 10 years with over-exporting by China, we haven’t seen anything yet. And so we are really part of a much larger issue. And we’ve got to recognize that, that they’re what they’ve said to us allegedly on China wasn’t because they were trying to ruin us or absorb us or put us out of business. It’s because they are focused on China. We mistakenly think they’re focused on us. I go frequently to the United States, and they’re not paying attention to us, but they are very, very aware of China and in every sense of the word.
And I’m not trying to demonize China. I’ve been teaching in China for a third of a century every year in an MBA program. And my Chinese students are outstanding. They’re amazing. They’re disciplined. I have great respect for the Chinese nation and the Chinese people.
But there is no question the studies have shown the China problem. The anti-dumping tribunals have ruled this, that China is cheating in terms of industrial subsidies, five times what they are in Europe or Canada or the US. German Chancellor Merz said last week said that the currency is undervalued by 30 percent. And that’s been very deliberate to, again, give them a competitive advantage.
So what I’m saying is we’ve got to step back. We, Canada, we the negotiators and say it’s not all about us.And we got to at least acknowledge the bigger, larger context that we find ourselves in and in returning to the table. And maybe that will temper our views so that we can make some compromises. And I think we’re going to have to make some compromises to return to the table.
I’ll be very blunt. I’ll put supply management right at the top of the list. It’s been on the US Trade Rep’s list report tabled in the Congress for 50 years. Every president since Reagan. I’m not here to defend Trump, I don’t agree with him at all. But this notion is false, that he’s made up all these ideas that he’s demanding compromises on and it’s never been demanded before by the US. Canadians should be downloading and reading the US Trade Rep report for each year for the last 10, 20, 30 years because they’ve been saying the same thing over and over and over and over again.
I’m not saying that justifies it, but at least it gives you a better understanding of where these demands are coming from.The way I like to put it very quickly, Rob, is the only difference, fundamental difference, aside from the fact he’s far more vulgar and he uses all kinds of language that’s just horrible. But Trump didn’t invent these grievances. They’ve been there for since Reagan, by and large.The difference between Trump and past presidents was past presidents said, look, we don’t like it.
Obama said that to the House of Commons. I’m two kilometers from the Parliament Hill in Ottawa. And he came down here. He said, we’ve got these unhappy irritants. We don’t like them, Canada, but you’re a great ally.We’ve been allies forever and ever. So we are not going to push it and and make it into a huge crisis, basically, was what Obama said. And past presidents said that, too.
The difference with Trump was he took the same set of grievances, threw in a few more, and then said, and this is not acceptable and I am going to punish you. That’s the difference between Trump and past American presidents. They knew about all these trade irritants.They’d been there for a very long time. We ignored them and they looked the other way. The difference is Trump said, I’m not looking the other way. In fact, I’m going to punish you.
And so instead of saying he’s trying to break us, rather he’s just trying to get to compromise and meet the demands that they want on these issues that are very important to them. We have to decide which ones are worth dying on a hill for and which ones are not that important. I cannot see any serious argument that potentially risking a new CUSMA for 8000 dairy farmers in Quebec so that we can continue to double the price of milk and dairy to low income and ordinary Canadians is a hill to die on. It is just not worth it.
We should do what the Australians and the New Zealand government did in 2000 when they paid off the farmers in supply management, gave them generous compensations and said we are ending supply. And they did. We’re the only country in the world now with supply management. That’s the kind of strategic thinking that we need instead of this emotionalism that is the name calling and so forth, because we need to get back to the table.
It’s in our strategic self-interest. We have this border. We have 50,000 businesses exporting to the US, most of them SMEs. Many of them are undercapitalized, like all SMEs, and they’re at risk of failing if they get lose access to that market. And so we can’t treat these ordinary Canadians and the people that work there in a such a cavalier fashion, such a callous fashion, and just say, too bad, we’re angry at Trump. And so you’re just going to be roadkill. I think we have to develop a more strategic approach that is more sensitive and more aware of the larger context. And we’ve got to get back to the table.
RB: So if we don’t and I guess it’s unclear at this point which way things are going to go. But if we do dig in our heels and this is prolonged with the American tariffs remaining in place, our counter tariffs remain in place. This will put costs, puts costs and pressure on the Canadian economy. How worried are you about the fallout from this trade?
IL: I have already said and predicted from past experience. When I was at the Bank of Montreal, main office branch, Ottawa, right beside Westbrook, Parliament Hill. And that’s when interest rates went to twenty one percent. So when people complain about interest rates going to five or six, I said, that is a walk in the park. That’s a picnic. I was there when lending mortgage money was at twenty one percent. It was just unbelievable.
Businesses were going down like ten pins.The unemployment rate went to the highest level since the Great Depression. So I lived through that. That was the worst recession since the Great Depression, much worse than 2009 or any recession since. And it was horrible. And so if we lose access to the largest economy in the world and we have so many small businesses. And according to stats can data from this morning, they account for 73 percent of all private sector employment in Canada, then I believe we’re going to go into a recession.
And we have to start saying, is that what we want? And can we afford this after doubling the debt because of the covid support? And now we have doubled it. And when you look at federal provincial municipal debt as a percentage of GDP, we’re at the same level essentially as the French. And that’s not a compliment. And that’s not we’re not doing well. Contrary to what Finance Minister Champagne says, because he just cherry picks the federal debt and doesn’t include all of the debt, which is the normal practice for the international financial institutions.
So my point is, you know, we could be looking at because, of course, we’re going to support these people. Of course, we’re going to have to inject enormous amounts of stimulus.And this comes right after covid. And it’s so unnecessary. And I still don’t see the exit ramp. So we do that. OK, great. So we do that for six months. Now we’re going to do it for another six months, do it for another year. We can’t do that indefinitely into the future. There’s got to be an exit ramp and we can’t just go on and on and on like this.
And that means, in my judgment, that we must return to the table. Yes, make some compromises on the things that are not critical in a national strategic sense and then negotiate a new deal. And it may be only for two years because we think that, after he leaves office, we can negotiate a better deal. OK, I mean, I have no problem with that, but forget this idea that we can just wait him out and suspend the Canadian economy somehow. We’ll just, you know, suspend it, you know, and if you can’t access the U.S. economy for the next two years, the private sector, well, it’ll come back maybe in two years.
You can’t run a country like that. You can’t run a society saying, well, we we think and we hope and we really are counting on maybe perhaps possibly getting a better deal in two or three or four years. We can’t go down that road. We have to deal with the facts as they are on the table.We have to deal with the reality. Pierre Trudeau famously said to govern is to choose to make tough choices. We it’s now the time for leadership in Canada to make tough choices and have a conversation, a blunt adult conversation with the Canadian people, putting facts on the table, telling Canadians they’re 13 times bigger.They are the world hegemon.
No, we’re not going to lie down on the railroad tracks and let them run over us.
But we are going to have compromises to enable our business sector to
prosper because we don’t want to slide into a recession
or something even worse with capital flight.
Rob, very quickly, I know I’m talking too much, but what really terrifies me is the capital flight. And people say and I get emails, well, this this product, a hockey stick or something, we can live with that. And so they try and nibble me in an argument, you know, this little, micro tariff on this product, can we take the hit? That’s not my fear. It’s not the specific tariff of a specific industry or specific product.
My fear is what the KPMG study showed three weeks ago. Forty two percent of manufacturing businesses in this country are actively examining, moving to the States. In the words of the World Bank, that’s called capital flight. And it’s experienced normally, typically in developing third world countries that are massively mismanaged. Argentina has experienced massive capital flight. Russia has been experiencing massive capital flight the last three or four years.
And and when that capital leaves, those factories aren’t coming back.Those businesses aren’t coming back. They’re not going to say two years later, OK, you changed your mind. You figured out your problems in the States. I’ll come back now. Once they go, they’re gone. And that’s the backbone of our country.They employ 16 million of the 20 million Canadians.
The idea that the public sector is going to save us by buying some submarines and some helicopters is just fantasy. We’ve got to have a vibrant private sector.And so that’s why we’ve got to have a much more tough conversation and put some frank data on the table, one of which is that we cannot bring the US to its knees because that we are a tiny part of their economy.
And I’m hoping that Prime Minister Carney has some kind of a fireside chat with Canadians, a la the Roosevelt back in the back in the back in the in the Depression when he had those fireside chats telling everybody how horrible and terrible life was. He didn’t sugarcoat it.He showed leadership. Same with Winston Churchill. You know, yes, he had optimism, but he said these are very, very dark days.I remember him because my late father was a Brit.
They showed leadership in tough times.They didn’t pander to our worst emotions and anger. And so I’m hoping that Prime Minister Carney will show that leadership and have that tough frank talk with Canadians, because something like 75 or 80 percent of Canadians are saying things like don’t give up a thing to the United States.
Well, we don’t give up anything, then we’re not going to have a deal because negotiations involve giving and taking. That’s what negotiations are. And so that’s what we need in this country. And is that kind of that very hard nosed, tough minded conversation with the Canadian people in a fireside chat and not pour gasoline on the raging fire, making it even more inflammatory and inflamed?
RB: Well, we shall see.Professor Lee, really appreciate the insight. Thank you so much for joining us here. Thanks very much, Rob.Thank you. Really appreciate it. Ian Lee, professor of the Sprott School of Business at Carleton University.My name is Rob Breckenridge. Thanks again for joining us here.
The chart above from DMI shows why Arctic ice melted more slowly than average. This year the daily mean temperature never went above freezing, From now on it will only grow colder. The daily minimum may have occured already on Sept. 7 with an ice extent of 4.9M km2.
August is significant because it is the last month that NH ice extent declines. Those familar with the datasets know that March monthly average is taken as the annual maximum ice extent, and September monthly average serves as the annual minimum. Importantly both months are neutral, i.e. the ice extent values are nearly the same at the month start and end. All the melting occurs April to August, all the freezing October to February.
[ It reminds me what a Saskatchewan grain farmer told me: “Around here we only have AAA farmers”. I asked what he meant and he replied: “April to August and then Arizona.”]
The arctic ice extents are now reported through September 11, 2026, and as noted previously the wavy polar vortex had hampered ice formation with incursions of warmer southern air into the Arctic circle. This factor receded in May and June, with July extents closing the gap with the averages. Melting ceased after Sept. 7 and is now ~5.0M km2. The Northern Sea Route (NSR) goes through the Russian shelf seas of Laptev, East Siberian, and Chukchi seas on the way to Bering Strait in Beaufort Sea.
The image from September 11 shows the Arctic Ocean core is still solid, while the Eurasian NSR now has open water on the left vertical side, including passages through Laptev (top left) and Chukchi (bottom Left). As usual in August, Hudson Bay (bottom right) is full open water, as is Baffin Bay (middle right). At this point Canadian Archipelago has opened up the eastern end of the NW passage, but has extensive old ice as well as growing additional fast ice in Beaufort sea (bottom center). Canadian Ice Service latest conditions along the Alaskan coast include an ice warning for ships:
The chart below shows the 20-year August averages for Arctic ice extents, along with 2026, 2025 and 2007 as well as SII v.4. Note that on average ice extents hover around 4.6M km2 ending this period. In this period MASIE was well above average throughout currently hovering around 5.0 M km2, and comparable to 2025. SII v.4 continues to greatly underestimate Arctic ice extent, presently ~0.35M km2 lower than MASIE. All of these are higher than 2007.
The table below shows the distibution of ice extents on day 254 across regions of the Arctic ocean.
Region
2026254
Day 254 ave.
2026-Ave.
2007254
2026-2007
(0) Northern_Hemisphere
4948149
4643810
304340
4349612
598537
(1) Beaufort_Sea
659822
502590
157231
599679
60143
(2) Chukchi_Sea
344007
216432
127575
74733
269274
(3) East_Siberian_Sea
277773
292941
-15168
311
277462
(4) Laptev_Sea
213926
155123
58803
247496
-33569
(5) Kara_Sea
18
33322
-33304
62274
-62255
(6) Barents_Sea
0
14658
-14658
7384
-7384
(7) Greenland_Sea
192766
176959
15807
324789
-132023
(8) Baffin_Bay_Gulf_of_St._Lawrence
39619
28358
11261
21406
18213
(9) Canadian_Archipelago
302503
273010
29493
210083
92420
(10) Hudson_Bay
16
6972
-6956
16552
-16536
(11) Central_Arctic
2916558
2942564
-26006
2783651
132907
The table shows an overall surplus of 304k km2 or 7%, and more than a half wadham greater than 2007. Many regions are close to or above the 20-year average. The seas of Laptev, Chukchi and Beaufort are in surplus. The only sizeable deficit is in Kara Sea. Bering and Okhotsk seas are left off the list since they are open water now as usual.
Illustration by Eleanor Lutz shows Earth’s seasonal climate changes. If played in full screen, the four corners present views from top, bottom and sides. It is a visual representation of scientific datasets measuring ice and snow extents.


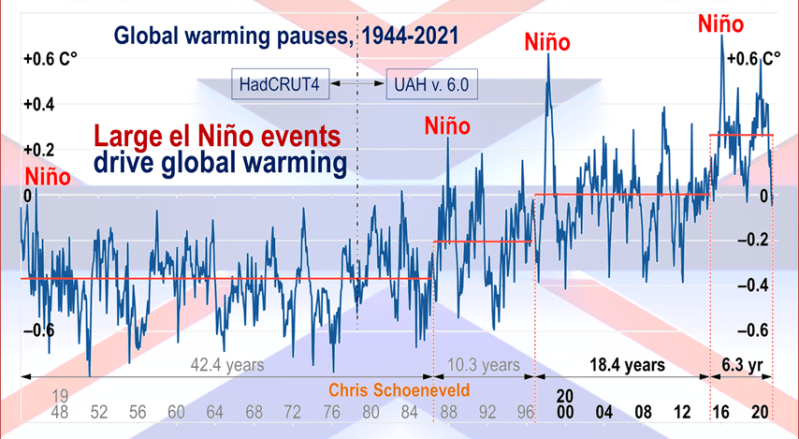


 The best context for understanding decadal temperature changes comes from the world’s sea surface temperatures (SST), for several reasons:


 The chart above from DMI shows why Arctic ice melted more slowly than average. This year the daily mean temperature never went above freezing, From now on it will only grow colder. The daily minimum may have occured already on Sept. 7 with an ice extent of 4.9M km2.


