I just happened upon the video above, which explains so clearly the Left and Right orientations of people in society. Transcript below in italics with my bolds.
Jordan Peterson Responds to Question about Social Issues like Climate
Q: So what is your advice to young people, when you talk about you need to be individually responsible, but when they’re things that are so far out of our control, like climate catastrophe, like the precarious job economy, like, what is your answer?
JP: Things are not so far out of control as you think. Do you think that you’re worse off than your grandparents? (I think they’re a different challenge.) Do you think you’re worse off than your grandparents?
Q: The argument, I think, is that individual responsibility does not fix some things. The climate problem needs global collective responsibility. So I think that’s the core of the question. Do you have a theory about that?
JP: Well, fundamentally, I’m a psychologist. And my experience has been that people can do a tremendous amount of good for themselves, and for the people who are immediately around them, by looking to their own inadequacies and their own flaws and the things that they’re not doing in their lives. By starting to build themselves up as more powerful individuals, and if they’re capable of doing that, then they’re capable of expanding their career.
JP: And if they’re capable of expanding their career and their competence, then they’re capable of taking their place in the community as effective leaders. And then they’re capable of making wise decisions instead of unwise decisions when it comes to making collective political decisions. I’m not suggesting in the least, and have never suggested that there’s no domain for social action.
I’m suggesting that people who don’t have their own houses in order should be very careful before they go about reorganizing the world, which happens in many ways.
Q: If a young person believes that the climate the global warming problem on the climate is something that needs to be tackled quickly, and they can’t wait until they grow up and become prime ministers to do it, do you think collective responsibility overrides individual responsibility in a huge issue like that?
JP: No. I don’t think that is generally the case. I think generally people have things that are more within their personal purview that are more difficult to deal with and that they’re avoiding. And generally, the way they avoid them is by adopting pseudo moralistic stances on large scale social issues so that they look good to their friends and their neighbors.
Commentary by Dennis Prager
That’s a major difference between the right and the left, concerning the way each seeks to improve society. Conservatives believe that the way to a better society is almost always through the moral improvement of the individual by each person doing battle with his or her own weaknesses, and flaws. It is true that in violent and evil society such as fascist Communist or Islam is tyrannies, the individual must be preoccupied with battling outside forces. Almost everywhere else, though, certainly in a free and decent country such as America, the greatest Battle of the individual must be with inner forces, that is with his or her moral failings.
The left on the other hand, believes that the way to a better society is almost always through doing battle with society’s moral failings. Thus, in America, the left concentrates its efforts on combating sexism, racism, intolerance, xenophobia, homophobia, Islamophobia, and the many other evils that the left believes permeate American society.
One important consequence of this left right distinction is that those on the left are far more preoccupied with politics than those on the Right. Since the left is so much more interested in fixing society than in fixing the individual, politics inevitably becomes the vehicle for societal improvement. That’s why whenever the term activist is used, we almost always assume that the term refers to someone on the left.
Another consequence of this left right difference is that since conservatives believe society has changed one person at a time, they accept that change happens gradually. This isn’t fast enough for the left, which is always in everywhere focused on social revolution. An excellent example of this was a statement by the then presidential candidate Barack Obama, just days before his first election in 2008. To our rapturous audience, he declared, we are five days away from fundamentally transforming the United States of America.
Conservatives not only have no interest in fundamentally transforming the United States of America, they are strongly opposed to doing so. Conservatives understand that fundamentally transforming any society that isn’t fundamentally bad, not to mention transforming what is one of the most decent societies in history can only make the society worse. Conservatives believe that America can be improved, but should not be transformed, let alone fundamentally transformed.
The founders of the United States recognized that the transformation that every generation must work on is the moral transformation of each citizen. Thus, character development was at the core of both child rearing and of young people’s education from elementary school through college. As John Adams, the second president said, our constitution was made only for a moral and religious people, it is wholly inadequate to the government of any other. And in the words of Benjamin Franklin, only a virtuous people are capable of freedom. Why is that? Because freedom requires self control, the free or the society, the more self control is necessary. If the majority of people don’t control themselves, the state, meaning an ever more powerful government, will have to control them.
From the founding of the United States until the 1960s, schools and parents concentrated on character education. But with the ascent of left wing ideas, character education has all but disappeared from American schools. Instead, children are taught not to focus on their flaws, but on America’s social issues have replaced character education. An example is a new K through 12science curriculum, the next generation of science standards, which will teach young Americans starting in kindergarten about global warming. And when they get to college, American young people will be taught about the need to fight economic inequality, white privilege, and the alleged rape culture on their campuses.
Ironically, if there really is a rape culture that permeates American college campuses, the only reason would have to be that there was so little character education in our schools, or for that matter at home. Fathers and religion, historically the two primary conveyors of self control, are non existent in the lives of millions of American children. We are now producing vast numbers of Americans who are passionate about fixing America while doing next to nothing about fixing their own character.
The problem, however, is that you can’t make society better unless you first make its people better.
Rod Dreher writes at American Conservative about the chasm opening and dividing the previous United States. His article is titled Joe Rogan World Vs. NPR World, but those words don’t reveal the importance or depth of his insights. He starts with a familiar experience of hearing newscasting perverted by an agenda. Excerpts in italics with my bolds.
Yesterday when I drove up to the country to visit my mother, I listened to NPR until I couldn’t take it anymore. There was a story about black Mormons. Normally I would have found that compelling, given my interest in religion. The Mormon religion used to be formally racist, but changed its teaching. What is it like to live as a black Mormon? That’s a story that interests me. Or normally would, but I swear, I turned off the radio. Why?
It had nothing to do with the black Mormons. It had to do with NPR. I thought: they’re only interested in Mormons so they can find some new way to talk about American racism.
It feels like every time I get in the car and turn on the radio, I don’t have to wait long before I hear a story that highlights in some new way what a racist country America is, or how hard illegal immigrants have it in America, or how put-upon sexual minorities are, and so forth. I don’t know if NPR’s liberalism has always been like this, or if it has gotten worse — or if I have simply become thin-skinned about these issues. I have always known NPR was liberal, but that didn’t stop me from being a big fan, and even a contributing member. I feel that my NPR — the NPR that I cherished, even though it was liberal and I am conservative — has gone away, and I don’t know why. I used to love listening to it in the car, and not conservative talk radio, because I don’t want to have a voice on the radio rubbing my nose into some political narrative. NPR used to stand out because it proposed new ways of seeing the world, or at least ways that seemed new to me as a conservative. Now listening to NPR is giving oneself over to hosts who seek to impose a worldview that constantly says, about people who don’t fit the progressive narrative, that you aren’t worthy of our consideration or attention. That you are what’s wrong with America.
I don’t mean to beat up NPR alone. I have the same experience reading The New York Times. Most conservatives I know don’t listen to NPR or read the Times, and could not care less about them. They assume that NPR and the NYT hate them, so they have no agony over failed expectations. But I have been listening to NPR and reading the NYT long enough to know that something has changed with those two institutions — again, institutions that I’ve always known were liberal, but loved anyway. If I had never learned to care about them, I wouldn’t get so wound up about it now.
That, and the fact that those institutions are such important bellwethers of elite opinion. You may not care what’s in the Times or on NPR, but the people who do are those who ultimately control a lot of things in your life. Never, ever forget the lessons in these two passages from Live Not By Lies:
It’s possible to missthe onslaught of totalitarianism, precisely because we have a misunderstanding of how its power works. In 1951, poet and literary critic Czesław Miłosz, exiled to the West from his native Poland as an anti-communist dissident, wrote that Western people misunderstand the nature of communism because they think of it only in terms of “might and coercion.”
“That is wrong,” he wrote. “There is an internal longing for harmony and happiness that lies deeper than ordinary fear or the desire to escape misery or physical destruction.”
In The Captive Mind, Miłosz said that communist ideology filled a void that had opened in the lives of early twentieth-century intellectuals, most of whom had ceased to believe in religion.
This is why NPR sounds like Vatican Radio from the Church of Secular Progressivism, and this is why The New York Times reads like L’Osservatore Romano of the same pseudo-religion. More from Live Not By Lies:
In our populist era, politicians and talk-radio polemicists can rile up a crowd by denouncing elites. Nevertheless, in most societies, intellectual and cultural elites determine its long-term direction. “[T]he key actor in history is not individual genius but rather the network and the new institutions that are created out of those networks,” writes sociologist James Davison Hunter.
Though a revolutionary idea might emerge from the masses, says Hunter, “it does not gain traction until it is embraced and propagated by elites” working through their “well-developed networks and powerful institutions.”
This is why it is critically important to keep an eye on intellectual discourse. Those who do not will leave the gates unguarded. As the Polish dissident and émigré Czesław Miłosz put it, “It was only toward the middle of the twentieth century that the inhabitants of many European countries came, in general unpleasantly, to the realization that their fate could be influenced directly by intricate and abstruse books of philosophy.”
This is how Your Working Boy gets from, “Black Mormons — hey, that’s interesting. I’d like to know more about what they went through” — which would be my stance in normal times — to “Black Mormons? Just one more NPR story about what a racist, oppressive, worthless country this is” to
“NPR continues to tell the elites a narrative that they will use to tear this country down and rebuild it according to their ideological values.”
All of that is prelude to Douglas Murray’s recent piece in Unherd, in which he observes that America really does look like a country that is coming apart, because it lacks a shared story. Excerpts:
But while it’s certainly arguable that Trump has aggravated America’s problems and divisions, he certainly didn’t create them. The divide long pre-dates him and has grown and grown in recent years, to the point where the different parties look increasingly irreconcilable. That is because these divisions go right to the core of what it means to be American.
When Eric Kaufmann recently carried out opinion polls on self-described “liberals” in the US, the results were startling but not surprising. For instance, around 80% of respondents said that they would approve of the writing of a new American constitution “that better reflects our diversity as a people”. A similar number said that they would approve of a new national anthem and flag, for the same reason.
And over the last few months, some of the more activist section of the American “liberal” tribe have taken matters into their own hands, with statues pulled down across the country, not just of Confederate generals or people associated with the divisive elements of American history, but men who once united the American public. Who once represented and defined their shared history as a great nation.
When statues of Thomas Jefferson and George Washington are pulled down, this no longer looks like a critique of certain aspects of American culture: it looks like an attack on the American Founding story. When senior Democrats like Tammy Duckworth — who has served in her country’s military — refuse to condemn attacks on statues of the Founding Fathers it becomes clear that this attitude is not confined to some street-protest fringes.
More:
It is becoming harder to communicate across the gulf, as, increasingly, the two Americas cannot consort or discuss with each other. And if there is one reason above all why that should be the case it is because they no longer have a shared story.
A portion of the American people still revere their history, the Founding Fathers, the constitution, flag, anthem and much more. They see it as symbols of a glorious past, a country which has fought for its own and others’ liberty, and the once-admired idea of American exceptionalism.
Another portion believe that America is exceptional only in being exceptionally bad. Rather than thinking well of their country or their forebears they see the whole American experiment as unusually unfair and uncommonly unequal.
What’s more, I am associated, via my writing here and in The Benedict Option, with a pessimistic view of our liberal democracy’s sustainability. I think that Patrick Deneen is basically correct in his Why Liberalism Failed: it failed because it succeeded so very well in creating a hyper-individualist society.
Liberal democracy cannot work without a metastory to set its boundaries.
We had that story when America was more or less Christian, but we are now moving out of the secularized Christianity of the Enlightenment, and into Nietzsche’s dark prophecy of what would happen once we realized that we have killed God. There will be no clinging to Christian morality, with its claims of human rights, without the Christian god.
What we have, with the woke, is a pseudo-religion that tries to ape Christianity without Christianity’s sense of mercy, and without its tragic awareness that, in Solzhenitsyn’s memorable phrase, the line between good and evil passes not between peoples, classes, and nations, but down the middle of every human heart.
The most basic thing one needs to know about a democratic regime, then, is this: You need to have at least two legitimate political parties for democracy to work. By a legitimate political party, I mean one that is recognized by its rivals as having a right to rule if it wins an election. For example, a liberal party may grant legitimacy to a conservative party (even though they don’t like them much), and in return this conservative party may grant legitimacy to a liberal party (even though they don’t like them much). Indeed, this is the way most modern democratic nations have been governed.
But legitimacy is one of those traditional political concepts that Marxist criticism is now on the verge of destroying.
From the Marxist point of view, our inherited concept of legitimacy is nothing more than an instrument the ruling classes use to perpetuate injustice and oppression. The word legitimacy takes on its true meaning only with reference to the oppressed classes or groups that the Marxist sees as the sole legitimate rulers of the nation. In other words, Marxist political theory confers legitimacy on only one political party—the party of the oppressed, whose aim is the revolutionary reconstitution of society. And this means that the Marxist political framework cannot co-exist with democratic government. Indeed, the entire purpose of democratic government, with its plurality of legitimate parties, is to avoid the violent reconstitution of society that Marxist political theory regards as the only reasonable aim of politics.
Simply put, the Marxist framework and democratic political theory are opposed to one another in principle.
Background from a previous post, American Soviet Mentality
Izabella Tabarovsky draws on her experience of Soviet Russia to expose the cultural revolution currently attacking the roots of American civil society. Her article at the Tablet is The American Soviet Mentality. Excerpts in italics with my bolds.
Collective demonization invades our culture
Russians are fond of quoting Sergei Dovlatov, a dissident Soviet writer who emigrated to the United States in 1979: “We continuously curse Comrade Stalin, and, naturally, with good reason. And yet I want to ask: who wrote four million denunciations?” It wasn’t the fearsome heads of Soviet secret police who did that, he said. It was ordinary people.
Collective demonizations of prominent cultural figures were an integral part of the Soviet culture of denunciation that pervaded every workplace and apartment building. Perhaps the most famous such episode began on Oct. 23, 1958, when the Nobel committee informed Soviet writer Boris Pasternak that he had been selected for the Nobel Prize in literature—and plunged the writer’s life into hell. Ever since Pasternak’s Doctor Zhivago had been first published the previous year (in Italy, since the writer could not publish it at home) the Communist Party and the Soviet literary establishment had their knives out for him. To the establishment, the Nobel Prize added insult to grave injury.
None of those who joined the chorus of condemnation, naturally, had read the novel—it would not be formally published in the USSR until 30 years later. But that did not stop them from mouthing the made-up charges leveled against the writer. It was during that campaign that the Soviet catchphrase “ne chital, no osuzhdayu”—“didn’t read, but disapprove”—was born: Pasternak’s accusers had coined it to protect themselves against suspicions of having come in contact with the seditious material. Days after accepting the Nobel Prize, Pasternak was forced to decline it. Yet demonization continued unabated.
Some of the greatest names in Soviet culture became targets of collective condemnations—composers Dmitry Shostakovich and Sergei Prokofiev; writers Anna Akhmatova and Iosif Brodsky; and many others. Bouts of hounding could go on for months and years, destroying people’s lives, health and, undoubtedly, ability to create. (The brutal onslaught undermined Pasternak’s health. He died from lung cancer a year and a half later.) But the practice wasn’t reserved for the greats alone. Factories, universities, schools, and research institutes were all suitable venues for collectively raking over the coals a hapless, ideologically ungrounded colleague who, say, failed to show up for the “voluntary-obligatory,” as a Soviet cliché went, Saturday cleanups at a local park, or a scientist who wanted to emigrate. The system also demanded expressions of collective condemnations with regards to various political matters: machinations of imperialism and reactionary forces, Israeli aggression against peaceful Arab states, the anti-Soviet international Zionist conspiracy. It was simply part of life.
Twitter has been used as a platform for exercises in unanimous condemnation for as long as it has existed.
Countless careers and lives have been ruined as outraged mobs have descended on people whose social media gaffes or old teenage behavior were held up to public scorn and judged to be deplorable and unforgivable. But it wasn’t until the past couple of weeks that the similarity of our current culture with the Soviet practice of collective hounding presented itself to me with such stark clarity. Perhaps it was the specific professions and the cultural institutions involved—and the specific acts of writers banding together to abuse and cancel their colleagues—that brought that sordid history back.
On June 3, The New York Times published an opinion piece that much of its progressive staff found offensive and dangerous. (The author, Republican Sen. Tom Cotton, had called to send in the military to curb the violence and looting that accompanied the nationwide protests against the killing of George Floyd.) The targets of their unanimous condemnation, which was gleefully joined by the Twitter proletariat, which took pleasure in helping the once-august newspaper shred itself to pieces in public, were New York Times’ opinion section editor James Bennet, who had ultimate authority for publishing the piece, though he hadn’t supervised its editing, and op-ed staff editor and writer Bari Weiss (a former Tablet staffer).
Weiss had nothing to do with editing or publishing the piece. On June 4, however, she posted a Twitter thread characterizing the internal turmoil at the Times as a “civil war” between the “(mostly young) wokes” who “call themselves liberals and progressives” and the “(mostly 40+) liberals” who adhere to “the principles of civil libertarianism.” She attributed the behavior of the “wokes” to their “safetyism” worldview, in which “the right of people to feel emotionally and psychologically safe trumps what were previously considered core liberal values, like free speech.” See Update: Stories vs. Facts
It was just one journalist’s opinion, but to Weiss’ colleagues her semi-unflattering description of the split felt like an intolerable attack against the collective. Although Weiss did not name anyone in either the “woke” or the older “liberal” camp, her younger colleagues felt collectively attacked and slandered. They lashed out. Pretty soon, Weiss was trending on Twitter.
As the mob’s fury kicked into high gear, the language of collective outrage grew increasingly strident, even violent.
Goldie Taylor, writer and editor-at-large at The Daily Beast, queried in a since-deleted tweet why Weiss “still got her teeth.” With heads rolling at the Times—James Bennet resigned, and deputy editorial page editor James Dao was reassigned to the newsroom—one member of the staff asked for Weiss to be fired for having bad-mouthed “her younger newsroom colleagues” and insulted “all of our foreign correspondents who have actually reported from civil wars.” (It was unclear how she did that, other than having used the phrase “civil war” as a metaphor.)
Mehdi Hasan, a columnist with the Intercept, opined to his 880,000 Twitter followers that it would be strange if Weiss retained her job now that Bennet had been removed. He suggested that her thread had “mocked” her nonwhite colleagues. (It did not.) In a follow-up tweet Hasan went further, suggesting that to defend Weiss would make one a bad anti-racist—a threat based on a deeply manipulated interpretation of Weiss’ post, yet powerful enough to stop his followers from making the mistake.
All of us who came out of the Soviet system bear scars of the practice of unanimous condemnation, whether we ourselves had been targets or participants in it or not. It is partly why Soviet immigrants are often so averse to any expressions of collectivism: We have seen its ugliest expressions in our own lives and our friends’ and families’ lives. It is impossible to read the chastising remarks of Soviet writers, for whom Pasternak had been a friend and a mentor, without a sense of deep shame. Shame over the perfidy and lack of decency on display. Shame at the misrepresentations and perversions of truth. Shame at the virtue signaling and the closing of rank. Shame over the momentary and, we now know, fleeting triumph of mediocrity over talent.
In a collectivist culture, one hoped-for result of group condemnations is control—both over the target of abuse and the broader society. When sufficiently broad levels of society realize that the price of nonconformity is being publicly humiliated, expelled from the community of “people of goodwill” (another Soviet cliché) and cut off from sources of income, the powers that be need to work less hard to enforce the rules.
For the regular people—those outside prestigious cultural institutions—participation in local versions of collective hounding was not without its benefits, either. It could be an opportunity to eliminate a personal enemy or someone who was more successful and, perhaps, occupied a position you craved. You could join in condemning a neighbor at your cramped communal flat, calculating that once she was gone, you could add some precious extra square meters to your living space.
The mobs that perform the unanimous condemnation rituals of today do not follow orders from above. But that does not diminish their power to exert pressure on those under their influence.
Those of us who came out of the collectivist Soviet culture understand these dynamics instinctively. You invoked the “didn’t read, but disapprove” mantra not only to protect yourself from suspicions about your reading choices but also to communicate an eagerness to be part of the kollektiv—no matter what destructive action was next on the kollektiv’s agenda. You preemptively surrendered your personal agency in order to be in unison with the group. And this is understandable in a way: Merging with the crowd feels much better than standing alone.
Americans have discovered the way in which fear of collective disapproval breeds self-censorship and silence, which impoverish public life and creative work. The double life one ends up leading—one where there is a growing gap between one’s public and private selves—eventually begins to feel oppressive. For a significant portion of Soviet intelligentsia (artists, doctors, scientists), the burden of leading this double life played an important role in their deciding to emigrate.
Those who join in the hounding face their own hazards. The more loyalty you pledge to a group that expects you to participate in rituals of collective demonization, the more it will ask of you and the more you, too, will feel controlled. How much of your own autonomy as a thinking, feeling person are you willing to sacrifice to the collective? What inner compromises are you willing to make for the sake of being part of the group? Which personal relationships are you willing to give up?
From my vantage point, this cultural moment in these United States feels incredibly precarious.
The practice of collective condemnation feels like an assertion of a culture that ultimately tramples on the individual and creates an oppressive society. Whether that society looks like Soviet Russia, or Orwell’s Nineteen Eighty-Four, or Castro’s Cuba, or today’s China, or something uniquely 21st-century American, the failure of institutions and individuals to stand up to mob rule is no longer an option we can afford.
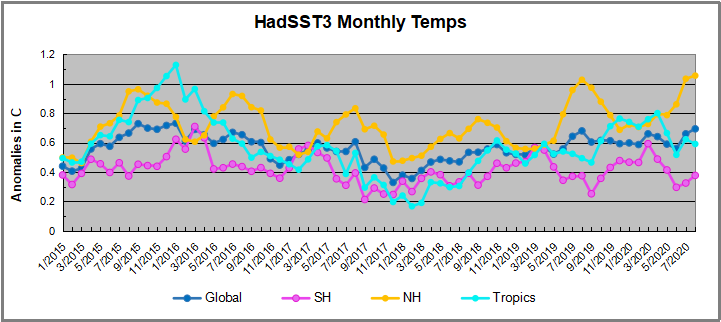
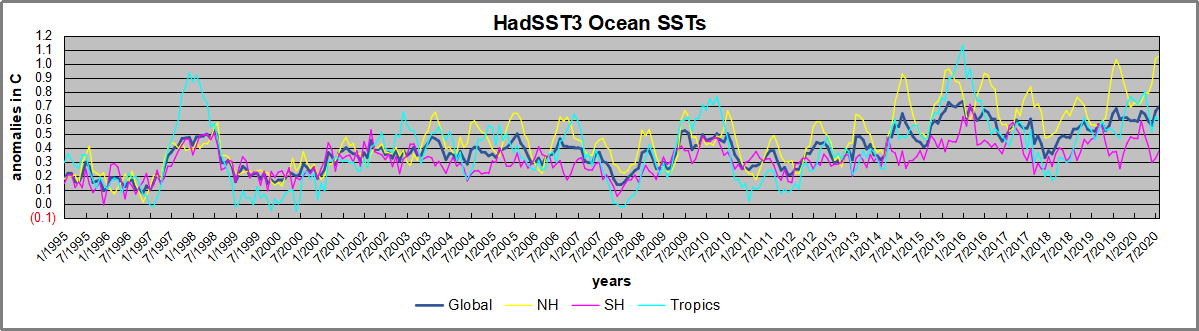
Hot, Hot, Hot. You will have noticed that the term “climate change” is now synonymous with “summer”. Since the northern hemisphere is where most of the world’s land, people and media are located, two typical summer months (June was not so hot) have been depicted as the fires of hell awaiting any and all who benefit from fossil fuels. If you were wondering what the media would do, apart from obsessing over the many small storms this year, you are getting the answer.
Fortunately, Autumn is on the way and already bringing cooler evenings in Montreal where I live. Once again open windows provide fresh air for sleeping, while mornings are showing condensation, and frost sometimes. This year’s period of “climate change” is winding down. Unless of course, we get some hurricanes the next two months. Below is a repost of seasonal changes in temperature and climate for those who may have been misled by the media reports of a forever hotter future.
[Note: The text below refers to human migratory behavior now prohibited because, well Coronavirus.]
Autumnal Climate Change
Seeing a lot more of this lately, along with hearing the geese honking. And in the next month or so, we expect that trees around here will lose their leaves. It definitely is climate change of the seasonal variety.
Interestingly, the science on this is settled: It is all due to reduction of solar energy because of the shorter length of days (LOD). The trees drop their leaves and go dormant because of less sunlight, not because of lower temperatures. The latter is an effect, not the cause.
Of course, the farther north you go, the more remarkable the seasonal climate change. St. Petersburg, Russia has their balmy “White Nights” in June when twilight is as dark as it gets, followed by the cold, dark winter and a chance to see the Northern Lights.
And as we have been monitoring, the Arctic ice has been melting from sunlight in recent months, but is already building again in the twilight, to reach its maximum in March under the cover of darkness.
We can also expect in January and February for another migration of millions of Canadians (nicknamed “snowbirds”) to fly south in search of a summer-like climate to renew their memories and hopes. As was said to me by one man in Saskatchewan (part of the Canadian wheat breadbasket region): “Around here we have Triple-A farmers: April to August, and then Arizona.” Here’s what he was talking about: Quartzsite Arizona annually hosts 1.5M visitors, mostly between November and March.
Of course, this is just North America. Similar migrations occur in Europe, and in the Southern Hemisphere, the climates are changing in the opposite direction, Springtime currently. Since it is so obviously the sun causing this seasonal change, the question arises: Does the sunlight vary on longer than annual timescales?
The Solar-Climate Debate
And therein lies a great, enduring controversy between those (like the IPCC) who dismiss the sun as a driver of multi-Decadal climate change, and those who see a connection between solar cycles and Earth’s climate history. One side can be accused of ignoring the sun because of a prior commitment to CO2 as the climate “control knob”.
The other side is repeatedly denounced as “cyclomaniacs” in search of curve-fitting patterns to prove one or another thesis. It is also argued that a claim of 60-year cycles can not be validated with only 150 years or so of reliable data. That point has weight, but it is usually made by those on the CO2 bandwagon despite temperature and CO2 trends correlating for only 2 decades during the last century.
One scientist in this field is Nicola Scafetta, who presents the basic concept this way:
“The theory is very simple in words. The solar system is characterized by a set of specific gravitational oscillations due to the fact that the planets are moving around the sun. Everything in the solar system tends to synchronize to these frequencies beginning with the sun itself. The oscillating sun then causes equivalent cycles in the climate system. Also the moon acts on the climate system with its own harmonics. In conclusion we have a climate system that is mostly made of a set of complex cycles that mirror astronomical cycles. Consequently it is possible to use these harmonics to both approximately hindcast and forecast the harmonic component of the climate, at least on a global scale. This theory is supported by strong empirical evidences using the available solar and climatic data.”
He goes on to say:
“The global surface temperature record appears to be made of natural specific oscillations with a likely solar/astronomical origin plus a noncyclical anthropogenic contribution during the last decades. Indeed, because the boundary condition of the climate system is regulated also by astronomical harmonic forcings, the astronomical frequencies need to be part of the climate signal in the same way the tidal oscillations are regulated by soli-lunar harmonics.”
He has concluded that “at least 60% of the warming of the Earth observed since 1970 appears to be induced by natural cycles which are present in the solar system.” For the near future he predicts a stabilization of global temperature and cooling until 2030-2040.
A Deeper, but Accessible Presentation of Solar-Climate Theory
I have found this presentation by Ian Wilson to be persuasive while honestly considering all of the complexities involved.
The author raises the question: What if there is a third factor that not only drives the variations in solar activity that we see on the Sun but also drives the changes that we see in climate here on the Earth?
The linked article is quite readable by a general audience, and comes to a similar conclusion as Scafetta above: There is a connection, but it is not simple cause and effect. And yes, length of day (LOD) is a factor beyond the annual cycle.
It is fair to say that we are still at the theorizing stage of understanding a solar connection to earth’s climate. And at this stage, investigators look for correlations in the data and propose theories (explanations) for what mechanisms are at work. Interestingly, despite the lack of interest from the IPCC, solar and climate variability is a very active research field these days.
For example Svensmark has now a Cosmosclimatology theory supported by empirical studies described in more detail in the red link.
Once again, it appears that the world is more complicated than a simple cause and effect model suggests.
Fluctuations in observed global temperatures can be explained by a combination of oceanic and solar cycles. See engineering analysis from first principles Quantifying Natural Climate Change.
For everything there is a season, a time for every purpose under heaven.
What has been will be again, what has been done will be done again;
there is nothing new under the sun. (Ecclesiastes 3:1 and 1:9)
A transition to renewables sent energy prices soaring, pushed thousands into poverty and fueled a populist backlash.
In February 2009, Ontario passed its Green Energy Act (GEA). It was signed a week after Obama’s Economic Recovery and Reinvestment Act in the US, following several months of slow and arduous negotiations. It also had grand plans to start a ‘green’ recovery following the financial crash – although on a more modest scale.
This was the plan: increased integration of wind and solar energy into Ontario’s electricity grid would shut down coal plants and create 50,000 green jobs in the first three years alone.
Additionally, First Nations communities would manage their own electricity supply and distribution – what observers would later call the ‘decolonisation’ of energy – empowering Canada’s indigenous communities who had been disenfranchised by historical trauma. Lawmakers promised that clean and sustainable energy provided by renewables would also reduce costs for poorer citizens. This won an endorsement from Ontario’s Low Income Energy Network – a group which campaigns for universal access to affordable energy.
But on 1 January, 2019, Ontario repealed the GEA, one month before its 10th anniversary. The 50,000 guaranteed jobs never materialised. The ‘decolonisation’ of energy didn’t work out, either. A third of indigenous Ontarians now live in energy poverty. Ontarians watched in dismay as their electricity bills more than doubled during the life of the GEA. Their electricity costs are now among the highest in North America.
To understand how the GEA went irreparably wrong, we must look at Ontario’s contracts with its green-energy suppliers. Today, Ontario’s contracts guarantee to electricity suppliers that they ‘will be paid for each kWh of electricity generated from the renewable energy project’, regardless of whether this electricity is consumed. As preposterous as this may seem, it’s actually an improvement on many of the original contracts the Ontario government locked itself into.
Earlier contracts guaranteed payments that benchmarked close to 100 per cent of the supplier’s capacity, rather than the electricity generated. So if a participating producer supplied only 33 per cent of its capacity in a given year, the state would still pay it as if it had produced 100 per cent.
This was especially alarming in context, as 97 per cent of the applicants to the GEA programme were using wind or solar energy. These are both intermittent forms of energy. In an hour, day or month with little wind or sun, wind and solar farms can’t supply the grid with electricity, and other sources are needed for back-up. As a result, wind and solar electricity providers can only supplement the grid but cannot replace consistently reliable power plants like gas or nuclear.
Many governments, including other Canadian provinces, have used subsidies of all hues to incentivise renewables. But Ontario put this strategy on steroids. For example, the Council for Clean and Reliable Energy found that ‘in 2015, Ontario’s wind farms operated at less than one-third capacity more than half (58 per cent) the time’. Regardless, Ontarians paid multiple contracts as if wind farms had operated at full capacity all year round. To add insult to injury, Ontario’s GEA contracts guaranteed exorbitant prices for renewable energy – often at up to 40 times the cost of conventional power for 20 years.
By 2015, Ontario’s auditor general, Bonnie Lysyk, concluded that citizens had paid ‘a total of $37 billion’ above the market rate for energy. They were even ‘expected to pay another $133 billion from 2015 to 2032’, again, ‘on top of market valuations’. (One steelmaker has taken the Ontarian government to court for these exorbitant energy costs.)
Today, this problem persists. Furthermore, electricity demand from ratepayers declined between 2011 and 2015, and has continued to fall. Ontarians were forced to pay higher prices for new electricity capacity, even as their consumption was going down.
Ontario’s auditor general in 2015 stated that: ‘The implied cost of using non-hydro renewables to reduce carbon emissions in the electricity sector was quite high: approximately $257 million [£150million] for each megatonne of emissions reduced.’ Per tonne of carbon reduced, the Ontario scheme has cost 48 per cent more than Sweden’s carbon tax – the most expensive carbon tax in the world.
Clearly, bad policy has led to exorbitant waste. This wasn’t the result of corruption or conspiracy – it was sheer incompetence. It’s a meandering story of confusion and gross policy blunders that will fuel energy poverty in Ontario for at least another decade.
As democracies across the West respond to the coronavirus crisis with hastily prepared financial packages for a ‘green recovery’, they should consider the cautionary tale of Ontario.
The GEA’s stubborn defenders refuse to recognise that poor policy, even with the best intentions, discredits future efforts at cutting emissions. ‘Green New Deals’ for the post-pandemic recovery in the US and Europe should learn from the GEA. Clean energy at any cost will be rightfully short-lived and repealed, and its supporters will be unceremoniously booted out of power.
Elevated ‘cycle thresholds’ may be detecting virus long after it is past the point of infection.
A growing body of research suggests that a significant number of confirmed COVID-19 infections in the U.S. — perhaps as many as 9 out of every 10 — may not be infectious at all, with much of the country’s testing equipment possibly picking up mere fragments of the disease rather than full-blown infections.
Yet a burgeoning line of scientific inquiry suggests that many confirmed infections of COVID-19 may actually be just residual traces of the virus itself, a contention that — if true — may suggest both that current high levels of positive viruses are clinically insignificant and that the mitigation measures used to suppress them may be excessive.
Background from previous post: New Better and Faster Covid Test
Kevin Pham reports on a breakthrough in coronavirus testing. Excerpts in italics with my bolds.
Another new test for COVID-19 was recently authorized — and this one could be a game-changer.
The Abbot Diagnostics BinaxNOW antigen test is a new point-of-care test that reportedly costs only $5 to administer, delivers results in as little as 15 minutes, and requires no laboratory equipment to perform. That means it can be used in clinics far from commercial labs or without relying on a nearby hospital lab.
That last factor is key. There are other quick COVID-19 tests on the market, but they have all required lab equipment that can be expensive to maintain and operate, and costs can be prohibitive in places that need tests most.
This kind of test is reminiscent of rapid flu tests that are ubiquitous in clinics. They’ll give providers tremendous flexibility in testing for the disease in not just clinics, but with trained and licensed medical professionals, in schools, workplaces, camps, or any other number of places.
So what’s new about this test? Most of the current tests detect viral RNA, the genetic material of SARS-CoV-2. This is a very accurate way of detecting the virus, but it requires lab equipment to break apart the virus and amplify the amount of genetic material to high enough levels for detection.
The BinaxNOW test detects antigens — proteins unique to the virus that are usually detectable whenever there is an active infection.
Abbott says it intends to produce 50 million tests per month starting in October. That’s far more than the number tested in July, when we were breaking new testing records on a daily basis with approximately 23 million tests recorded.
There’s a more important reason to be encouraged by this test coming available. The viral load is not amplified by the test, so a positive is actually a person needing isolation and treatment. As explained in a previous post below, the PCR tests used up to now clutter up the record by showing as positive people with viral loads too low to be sick or to infect others.
Background from Previous Post The Truth About CV Tests
The peoples’ instincts are right, though they have been kept in the dark about this “pandemic” that isn’t. Responsible citizens are starting to act out their outrage from being victimized by a medical-industrial complex (to update Eisenhower’s warning decades ago). The truth is, governments are not justified to take away inalienable rights to life, liberty and the pursuit of happiness. There are several layers of disinformation involved in scaring the public. This post digs into the CV tests, and why the results don’t mean what the media and officials claim.
For months now, I have been updating the progress in Canada of the CV outbreak. A previous post later on goes into the details of extracting data on tests, persons testing positive (termed “cases” without regard for illness symptoms) and deaths after testing positive. Currently, the contagion looks like this.
The graph shows that deaths are less than 5 a day, compared to a daily death rate of 906 in Canada from all causes. Also significant is the positivity ratio: the % of persons testing positive out of all persons tested each day. That % has been fairly steady for months now: 1% positive means 99% of people are not infected. And this is despite more than doubling the rate of testing.
But what does testing positive actually mean? Herein lies more truth that has been hidden from the public for the sake of an agenda to control free movement and activity. Background context comes from Could Rapid Coronavirus Testing Help Life Return To Normal?, an interview at On Point with Dr. Michael Mina. Excerpts in italics with my bolds. H/T Kip Hansen
A sign displays a new rapid coronavirus test on the new Abbott ID Now machine at a ProHEALTH center in Brooklyn on August 27, 2020 in New York City. (Spencer Platt/Getty Images)
Dr. Michael Mina:
COVID tests can actually be put onto a piece of paper, very much like a pregnancy test. In fact, it’s almost exactly like a pregnancy test. But instead of looking for the hormones that tell if somebody is pregnant, it looks for the virus proteins that are part of SA’s code to virus. And it would be very simple: You’d either swab the front of your nose or you’d take some saliva from under your tongue, for example, and put it onto one of these paper strips, essentially. And if you see a line, it means you’re positive. And if you see no line, it means you are negative, at least for having a high viral load that could be transmissible to other people.
An antigen is one of the proteins in the virus. And so unlike the PCR test, which is what most people who have received a test today have generally received a PCR test. And looking those types of tests look for the genome of the virus to RNA and you could think of RNA the same way that humans have DNA. This virus has RNA. But instead of looking for RNA like the PCR test, these antigen tests look for pieces of the protein. It would be like if I wanted a test to tell me, you know, that somebody was an individual, it would actually look for features like their eyes or their nose. And in this case, it is looking for different parts of the virus. In general, the spike protein or the nuclear capsid, these are two parts of the virus.
The reason that these antigen tests are going to be a little bit less sensitive to detect the virus molecules is because there’s no step that we call an amplification step. One of the things that makes the PCR test that looks for the virus RNA so powerful is that it can take just one molecule, which the sensor on the machine might not be able to detect readily, but then it amplifies that molecule millions and millions of times so that the sensor can see it. These antigen tests, because they’re so simple and so easy to use and just happen on a piece of paper, they don’t have that amplification step right now. And so they require a larger amount of virus in order to be able to detect it. And that’s why I like to think of these types of tests having their primary advantage to detect people with enough virus that they might be transmitting or transmissible to other people.”
Similar PCR tests for other viruses nearly always offer some measure of the amount of virus. But yes/no isn’t good enough, Mina added. “It’s the amount of virus that should dictate the infected patient’s next steps. “It’s really irresponsible, I think, to [ignore this]” Dr. Mina said, of how contagious an infected patient may be.
“We’ve been using one type of data for everything,” Mina said. “for [diagnosing patients], for public health, and for policy decision-making.”
The PCR test amplifies genetic matter from the virus in cycles; the fewer cycles required, the greater the amount of virus, or viral load, in the sample. The greater the viral load, the more likely the patient is to be contagious.
This number of amplification cycles needed to find the virus, called the cycle threshold, is never included in the results sent to doctors and coronavirus patients, although if it was, it could give them an idea of how infectious the patients are.
One solution would be to adjust the cycle threshold used now to decide that a patient is infected. Most tests set the limit at 40, a few at 37. This means that you are positive for the coronavirus if the test process required up to 40 cycles, or 37, to detect the virus.
Any test with a cycle threshold above 35 is too sensitive, Juliet Morrison, a virologist at the University of California, Riverside told the New York Times. “I’m shocked that people would think that 40 could represent a positive,” she said.
A more reasonable cutoff would be 30 to 35, she added. Dr. Mina said he would set the figure at 30, or even less.
Another solution, researchers agree, is to use even more widespread use of Rapid Diagnostic Tests (RDTs) which are much less sensitive and more likely to identify only patients with high levels of virus who are a transmission risk.
Comment: In other words, when they analyzed the tests that also reported cycle threshold (CT), they found that 85 to 90 percent were above 30. According to Dr. Mina a CT of 37 is 100 times too sensitive (7 cycles too much, 2^7 = 128) and a CT of 40 is 1,000 times too sensitive (10 cycles too much, 2^10 = 1024). Based on their sample of tests that also reported CT, as few as 10 percent of people with positive PCR tests actually have an active COVID-19 infection. Which is a lot less than reported.
Here is a graph showing how this applies to Canada.
It is evident that increased testing has resulted in more positives, while the positivity rate is unchanged. Doubling the tests has doubled the positives, up from 300 a day to nearly 600 a day presently. Note these are PCR results. And the discussion above suggests that the number of persons with an active infectious viral load is likely 10% of those reported positive: IOW up from 30 a day to 60 a day. And in the graph below, the total of actual cases in Canada is likely on the order of 13,000 total from the last 7 months, an average of 62 cases a day.
WuFlu Exposes a Fundamental Flaw in US Health System
Dr. Mina goes on to explain what went wrong in US response to WuFlu:
In the U.S, we have a major focus on clinical medicine, and we have undervalued and underfunded the whole concept of public health for a very long time. We saw an example of this for, for example, when we tried to get the state laboratories across the country to be able to perform the PCR tests back in March, February and March, we very quickly realized that our public health infrastructure in this country just wasn’t up to the task. We had very few labs that were really able to do enough testing to just meet the clinical demands. And so such a reduced focus on public health for so long has led to an ecosystem where our regulatory agencies, this being primarily the FDA, has a mandate to approve clinical medical diagnostic tests. But there’s actually no regulatory pathway that is available or exists — and in many ways, we don’t even have a language for it — for a test whose primary purpose is one of public health and not personal medical health
That’s really caused a problem. And a lot of times, it’s interesting if you think about the United States, every single test that we get, with the exception maybe of a pregnancy test, has to go through a physician. And so that’s a symptom of a country that has focused, and a society really, that has focused so heavily on the medical industrial complex. And I’m part of that as a physician. But I also am part of the public health complex as an epidemiologist. And I see that sometimes these are at odds with each other, medicine and public health. And this is an example where because all of our regulatory infrastructure is so focused on medical devices… If you’re a public health person, you can actually have a huge amount of leeway in how your tests are working and still be able to get epidemics under control. And so there’s a real tension here between the regulations that would be required for these types of tests versus a medical diagnostic test.
Footnote: I don’t think the Chinese leaders were focusing on the systemic weakness Dr. MIna mentions. But you do have to bow to the inscrutable cleverness of the Chinese Communists releasing WuFlu as a means to set internal turmoil within democratic capitalist societies. On one side are profit-seeking Big Pharma, aided and abetted by Big Media using fear to attract audiences for advertising revenues. The panicked public demands protection which clueless government provides by shutting down the service and manufacturing industries, as well as throwing money around and taking on enormous debt. The world just became China’s oyster.
Background from Previous Post: Covid Burnout in Canada August 28
The map shows that in Canada 9108 deaths have been attributed to Covid19, meaning people who died having tested positive for SARS CV2 virus. This number accumulated over a period of 210 days starting January 31. The daily death rate reached a peak of 177 on May 6, 2020, and is down to 6 as of yesterday. More details on this below, but first the summary picture. (Note: 2019 is the latest demographic report)
Canada Pop
Ann Deaths
Daily Deaths
Risk per Person
2019
37589262
330786
906
0.8800%
Covid 2020
37589262
9108
43
0.0242%
Over the epidemic months, the average Covid daily death rate amounted to 5% of the All Causes death rate. During this time a Canadian had an average risk of 1 in 5000 of dying with SARS CV2 versus a 1 in 114 chance of dying regardless of that infection. As shown later below the risk varied greatly with age, much lower for younger, healthier people.
Background Updated from Previous Post
In reporting on Covid19 pandemic, governments have provided information intended to frighten the public into compliance with orders constraining freedom of movement and activity. For example, the above map of the Canadian experience is all cumulative, and the curve will continue upward as long as cases can be found and deaths attributed. As shown below, we can work around this myopia by calculating the daily differentials, and then averaging newly reported cases and deaths by seven days to smooth out lumps in the data processing by institutions.
A second major deficiency is lack of reporting of recoveries, including people infected and not requiring hospitalization or, in many cases, without professional diagnosis or treatment. The only recoveries presently to be found are limited statistics on patients released from hospital. The only way to get at the scale of recoveries is to subtract deaths from cases, considering survivors to be in recovery or cured. Comparing such numbers involves the delay between infection, symptoms and death. Herein lies another issue of terminology: a positive test for the SARS CV2 virus is reported as a case of the disease COVID19. In fact, an unknown number of people have been infected without symptoms, and many with very mild discomfort.
August 7 in the UK it was reported (here) that around 10% of coronavirus deaths recorded in England – almost 4,200 – could be wiped from official records due to an error in counting. Last month, Health Secretary Matt Hancock ordered a review into the way the daily death count was calculated in England citing a possible ‘statistical flaw’. Academics found that Public Health England’s statistics included everyone who had died after testing positive – even if the death occurred naturally or in a freak accident, and after the person had recovered from the virus. Numbers will now be reconfigured, counting deaths if a person died within 28 days of testing positive much like Scotland and Northern Ireland…
Professor Heneghan, director of the Centre for Evidence-Based Medicine at Oxford University, who first noticed the error, told the Sun:
‘It is a sensible decision. There is no point attributing deaths to Covid-19 28 days after infection…
For this discussion let’s assume that anyone reported as dying from COVD19 tested positive for the virus at some point prior. From the reasoning above let us assume that 28 days after testing positive for the virus, survivors can be considered recoveries.
Recoveries are calculated as cases minus deaths with a lag of 28 days. Daily cases and deaths are averages of the seven days ending on the stated date. Recoveries are # of cases from 28 days earlier minus # of daily deaths on the stated date. Since both testing and reports of Covid deaths were sketchy in the beginning, this graph begins with daily deaths as of April 24, 2020 compared to cases reported on March 27, 2020.
The line shows the Positivity metric for Canada starting at nearly 8% for new cases April 24, 2020. That is, for the 7 day period ending April 24, there were a daily average of 21,772 tests and 1715 new cases reported. Since then the rate of new cases has dropped down, now holding steady at ~1% since mid-June. Yesterday, the daily average number of tests was 45,897 with 427 new cases. So despite more than doubling the testing, the positivity rate is not climbing. Another view of the data is shown below.
The scale of testing has increased and now averages over 45,000 a day, while positive tests (cases) are hovering at 1% positivity. The shape of the recovery curve resembles the case curve lagged by 28 days, since death rates are a small portion of cases. The recovery rate has grown from 83% to 99% steady over the last 2 weeks, so that recoveries exceed new positives. This approximation surely understates the number of those infected with SAR CV2 who are healthy afterwards, since antibody studies show infection rates multiples higher than confirmed positive tests (8 times higher in Canada). In absolute terms, cases are now down to 427 a day and deaths 6 a day, while estimates of recoveries are 437 a day.
The key numbers:
99% of those tested are not infected with SARS CV2.
99% of those who are infected recover without dying.
Summary of Canada Covid Epidemic
It took a lot of work, but I was able to produce something akin to the Dutch advice to their citizens.
The media and governmental reports focus on total accumulated numbers which are big enough to scare people to do as they are told. In the absence of contextual comparisons, citizens have difficulty answering the main (perhaps only) question on their minds: What are my chances of catching Covid19 and dying from it?
A previous post reported that the Netherlands parliament was provided with the type of guidance everyone wants to see.
The table presents only those cases with a full clinical documentation, which included some 2194 deaths compared to the 5842 total reported. The numbers show that under 60 years old, few adults and almost no children have anything to fear.
Update May 20, 2020
It is really quite difficult to find cases and deaths broken down by age groups. For Canadian national statistics, I resorted to a report from Ontario to get the age distributions, since that province provides 69% of the cases outside of Quebec and 87% of the deaths. Applying those proportions across Canada results in this table. For Canada as a whole nation:
Age
Risk of Test +
Risk of Death
Population per 1 CV death
<20
0.05%
None
NA
20-39
0.20%
0.000%
431817
40-59
0.25%
0.002%
42273
60-79
0.20%
0.020%
4984
80+
0.76%
0.251%
398
In the worst case, if you are a Canadian aged more than 80 years, you have a 1 in 400 chance of dying from Covid19. If you are 60 to 80 years old, your odds are 1 in 5000. Younger than that, it’s only slightly higher than winning (or in this case, losing the lottery).
As noted above Quebec provides the bulk of cases and deaths in Canada, and also reports age distribution more precisely, The numbers in the table below show risks for Quebecers.
Age
Risk of Test +
Risk of Death
Population per 1 CV death
0-9 yrs
0.13%
0
NA
10-19 yrs
0.21%
0
NA
20-29 yrs
0.50%
0.000%
289,647
30-39
0.51%
0.001%
152,009
40-49 years
0.63%
0.001%
73,342
50-59 years
0.53%
0.005%
21,087
60-69 years
0.37%
0.021%
4,778
70-79 years
0.52%
0.094%
1,069
80-89
1.78%
0.469%
213
90 +
5.19%
1.608%
62
While some of the risk factors are higher in the viral hotspot of Quebec, it is still the case that under 80 years of age, your chances of dying from Covid 19 are better than 1 in 1000, and much better the younger you are.
Four Years In The Making, But The Same Failed Arguments
Back in 2016, Tong’s predecessor, former Attorney General George Jespen, enlisted Connecticut to take part in former New York Attorney General’s Eric Schneiderman’s “AGs United for Clean Power” – a coalition of state attorneys general that aimed to investigate major energy companies over climate change. Not only did Jepsen participate in the March 2016 press conference announcing the coalition, he discussed how it’s formation allowed for easier collaboration between attorneys general.
While the coalition ultimately fell apart, following the withdrawal of several attorneys general and scrutiny over the political motivation behind its formation, the group’s demise (and even New York’s unsuccessful lawsuit) hasn’t stopped Tong. In fact, he’s using many of the same arguments that Schneiderman ineffectively deployed nearly five years ago.
In Monday’s press conference announcing the Connecticut lawsuit, AG Tong said:
“We tried to think long and hard about what our best and most impactful contribution would be. And what we settled on was a single defendant with a very simple claim: Exxon knew, and they lied.” (emphasis added)
Apparently Tong did not get the memo that “Exxon Knew” – the theory pushed by activists and lawyers that the company knew about climate change and hid that knowledge from the public – has been completely debunked. It was this theory that Schneiderman initially built his case against the company around, but he was forced to abandon it because the facts were not on his side. Indeed, after his successor was told to told “to put or shut up” on the accusations, the lawsuit was revised to remove these claims and instead focus on alleged accounting fraud. The case resulted in a resounding defeat for the New York attorney general, with State Supreme Court Justice Barry Ostrager calling the lawsuit “hyperbolic” and “without merit.”
The only other two climate lawsuits that have been decided on their merits were filed by San Francisco and Oakland and then New York City, both of which failed.
Connecticut Has Benefitted From The National Campaign
The Connecticut lawsuit isn’t a standalone effort, but part of a larger national campaign supported and funded by activist and wealthy donors to pursue climate litigation against energy companies.
Tong is still pursing the “Exxon Knew” angle that’s been developed by this campaign despite its previous losses and thinks his lawsuit is the strongest in the nation because Connecticut’s Connecticut Unfair Trade Practices Act doesn’t have a statute of limitations, allowing him to recall ExxonMobil documents from decades ago – even though the company already turned over 3 million documents as part of the New York Attorney General’s failed investigation.
Connecticut was also mentioned in the Pay Up Climate Polluters report, “Climate Costs 2040,” which seems to be a target list of cities to carry out potential litigation, as recent plaintiffs Hoboken, N.J. and Charleston, S.C. were also featured. Pay Up Climate Polluters is a campaign that promotes climate litigation that is sponsored by Center for Climate Integrity, which in turn is a project of Institute for Governance and Sustainable Development (IGSD), which, ironically enough, is paying for the outside counsel in Hoboken’s lawsuit.
IGSD also receives money from a network of Rockefeller groups, which with the help of wealthy donors and activists, have manufactured the entire climate litigation campaign. Tong even filed an amicus brief in support of the climate lawsuit filed by San Francisco and Oakland.
During his press conference, Tong even thanked 350.org and The Sunrise Movement, two other Rockefeller-supported groups that support and actively promote climate litigation.
Conclusion
The lawsuit filed by the Connecticut Attorney General is just the latest case to emerge in the broader, national campaign being pushed by weather donors and activist groups. But while a new lawsuit generates new headlines, it does nothing to change the fact that it’s based on another rehashing of the debunked “Exxon Knew” theory that failed in New York and will do nothing to address climate change.
Background from Previous Post: Climate Lawsuit Dominos
Climate change activists went to court in California recently trying to halt a long losing streak in their quest to punish energy companies for aiding and abetting the world’s consumption of fossil fuels.
A handful of California cities — big consumers of fossil fuels themselves — asked the U.S. Court of Appeals for the Ninth Circuit to reverse the predictable dismissal of their public nuisance lawsuit seeking to pin the entire blame for global warming on five energy producers: BP, Chevron, ConocoPhillips, ExxonMobil and Royal Dutch Shell.
The cities hope to soak the companies for billions of dollars of damages, which they claim they’ll use to build sea walls, better sewer systems and the like in anticipation of rising seas and extreme weather that might result from climate change.
But no plaintiff has ever succeeded in bringing a public nuisance lawsuit based on climate change.
To the contrary, these lawsuits are beginning to collapse like dominoes as courts remind the plaintiffs that it is the legislative and executive branches — not the judicial branch — that have the authority and expertise to determine climate policy.
Climate change activists should have gotten the message in 2011 when the Supreme Court ruled against eight states and other plaintiffs who brought nuisance claims for the greenhouse gas emissions producedby electric power plants.
The Court ruled unanimously in American Electric Power v. Connecticut that the federal Clean Air Act, under which such emissions are subject to EPA regulation, preempts such lawsuits.
The Justices emphasized that “Congress designated an expert agency, here, EPA … [that] is surely better equipped to do the job than individual district judges issuing ad hoc, case-by-case injunctions” and better able to weigh “the environmental benefit potentially achievable [against] our Nation’s energy needs and the possibility of economic disruption.”
The Court noted that this was true of “questions of national or international policy” in general, reminding us why the larger trend of misusing public nuisance lawsuits is a problem.
The California cities, led by Oakland and San Francisco, tried to get around this Supreme Court precedent by focusing on the international nature of the emissions at issue.
But that approach backfired in 2018 when federal district judge William Alsup concluded that a worldwide problem “deserves a solution on a more vast scale than can be supplied by a district judge or jury in a public nuisance case.” Alsup, a liberal Clinton appointee, noted that “Without [fossil] fuels, virtually all of our monumental progress would have been impossible.”
In July 2018, a federal judge in Manhattan tossed out a nearly identical lawsuit by New York City on the same grounds. The city is appealing.
Meanwhile, climate lawfare is also being waged against energy companies by Rhode Island and a number of municipal governments, including Baltimore. Like the other failed cases, these governments seek billions of dollars.
Adding to the string of defeats was the Ninth Circuit’s rejection last month of the so-called “children’s” climate suit, which took a somewhat different approach by pitting a bunch of child plaintiffs against the federal government.
The children alleged “psychological harms, others impairment to recreational interests, others exacerbated medical conditions, and others damage to property” and sought an injunction forcing the executive branch to phase out fossil fuel emissions.
Judge Andrew Hurwitz, an Obama appointee, wrote for the majority that “such relief is beyond our constitutional power.” The case for redress, he said, “must be presented to the political branches of government.”
Yet another creative, if disingenuous, litigation strategy was attempted by New York State’s attorney general, who sued ExxonMobil for allegedly deceiving investors about the impact of future climate change regulations on profits by keeping two sets of books.
That lawsuit went down in flames in December when a New York court ruled that the state failed to prove any “material misstatements” to investors.
All these lawsuits fail because they are grounded in politics, virtue signaling and — in most cases — the hope of collecting billions from energy producers, rather than in sound legal theories or a genuine strategy for fighting climate change.
But in the unlikely event these plaintiffs prevail, would they use their billion dollar windfalls to help society cope with global warming?
It’s unlikely if past history is any indication.
State and local governments that have won large damage awards in successful non-climate-related public nuisance lawsuits — tobacco litigation is the most famous example — have notoriously blown most of the money on spending binges unrelated to the original lawsuit or on backfilling irresponsible budget deficits.
The question of what would happen to the award money will likely remain academic. Even sympathetic judges have repeatedly refused to be roped by weak public nuisance or other contorted legal theories into addressing a national or international policy issue — climate change — that is clearly better left to elected officials.
Like anything built on an unsound foundation, these climate lawsuits will continue to collapse.
Curt Levey is a constitutional law attorney and president of the Committee for Justice, a nonprofit organization dedicated to preserving the rule of law.
Honolulu city officials, lashing out at the fossil fuel industry in a climate change lawsuit filed Monday, accused oil producers of concealing the dangers that greenhouse gas emissions from petroleum products would create, while reaping billions in profits.
The lawsuit, against eight oil companies, says climate change already is having damaging effects on the city’s coastline, and lays out a litany of catastrophic public nuisances—including sea level rise, heat waves, flooding and drought caused by the burning of fossil fuels—that are costing the city billions, and putting its residents and property at risk.
“We are seeing in real time coastal erosion and the consequences,” Josh Stanbro, chief resilience officer and executive director for the City and County of Honolulu Office of Climate Change,Sustainability and Resiliency, told InsideClimate News. “It’s an existential threat for what the future looks like for islanders.” [ I wonder if Stanbro’s salary matches the length of his job title, or if it is contingent on winning the case.]
A virologist who fled China after studying the early outbreak of COVID-19 has published a new report claiming the coronavirus likely came from a lab. This adds to the analysis done by Dr. Luc Montagnier earlier this year, and summarized in a previous post reprinted later on. Dr. Yan was interviewed on Fox News, and YouTube has now blocked the video.
If you are wondering why Big Tech is censoring information unflattering to China, see Lee Smith’s Tablet article America’s China Class Launches a New War Against Trump The corporate, tech, and media elites will not allow the president to come between them and Chinese money
Doctor Li-Meng Yan, a scientist who studied some of the available data on COVID-19 has published her claims on Zenodo, an open access digital platform. She wrote that she believed COVID-19 could have been “conveniently created” within a lab setting over a period of just six months, and “SARS-CoV-2 shows biological characteristics that are inconsistent with a naturally occurring, zoonotic virus”.
The natural origin theory, although widely accepted, lacks substantial support. The alternative theory that the virus may have come from a research laboratory is, however, strictly censored on peer-reviewed scientific journals. Nonetheless, SARS-CoV-2 shows biological characteristics that are inconsistent with a naturally occurring, zoonotic virus. In this report, we describe the genomic, structural, medical, and literature evidence, which, when considered together, strongly contradicts the natural origin theory.
The evidence shows that SARS-CoV-2 should be a laboratory product created by using bat coronaviruses ZC45 and/or ZXC21 as a template and/or backbone.
Contents
Consistent with this notion, genomic, structural, and literature evidence also suggest a non-natural origin of SARS-CoV-2. In addition, abundant literature indicates that gain-of-function research has long advanced to the stage where viral genomes can be precisely engineered and manipulated to enable the creation of novel coronaviruses possessing unique properties. In this report, we present such evidence and the associated analyses.
Part 1 of the report describes the genomic and structural features of SARS-CoV-2, the presence of which could be consistent with the theory that the virus is a product of laboratory modification beyond what could be afforded by simple serial viral passage. Part 2 of the report describes a highly probable pathway for the laboratory creation of SARS-CoV-2, key steps of which are supported by evidence present in the viral genome. Importantly, part 2 should be viewed as a demonstration of how SARS-CoV-2 could be conveniently created in a laboratory in a short period of time using available materials and well-documented techniques. This report is produced by a team of experienced scientists using our combined expertise in virology, molecular biology, structural biology, computational biology, vaccine development, and medicine.
We present three lines of evidence to support our contention that laboratory manipulation is part of the history of SARS-CoV-2:
i. The genomic sequence of SARS-CoV-2 is suspiciously similar to that of a bat coronavirus discovered by military laboratories in the Third Military Medical University (Chongqing, China) and the Research Institute for Medicine of Nanjing Command (Nanjing, China).
ii. The receptor-binding motif (RBM) within the Spike protein of SARS-CoV-2, which determines the host specificity of the virus, resembles that of SARS-CoV from the 2003 epidemic in a suspicious manner. Genomic evidence suggests that the RBM has been genetically manipulated.
iii. SARS-CoV-2 contains a unique furin-cleavage site in its Spike protein, which is known to greatly enhance viral infectivity and cell tropism. Yet, this cleavage site is completely absent in this particular class of coronaviruses found in nature. In addition, rare codons associated with this additional sequence suggest the strong possibility that this furin-cleavage site is not the product of natural evolution and could have been inserted into the SARS-CoV-2 genome artificially by techniques other than simple serial passage or multi-strain recombination events inside co-infected tissue cultures or animals.
Background from Previous post June 30, 2020: Pandemic Update: Virus Weaker, HCQ Stronger
In past weeks there have been anecdotal reports from frontline doctors that patients who would have been flattened fighting off SARS CV2 in April are now sitting up and recovering in a few days. We have also the statistical evidence in the US and Sweden, as two examples, that case numbers are rising while Covid deaths continue declining. One explanation is that the new cases are younger people who have been released from lockdown (in US) with stronger immune systems. But it may also be that the virus itself is losing potency.
Contrary to the narrative that is being pushed by the mainstream that the COVID 19 virus was the result of a natural mutation and that it was transmitted to humans from bats via pangolins, Dr Luc Montagnier the man who discovered the HIV virus back in 1983 disagrees and is saying that the virus was man made.
Professor Luc Montagnier, 2008 Nobel Prize winner for Medicine, claims that SARS-CoV-2 is a manipulated virus that was accidentally released from a laboratory in Wuhan, China. Chinese researchers are said to have used coronaviruses in their work to develop an AIDS vaccine. HIV RNA fragments are believed to have been found in the SARS-CoV-2 genome.
“With my colleague, bio-mathematician Jean-Claude Perez, we carefully analyzed the description of the genome of this RNA virus,” explains Luc Montagnier, interviewed by Dr Jean-François Lemoine for the daily podcast at Pourquoi Docteur, adding that others have already explored this avenue: Indian researchers have already tried to publish the results of the analyses that showed that this coronavirus genome contained sequences of another virus, … the HIV virus (AIDS virus), but they were forced to withdraw their findings as the pressure from the mainstream was too great.
To insert an HIV sequence into this genome requires molecular tools
In a challenging question Dr Jean-François Lemoine inferred that the coronavirus under investigation may have come from a patient who is otherwise infected with HIV. No, “says Luc Montagnier,” in order to insert an HIV sequence into this genome, molecular tools are needed, and that can only be done in a laboratory.
According to the 2008 Nobel Prize for Medicine, a plausible explanation would be an accident in the Wuhan laboratory. He also added that the purpose of this work was the search for an AIDS vaccine.
In any case, this thesis, defended by Professor Luc Montagnier, has a positive turn.
According to him, the altered elements of this virus are eliminated as it spreads: “Nature does not accept any molecular tinkering, it will eliminate these unnatural changes and even if nothing is done, things will get better, but unfortunately after many deaths.”
This is enough to feed some heated debates! So much so that Professor Montagnier’s statements could also place him in the category of “conspiracy theorists”: “Conspirators are the opposite camp, hiding the truth,” he replies, without wanting to accuse anyone, but hoping that the Chinese will admit to what he believes happened in their laboratory.
To entice a confession from the Chinese he used the example of Iran which after taking full responsibility for accidentally hitting a Ukrainian plane was able to earn the respect of the global community. Hopefully the Chinese will do the right thing he adds. “In any case, the truth always comes out, it is up to the Chinese government to take responsibility.”
Implications: Leaving aside the geopolitics, this theory also explains why the virus weakens when mutations lose the unnatural pieces added in the lab. Since this is an RNA (not DNA) sequence mutations are slower, but inevitable. If correct, this theory works against fears of a second wave of infections. It also gives an unintended benefit from past lockdowns and shutdowns, slowing the rate of infections while the virus degrades itself.
The animation above shows Arctic ice extents from Sept. 1 to 16, 2020. On the left are the Russian shelf seas already ice-free, and the Central Arctic retreating as well. Bottom left is Beaufort Sea losing ice. In the last week CAA in the center starts refreezing, and just above it Baffin Bay starts to add ice back. At the top right Greenland Sea starts to refreeze.
Prof. Peter Wadhams made multiple predictions of an ice-free Arctic (extent as low as 1M km2), most recently to happen in 2015. Thus was born the metric: 1 Wadham = 1M km2 Arctic ice extent. The details are provided on 2020 minimum below. Though there could be a dip lower in the next few days, the record shows a daily minimum of 3.7M km2 on September 11 (MASIE) and September 13 (SII). While BCE (Beaufort, Chukchi, East Siberian seas) may lose more ice, gains have appeared on the Canadian side: CAA, Baffin Bay and Greenland Sea. So 3.7 Wadhams may well hold up as the daily low this year. Note that day 260, September 16, 2020, is the date for the lowest annual extent averaged over the last 13-years.
The discussion later on refers to the September monthly average extent serving as the usual climate metric. That stands presently at 3.9M km2 for MASIE and 3.8M km2 for SII, with both expected to rise slightly by month end as ice extent typically recovers.
The melting season this year showed ice extents briefly near the 13-year average on day 241, then dropping rapidly to go below all other years except 2012. That year was exceptional due to the 2012 Great Arctic August Cyclone that pushed drift ice around producing a new record minimum. The anomaly this year was the high pressure ridge persisting over Siberia producing an extremely hot summer there. This resulted in early melting of the Russian shelf seas along with bordering parts of the Central Arctic.
As discussed below, the daily minimum on average occurs on day 260, but a given year may be earlier or later. The 2020 extent began to flatten from day 248 onward in SII (orange) while MASIE showed stabilizing from day 252 with an upward bump in recent days. Both lines are drawing near 2019 and 2007 while departing from 2012. The table below shows the distribution of ice in the various regions of the Arctic Ocean.
Region
2020260
Day 260 Average
2020-Ave.
2012260
2020-2012
(0) Northern_Hemisphere
3770950
4483942
-712991
3398785
372165
(1) Beaufort_Sea
503701
471897
31804
214206
289495
(2) Chukchi_Sea
49625
143329
-93704
52708
-3084
(3) East_Siberian_Sea
97749
278150
-180400
47293
50456
(4) Laptev_Sea
0
124811
-124811
21509
-21509
(5) Kara_Sea
12670
19162
-6492
0
12670
(6) Barents_Sea
0
20787
-20787
0
0
(7) Greenland_Sea
258624
191964
66660
253368
5256
(8) Baffin_Bay_Gulf_of_St._Lawrence
20839
31394
-10555
12695
8144
(9) Canadian_Archipelago
328324
269950
58374
154875
173449
(10) Hudson_Bay
104
6195
-6092
3863
-3759
(11) Central_Arctic
2498209
2925271
-427062
2637199
-138990
The extent numbers show that this year’s melt is dominated by the surprisingly hot Siberian summer, leading to major deficits in all the Eurasian shelf seas–East Siberian, Laptev, Kara. As well, the bordering parts of the Central Arctic show a sizeable deficit to average. The main surpluses to average and to 2012 are Beaufort, Greenland Sea and CAA. Overall 2020 is 713k km2 below the 13-year average a deficit of 16%.
Background from Previous Post Outlook for Arctic Ice Minimum
The annual competition between ice and water in the Arctic ocean is approaching the maximum for water, which typically occurs mid September. After that, diminishing energy from the slowly setting sun allows oceanic cooling causing ice to regenerate. Those interested in the dynamics of Arctic sea ice can read numerous posts here. Note that for climate purposes the annual minimum is measured by the September monthly average ice extent, since the daily extents vary and will go briefly lower on or about day 260.
The Bigger Picture
We are close to the annual Arctic ice extent minimum, which typically occurs on or about day 260 (mid September). Some take any year’s slightly lower minimum as proof that Arctic ice is dying, but the image above shows the Arctic heart is beating clear and strong.
Over this decade, the Arctic ice minimum has not declined, but since 2007 looks like fluctuations around a plateau. By mid-September, all the peripheral seas have turned to water, and the residual ice shows up in a few places. The table below indicates where we can expect to find ice this September. Numbers are area units of Mkm2 (millions of square kilometers).
Day 260
13 year
Arctic Regions
2007
2010
2012
2014
2015
2016
2017
2018
2019
Average
Central Arctic Sea
2.67
3.16
2.64
2.98
2.93
2.92
3.07
2.91
2.97
2.93
BCE
0.50
1.08
0.31
1.38
0.89
0.52
0.84
1.16
0.46
0.89
LKB
0.29
0.24
0.02
0.19
0.05
0.28
0.26
0.02
0.11
0.16
Greenland & CAA
0.56
0.41
0.41
0.55
0.46
0.45
0.52
0.41
0.36
0.46
B&H Bays
0.03
0.03
0.02
0.02
0.10
0.03
0.07
0.05
0.01
0.04
NH Total
4.05
4.91
3.40
5.13
4.44
4.20
4.76
4.56
3.91
4.48
The table includes three early years of note along with the last 6 years compared to the 13 year average for five contiguous arctic regions. BCE (Beaufort, Chukchi and East Siberian) on the Asian side are quite variable as the largest source of ice other than the Central Arctic itself. Greenland Sea and CAA (Canadian Arctic Archipelago) together hold almost 0.5M km2 of ice at annual minimum, fairly consistently. LKB are the European seas of Laptev, Kara and Barents, a smaller source of ice, but a difference maker some years, as Laptev was in 2016. Baffin and Hudson Bays are inconsequential as of day 260.
For context, note that the average maximum has been 15M, so on average the extent shrinks to 30% of the March high before growing back the following winter. In this context, it is foolhardy to project any summer minimum forward to proclaim the end of Arctic ice.
President Trump, accompanied by, from left, Anthony S. Fauci, Vice President Pence and Robert Redfield, reacts to a question during a news conference on the coronavirus in the press briefing room at the White House in Washington on Feb. 29. (Andrew Harnik/AP)
A narrative has taken hold since the release of Bob Woodward’s latest book that President Trump was told in late January that the coronavirus was spreading across America at pandemic rates but ignored the dire warnings of government experts.
That narrative is wrong and unfair.
The truth is that during the crucial early weeks of the pandemic, the government’s public health leaders assured Trump that the virus was not spreading in communities in the United States. They gave him bad intelligence because of two catastrophic failures:First, they relied on the flu surveillance system that failed to detect the rapid spread of covid-19; and second, they bungled the development of a diagnostic test for covid-19 that would have shown they were wrong, barred commercial labs from developing tests, and limited tests to people who had traveled to foreign hot spots or had contact with someone with a confirmed case.
As a result, according to former Food and Drug Administration chief Scott Gottlieb, they were “situationally blind” to the spread of the virus.
In an interview Sunday on CBS News’s “Face the Nation,” Gottlieb said officials at the Department of Health and Human Services “over-relied on a surveillance system that was built for flu and not for coronavirus without recognizing that it wasn’t going to be as sensitive at detecting coronavirus spread as it was for flu because the two viruses spread very differently.” Officials were looking for a spike in patients presenting with flu-like respiratory symptoms at hospitals. But there was a lag of a week or more in reporting data, and because many of those infected with the novel coronavirus didn’t develop symptoms, or did not present with respiratory illness, they were not picked up by this monitoring. As a result, officials concluded “therefore, coronavirus must not be spreading.”
They also failed to detect the spread, Gottlieb said, because for six weeks, they “had no diagnostic tests in the field to screen people.” That is because the FDA and HHS refused to allow private and academic labs to get into the testing game with covid-19 tests of their own. The FDA issued only a single emergency authorization to the Centers for Disease Control and Prevention — and then scientists at the CDC contaminated the only approved test kits with sloppy lab practices, rendering them ineffective. The results were disastrous.
How badly did the system fail? Researchers at the University of Notre Dame found that only 1,514 cases and 39 deaths had been officially reported by early March, when in truth more than 100,000 people were already infected. Because of this failure, Gottlieb said that as covid-19 was spreading, CDC officials were “telling the coronavirus task force … that there was no spread of coronavirus in the United States,” adding “They were adamant.”
It is often noted that on Feb. 25, Nancy Messonnier, director of the CDC’s National Center for Immunization and Respiratory Diseases, pointed to the spread of the virus abroad and said, “It’s not a question of if this will happen but when this will happen and how many people in this country will have severe illnesses” — and Trump reportedly nearly fired her. But Messonnier also said in that same interview, “To date, our containment strategies have been largely successful. As a result, we have very few cases in the United States and no spread in the community.” She added that the administration’s “proactive approach of containment and mitigation will delay the emergence of community spread in the United States while simultaneously reducing its ultimate impact” when it arrives. She had no idea it already had.
On Feb. 20, Gottlieb co-authored a Wall Street Journal op-ed raising concerns that infections were more widespread than CDC numbers showed. The next day, on Feb. 21, Anthony S. Fauci said in a CNBC interview that he was confident this was not the case. “Certainly, it’s a possibility,” Fauci said, “but it is extraordinarily unlikely.” He explained that if there were infected people in the United States who were not identified, isolated and traced, “you would have almost an exponential spread of an infection of which we are all looking out for. We have not seen that, so it is extremely unlikely that it is happening.” Fauci said the “pattern of what we’re seeing argues against infections that we’re missing.”
It was not until Feb. 26 that the first possible case of suspected community spread was reported. Even then, senior health officials played down the danger. On Feb. 29, CDC director Robert Redfield said at a White House press briefing: “The American public needs to go on with their normal lives. Okay? We’re continuing to aggressively investigate these new community links. … But at this stage, again, the risk is low.” It was not until early March that the experts realized just how disastrously wrong they had been.
So, when Trump told the American people on Feb. 25 that “the coronavirus … is very well under control in our country. We have very few people with it,” he was not lying or playing down more dire information he was being told privately. He was repeating exactly what experts such as Fauci, Redfield and Messonnier were telling him.
Trump did make serious errors of his own during this early period. On deputy national security adviser Matthew Pottinger’s advice, he barred travel by non-U.S. citizens from China on Jan. 31. But he did not also shut down travel from much of Europe, as Pottinger recommended, until March 11 — almost six weeks later — because of objections from his economic advisers. The outbreak in New York, the worst of the pandemic, was seeded by travelers from Italy.
But the main reason we were not able to contain the virus is that for six critical weeks, the health experts told the president covid-19 was not spreading in U.S. communities when it was, in fact, spreading like wildfire. They were wrong. The experts failed the president — and the country.
Footnote: For What President Trump has done to fight the Chinese virus, see:
The best context for understanding decadal temperature changes comes from the world’s sea surface temperatures (SST), for several reasons:
The ocean covers 71% of the globe and drives average temperatures;
SSTs have a constant water content, (unlike air temperatures), so give a better reading of heat content variations;
A major El Nino was the dominant climate feature in recent years.
HadSST is generally regarded as the best of the global SST data sets, and so the temperature story here comes from that source, the latest version being HadSST3. More on what distinguishes HadSST3 from other SST products at the end.
The Current Context
The cool 2020 Spring was not just your local experience, it’s the result of Earth’s ocean cooling off after last summer’s warming in the Northern Hemisphere. The chart below shows SST monthly anomalies as reported in HadSST3 starting in 2015 through August 2020. After three straight months of cooling led by the tropics and SH, August anomalies are up slightly.
A global cooling pattern is seen clearly in the Tropics since its peak in 2016, joined by NH and SH cycling downward since 2016. In 2019 all regions had been converging to reach nearly the same value in April.
Then NH rose exceptionally by almost 0.5C over the four summer months, in August exceeding previous summer peaks in NH since 2015. In the 4 succeeding months, that warm NH pulse reversed sharply. Now again NH temps are warming to a 2020 summer peak, matching 2019. This had been offset by sharp cooling in the Tropics and SH, which instead warmed slightly last month. Thus the Global anomaly steadily decreased since March, then rose, now presently matching last summer.
Note that higher temps in 2015 and 2016 were first of all due to a sharp rise in Tropical SST, beginning in March 2015, peaking in January 2016, and steadily declining back below its beginning level. Secondly, the Northern Hemisphere added three bumps on the shoulders of Tropical warming, with peaks in August of each year. A fourth NH bump was lower and peaked in September 2018. As noted above, a fifth peak in August 2019 and a sixth August 2020 exceeded the four previous upward bumps in NH.
And as before, note that the global release of heat was not dramatic, due to the Southern Hemisphere offsetting the Northern one. The major difference between now and 2015-2016 is the absence of Tropical warming driving the SSTs, along with SH anomalies reaching nearly the lowest in this period.
A longer view of SSTs
The graph below is noisy, but the density is needed to see the seasonal patterns in the oceanic fluctuations. Previous posts focused on the rise and fall of the last El Nino starting in 2015. This post adds a longer view, encompassing the significant 1998 El Nino and since. The color schemes are retained for Global, Tropics, NH and SH anomalies. Despite the longer time frame, I have kept the monthly data (rather than yearly averages) because of interesting shifts between January and July.
1995 is a reasonable (ENSO neutral) starting point prior to the first El Nino. The sharp Tropical rise peaking in 1998 is dominant in the record, starting Jan. ’97 to pull up SSTs uniformly before returning to the same level Jan. ’99. For the next 2 years, the Tropics stayed down, and the world’s oceans held steady around 0.2C above 1961 to 1990 average.
Then comes a steady rise over two years to a lesser peak Jan. 2003, but again uniformly pulling all oceans up around 0.4C. Something changes at this point, with more hemispheric divergence than before. Over the 4 years until Jan 2007, the Tropics go through ups and downs, NH a series of ups and SH mostly downs. As a result the Global average fluctuates around that same 0.4C, which also turns out to be the average for the entire record since 1995.
2007 stands out with a sharp drop in temperatures so that Jan.08 matches the low in Jan. ’99, but starting from a lower high. The oceans all decline as well, until temps build peaking in 2010.
Now again a different pattern appears. The Tropics cool sharply to Jan 11, then rise steadily for 4 years to Jan 15, at which point the most recent major El Nino takes off. But this time in contrast to ’97-’99, the Northern Hemisphere produces peaks every summer pulling up the Global average. In fact, these NH peaks appear every July starting in 2003, growing stronger to produce 3 massive highs in 2014, 15 and 16. NH July 2017 was only slightly lower, and a fifth NH peak still lower in Sept. 2018.
The highest summer NH peak came in 2019, only this time the Tropics and SH are offsetting rather adding to the warming. Since 2014 SH has played a moderating role, offsetting the NH warming pulses. Now August 2020 is matching last summer’s unusually high NH SSTs. f(Note: these are high anomalies on top of the highest absolute temps in the NH.)
What to make of all this? The patterns suggest that in addition to El Ninos in the Pacific driving the Tropic SSTs, something else is going on in the NH. The obvious culprit is the North Atlantic, since I have seen this sort of pulsing before. After reading some papers by David Dilley, I confirmed his observation of Atlantic pulses into the Arctic every 8 to 10 years.
But the peaks coming nearly every summer in HadSST require a different picture. Let’s look at August, the hottest month in the North Atlantic from the Kaplan dataset. The AMO Index is from from Kaplan SST v2, the unaltered and not detrended dataset. By definition, the data are monthly average SSTs interpolated to a 5×5 grid over the North Atlantic basically 0 to 70N. The graph shows August warming began after 1992 up to 1998, with a series of matching years since, including 2020. Because the N. Atlantic has partnered with the Pacific ENSO recently, let’s take a closer look at some AMO years in the last 2 decades. This graph shows monthly AMO temps for some important years. The Peak years were 1998, 2010 and 2016, with the latter emphasized as the most recent. The other years show lesser warming, with 2007 emphasized as the coolest in the last 20 years. Note the red 2018 line is at the bottom of all these tracks. The black line shows that 2020 began slightly warm, then set records for 3 months. then dropped below 2016 and 2017, and now is matching 2016.
Summary
The oceans are driving the warming this century. SSTs took a step up with the 1998 El Nino and have stayed there with help from the North Atlantic, and more recently the Pacific northern “Blob.” The ocean surfaces are releasing a lot of energy, warming the air, but eventually will have a cooling effect. The decline after 1937 was rapid by comparison, so one wonders: How long can the oceans keep this up? If the pattern of recent years continues, NH SST anomalies may rise slightly in coming months, but once again, ENSO which has weakened will probably determine the outcome.
Footnote: Why Rely on HadSST3
HadSST3 is distinguished from other SST products because HadCRU (Hadley Climatic Research Unit) does not engage in SST interpolation, i.e. infilling estimated anomalies into grid cells lacking sufficient sampling in a given month. From reading the documentation and from queries to Met Office, this is their procedure.
HadSST3 imports data from gridcells containing ocean, excluding land cells. From past records, they have calculated daily and monthly average readings for each grid cell for the period 1961 to 1990. Those temperatures form the baseline from which anomalies are calculated.
In a given month, each gridcell with sufficient sampling is averaged for the month and then the baseline value for that cell and that month is subtracted, resulting in the monthly anomaly for that cell. All cells with monthly anomalies are averaged to produce global, hemispheric and tropical anomalies for the month, based on the cells in those locations. For example, Tropics averages include ocean grid cells lying between latitudes 20N and 20S.
Gridcells lacking sufficient sampling that month are left out of the averaging, and the uncertainty from such missing data is estimated. IMO that is more reasonable than inventing data to infill. And it seems that the Global Drifter Array displayed in the top image is providing more uniform coverage of the oceans than in the past.
USS Pearl Harbor deploys Global Drifter Buoys in Pacific Ocean


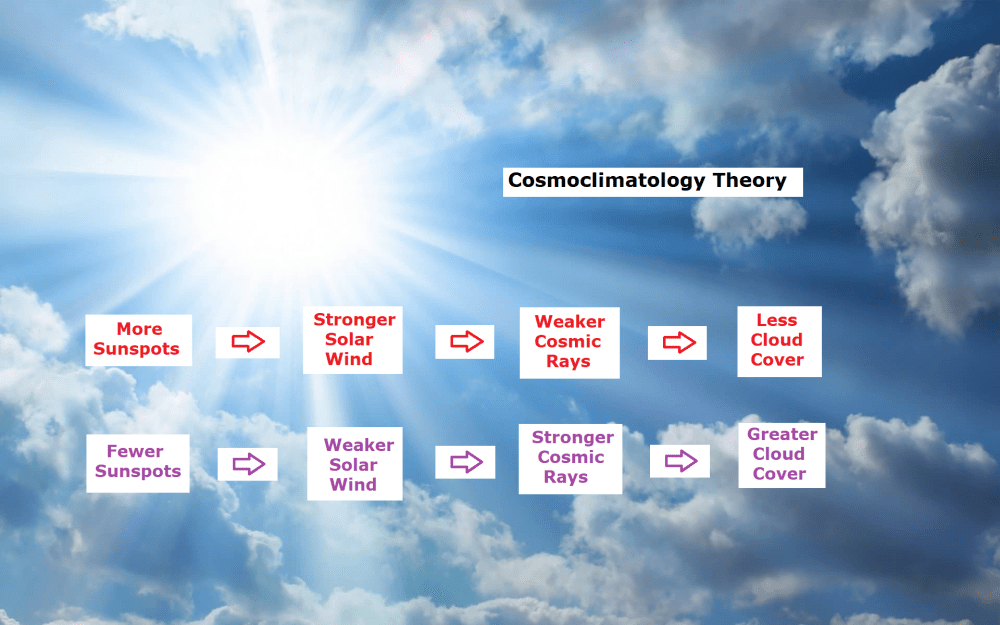

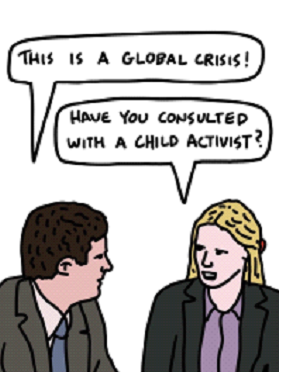


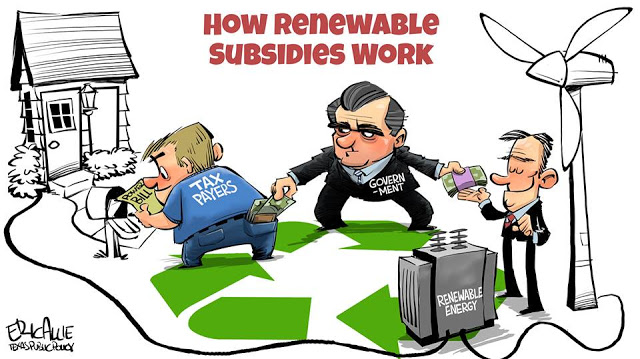


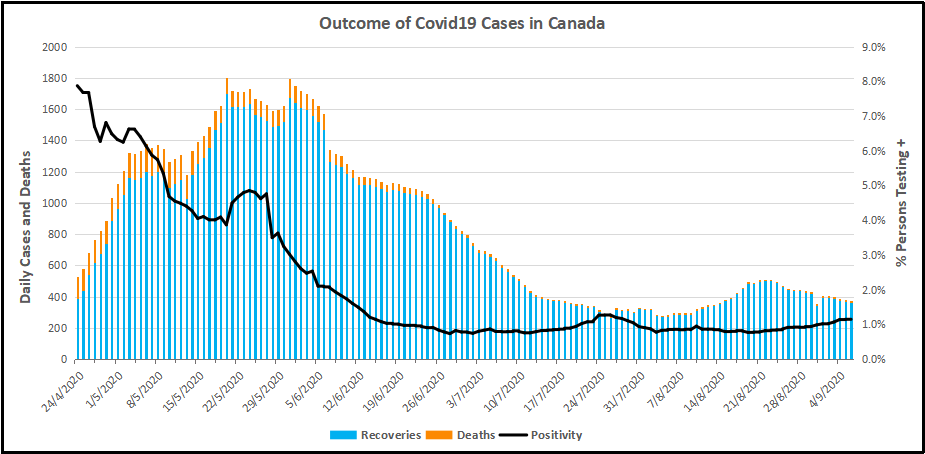

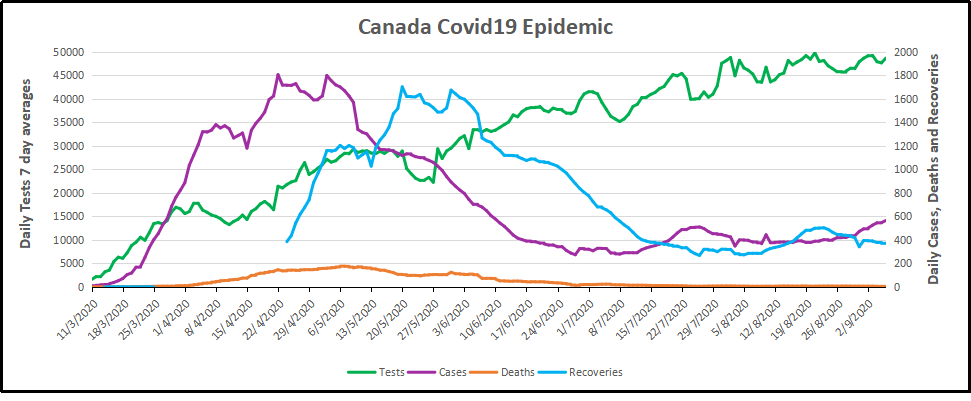
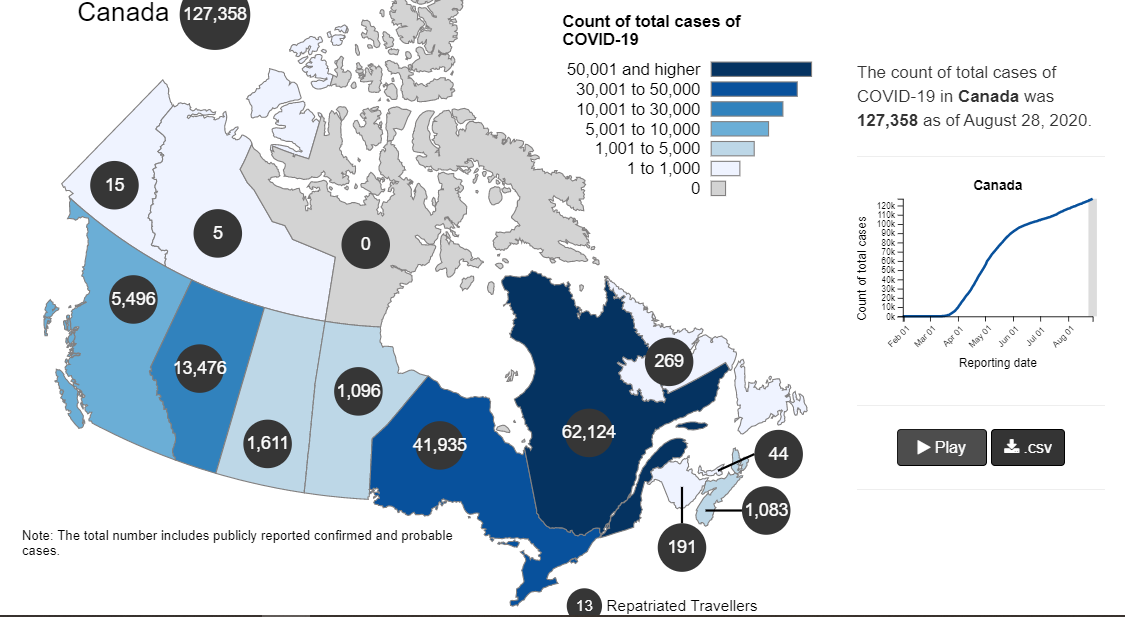
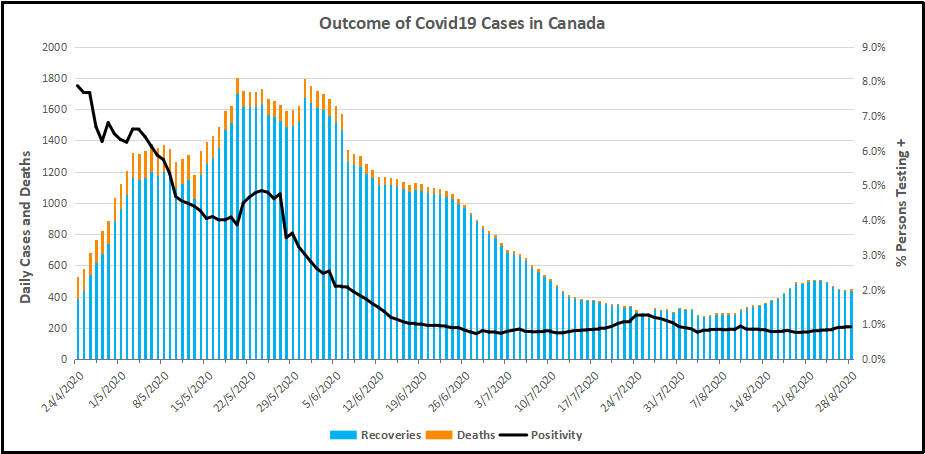
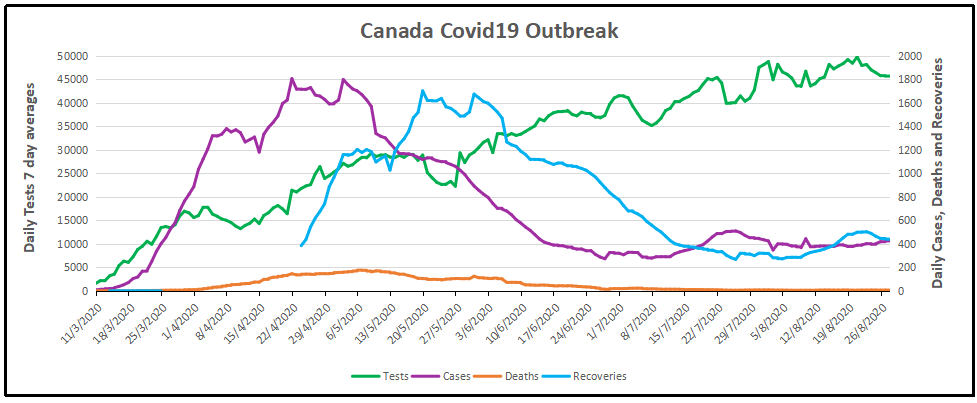


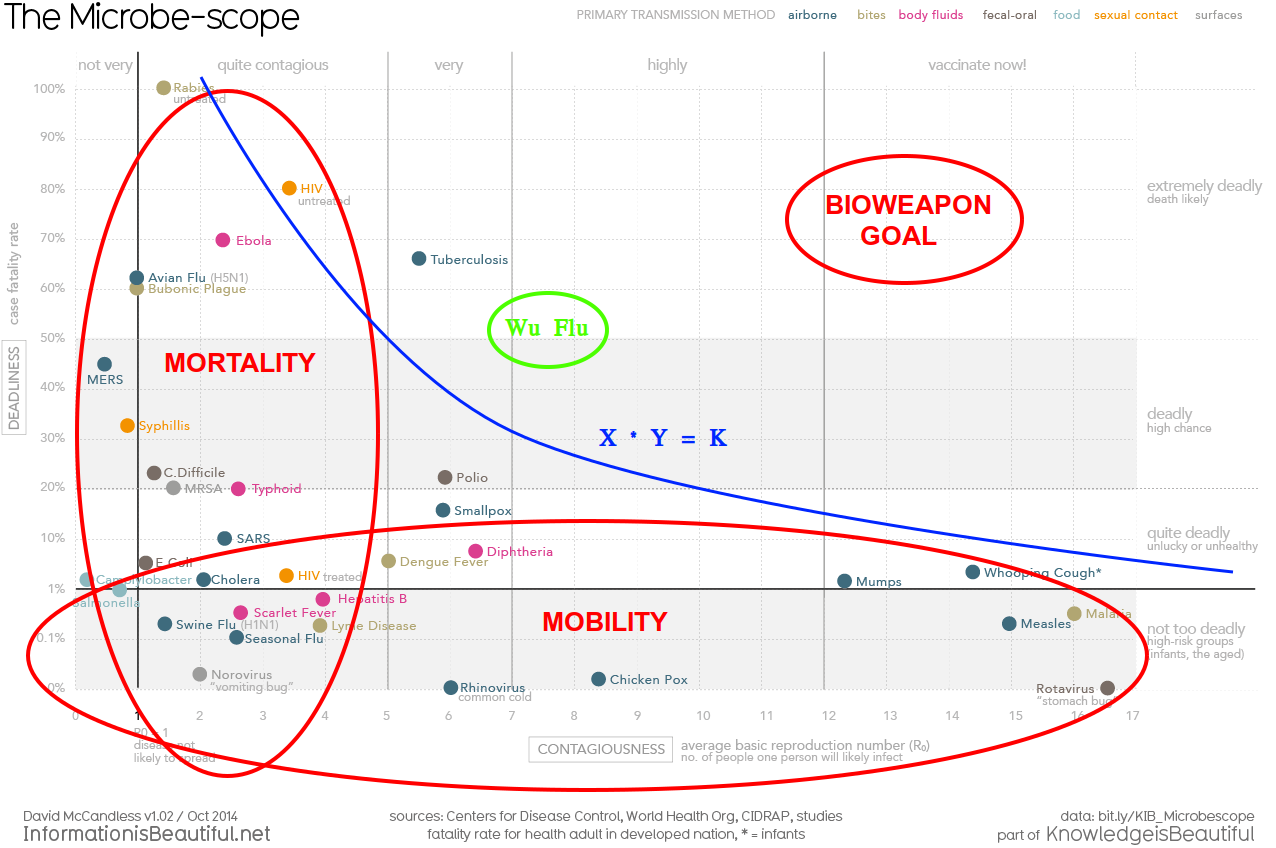


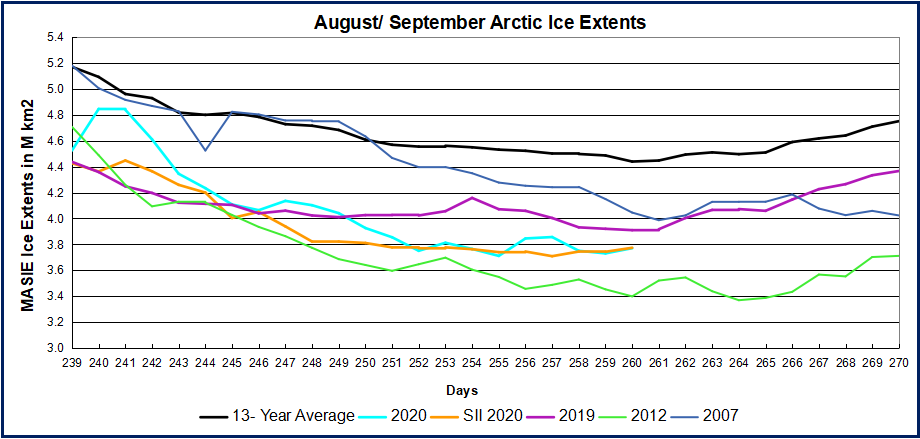


 The best context for understanding decadal temperature changes comes from the world’s sea surface temperatures (SST), for several reasons: