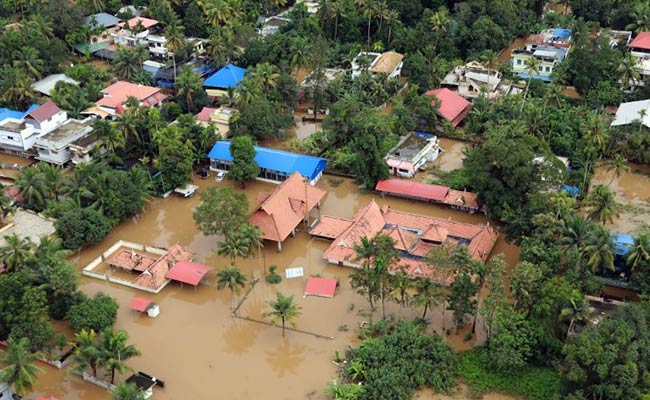
2018 Kerala India Flooding and Rainfall Event
Because of obsession with CO2, flooding in Kerala S. India is the latest example of the desire to pin the blame on “climate change”. Jonathan Eden wrote a balanced article in WION Why it’s so hard to detect the fingerprints of global warming on monsoon rains Excerpts in italics with my bolds.
Unlike temperature, rainfall varies hugely in space and time. Even the most sophisticated climate models struggle to simulate physical processes such as convection and evaporation that drive rainfall activity. On top of that, global warming is not expected to change the frequency and intensity of rainfall extremes in the same way in all parts of the world.
The choice to focus solely on the rainfall itself is particularly relevant for flooding events. Though accusations of poor decision-making and mismanagement of water resources are beginning to appear in the Kerala aftermath, the floods simply would not have occurred without a significant amount of rain. Few of those suffering lost homes and livelihoods are likely to care much about where the rain came from or the intricacies of the weather conditions that led to it.
Disentangling these contributory factors takes time. In comparison to droughts and heatwaves, short-term hazards such as floods do not usually give us much chance to report concrete findings while the media and general public are still engaged in the event. In-depth studies may not publish their results for many months, sometimes even years after the event in question.
Many of these issues are not exclusive to extreme rainfall. The excellent US National Academies report on Attribution of Extreme Weather Events in the Context of Climate Change describes the shortcomings in our efforts to attribute a variety of extremes. But for rainfall in particular there is a discrepancy between what we understand about the general effect of global warming and our rather lesser ability to quantify the climate change fingerprint on specific events.

2017 Hurricane Harvey X-Weathermen Event
With Hurricane Harvey making landfall in Texas as a Cat 4, the storm drought is over and claims of linkage to climate change can be expected. So far (mercifully) articles in Time and Washington Post have been more circumspect than in the past. Has it become more respectable to look at the proof supporting wild claims? This post provides background on X-Weathermen working hard to claim extreme weather as proof of climate change.
In the past the media has been awash with claims of “human footprints” in extreme weather events, with headlines like these:
“Global warming is making hot days hotter, rainfall and flooding heavier, hurricanes stronger and droughts more severe.”
“Global climate change is making weather worse over time”
“Climate change link to extreme weather easier to gauge”– U.S. Report
“Heat Waves, Droughts and Heavy Rain Have Clear Links to Climate Change, Says National Academies”
That last one refers to a paper released by the National Academy of Sciences Press: Attribution of Extreme Weather Events in the Context of Climate Change (2016)
And as usual, the headline claims are unsupported by the actual text. From the NAS report (here): (my bolds)
Attribution studies of individual events should not be used to draw general conclusions about the impact of climate change on extreme events as a whole. Events that have been selected for attribution studies to date are not a representative sample (e.g., events affecting areas with high population and extensive infrastructure will attract the greatest demand for information from stakeholders) P 107
Systematic criteria for selecting events to be analyzed would minimize selection bias and permit systematic evaluation of event attribution performance, which is important for enhancing confidence in attribution results. Studies of a representative sample of extreme events would allow stakeholders to use such studies as a tool for understanding how individual events fit into the broader picture of climate change. P 110
Correctly done, attribution of extreme weather events can provide an additional line of evidence that demonstrates the changing climate, and its impacts and consequences. An accurate scientific understanding of extreme weather event attribution can be an additional piece of evidence needed to inform decisions on climate change related actions. P. 112
The Indicative Without the Imperative

The antidote to such feverish reporting is provided by Mike Hulme in a publication: Attributing Weather Extremes to ‘Climate Change’: a Review (here).
He has an insider’s perspective on this issue, and is certainly among the committed on global warming (color him concerned). Yet here he writes objectively to inform us on X-weather, without advocacy: real science journalism and a public service, really. Excerpts below with my bolds.
Overview
In this third and final review I survey the nascent science of extreme weather event attribution. The article proceeds by examining the field in four stages: motivations for extreme weather attribution, methods of attribution, some example case studies and the politics of weather event Attribution.
The X-Weather Issue
As many climate scientists can attest, following the latest meteorological extreme one of the most frequent questions asked by media journalists and other interested parties is: ‘Was this weather event caused by climate change?’
In recent decades the meaning of climate change in popular western discourse has changed from being a descriptive index of a change in climate (as in ‘evidence that a climatic change has occurred’) to becoming an independent causative agent (as in ‘climate change caused this event to happen’). Rather than being a descriptive outcome of a chain of causal events affecting how weather is generated, climate change has been granted power to change worlds: political and social worlds as much as physical and ecological ones.
To be more precise then, what people mean when they ask the ‘extreme weather blame’ question is: ‘Was this particular weather event caused by greenhouse gases emitted from human activities and/or by other human perturbations to the environment?’ In other words, can this meteorological event be attributed to human agency as opposed to some other form of agency?
The Motivations
Hulme shows what drives scientists to pursue the “extreme weather blame” question, noting four motivational factors.
Why have climate scientists over the last ten years embarked upon research to provide an answer beyond the stock phrase ‘no individual weather event can directly be attributed to greenhouse gas emissions’? There seem to be four possible motives.
1.Curiosity
The first is because the question piques the scientific mind; it acts as a spur to develop new rational understanding of physical processes and new analytic methods for studying them.
2.Adaptation
A second argument, put forward by some, is that it is important to know whether or not specific instances of extreme weather are human-caused in order to improve the justification, planning and execution of climate adaptation.
3.Liability
A third argument for pursuing an answer to the ‘extreme weather blame’ question is inspired by the possibility of pursuing legal liability for damages caused. . . If specific loss and damage from extreme weather can be attributed to greenhouse gas emissions – even if expressed in terms of increased risk rather than deterministically – then lawyers might get interested.
The liability motivation for research into weather event attribution also bisects the new international political agenda of ‘loss and damage’ which has emerged in the last two years. . . The basic idea is to give recognition that loss and damage caused by climate change is legitimate ground for less developed countries to gain access to new international climate adaptation funds.
4. Persuasion
A final reason for scientists to be investing in this area of climate science – a reason stated explicitly less often than the ones above and yet one which underlies much of the public interest in the ‘extreme weather blame’ question – is frustration with and argument about the invisibility of climate change. . . If this is believed to be true – that only scientists can make climate change visible and real –then there is extra onus on scientists to answer the ‘extreme weather blame’ question as part of an effort to convince citizens of the reality of human-caused climate change.
Attribution Methods
Attributing extreme weather events to human influences requires different approaches, of which four broad categories can be identified.
1. Physical Reasoning
The first and most general approach to attributing extreme weather phenomena to rising greenhouse gas concentrations is to use simple physical reasoning.
General physical reasoning can only lead to broad qualitative statements such as ‘this extreme weather is consistent with’ what is known about the human-enhanced greenhouse effect. Such statements offer neither deterministic nor stochastic answers and clearly underdetermine the ‘weather blame question.’ It has given rise to a number of analogies to try to communicate the non-deterministic nature of extreme event attribution. The three most widely used ones concern a loaded die (the chance of rolling a ‘6’ has increased, but no single ‘6’ can be attributed to the biased die), the baseball player on steroids (the number of home runs hit increases, but no single home run can be attributed to the steroids) and the speeding car-driver (the chance of an accident increases in dangerous conditions, but no specific accident can be attributed to the fast-driving).
2. Classical Statistical Analysis
A second approach is to use classical statistical analysis of meteorological time series data to determine whether a particular weather (or climatic) extreme falls outside the range of what a ‘normal’ unperturbed climate might have delivered.
All such extreme event analyses of meteorological time series are at best able to detect outliers, but can never be decisive about possible cause(s). A different time series approach therefore combines observational data with model simulations and seeks to determine whether trends in extreme weather predicted by climate models have been observed in meteorological statistics (e.g. Zwiers et al., 2011, for temperature extremes and Min et al., 2011, for precipitation extremes). This approach is able to attribute statistically a trend in extreme weather to human influence, but not a specific weather event. Again, the ‘weather blame question’ remains underdetermined.
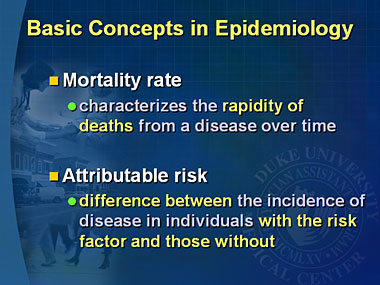
3. Fractional Attributable Risk (FAR)
Taking inspiration from the field of epidemiology, this method seeks to establish the Fractional Attributable Risk (FAR) of an extreme weather (or short-term climate) event. It asks the counterfactual question, ‘How might the risk of a weather event be different in the presence of a specific causal agent in the climate system?’
The single observational record available to us, and which is analysed in the statistical methods described above, is inadequate for this task. The solution is to use multiple model simulations of the climate system, first of all without the forcing agent(s) accused of ‘causing’ the weather event and then again with that external forcing introduced into the model.
The credibility of this method of weather attribution can be no greater than the overall credibility of the climate model(s) used – and may be less, depending on the ability of the model in question to simulate accurately the precise weather event under consideration at a given scale (e.g. a heatwave in continental Europe, a rain event in northern Thailand) (see Christidis et al., 2013a).
4. Eco-systems Philosophy
A fourth, more philosophical, approach to weather event attribution should also be mentioned. This is the argument that since human influences on the climate system as a whole are now clearly established – through changing atmospheric composition, altered land surface characteristics, and so on – there can no longer be such a thing as a purely natural weather event. All weather — whether it be a raging tempest or a still summer afternoon — is now attributable to human influence, at least to some extent. Weather is the local and momentary expression of a complex system whose functioning as a system is now different to what it would otherwise have been had humans not been active.
Results from Weather Attribution Studies
Hulme provides a table of numerous such studies using various methods, along with his view of the findings.
It is likely that attribution of temperature-related extremes using FAR methods will always be more attainable than for other meteorological extremes such as rainfall and wind, which climate models generally find harder to simulate faithfully at the spatial scales involved. As discussed below, this limitation on which weather events and in which regions attribution studies can be conducted will place important constraints on any operational extreme weather attribution system.
Political Dimensions of Weather Attribution
Hulme concludes by discussing the political hunger for scientific proof in support of policy actions.
But Hulme et al. (2011) show why such ambitious claims are unlikely to be realised. Investment in climate adaptation, they claim, is most needed “… where vulnerability to meteorological hazard is high, not where meteorological hazards are most attributable to human influence” (p.765). Extreme weather attribution says nothing about how damages are attributable to meteorological hazard as opposed to exposure to risk; it says nothing about the complex political, social and economic structures which mediate physical hazards.
And separating weather into two categories — ‘human-caused’ weather and ‘tough-luck’ weather – raises practical and ethical concerns about any subsequent investment allocation guidelines which excluded the victims of ‘tough-luck weather’ from benefiting from adaptation funds.
Contrary to the claims of some weather attribution scientists, the loss and damage agenda of the UNFCCC, as it is currently emerging, makes no distinction between ‘human-caused’ and ‘tough-luck’ weather. “Loss and damage impacts fall along a continuum, ranging from ‘events’ associated with variability around current climatic norms (e.g., weather-related natural hazards) to [slow-onset] ‘processes’ associated with future anticipated changes in climatic norms” (Warner et al., 2012:21). Although definitions and protocols have not yet been formally ratified, it seems unlikely that there will be a role for the sort of forensic science being offered by extreme weather attribution science.
Conclusion
Thank you Mike Hulme for a sane, balanced and expert analysis. It strikes me as being another element in a “Quiet Storm of Lucidity”.

Is that light the end of the tunnel or an oncoming train?


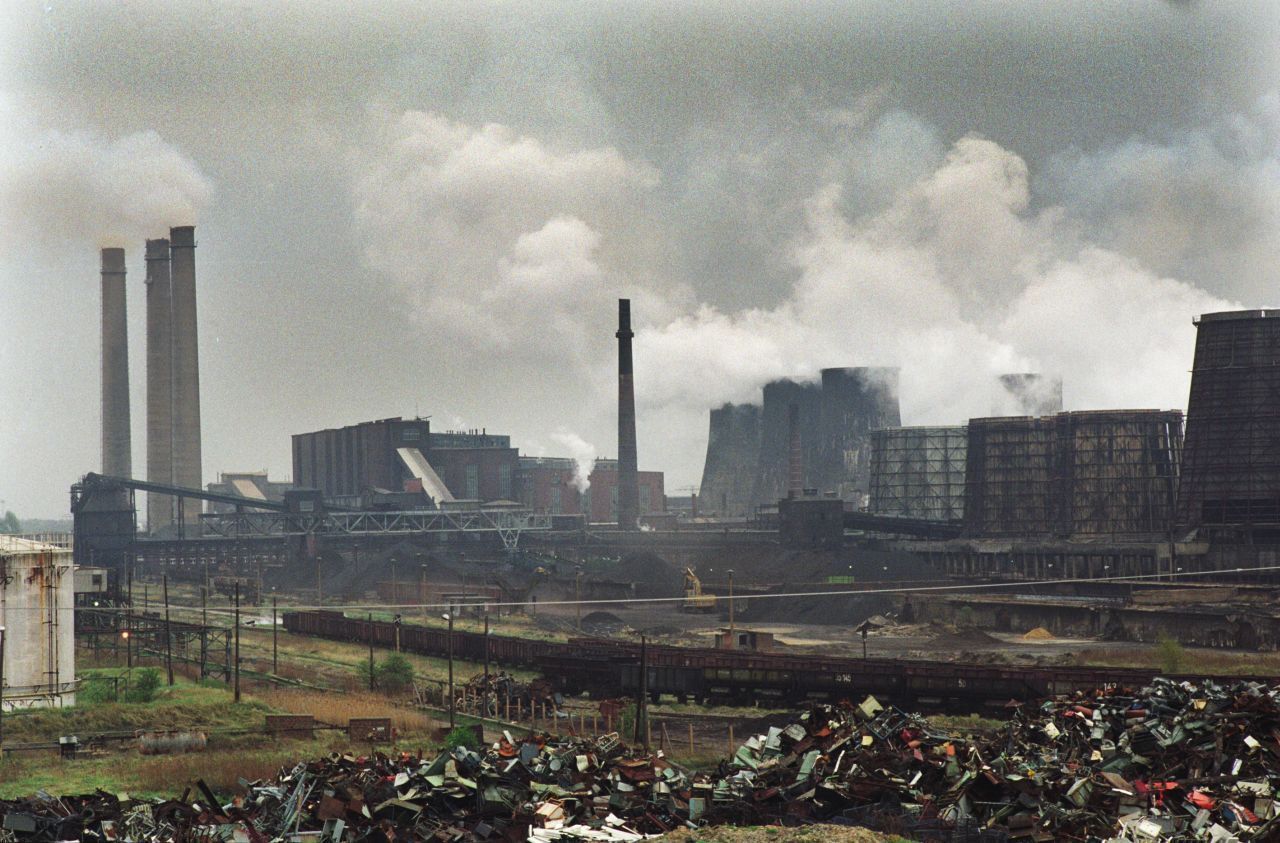
 – Actual areas of higher CO2 concentration


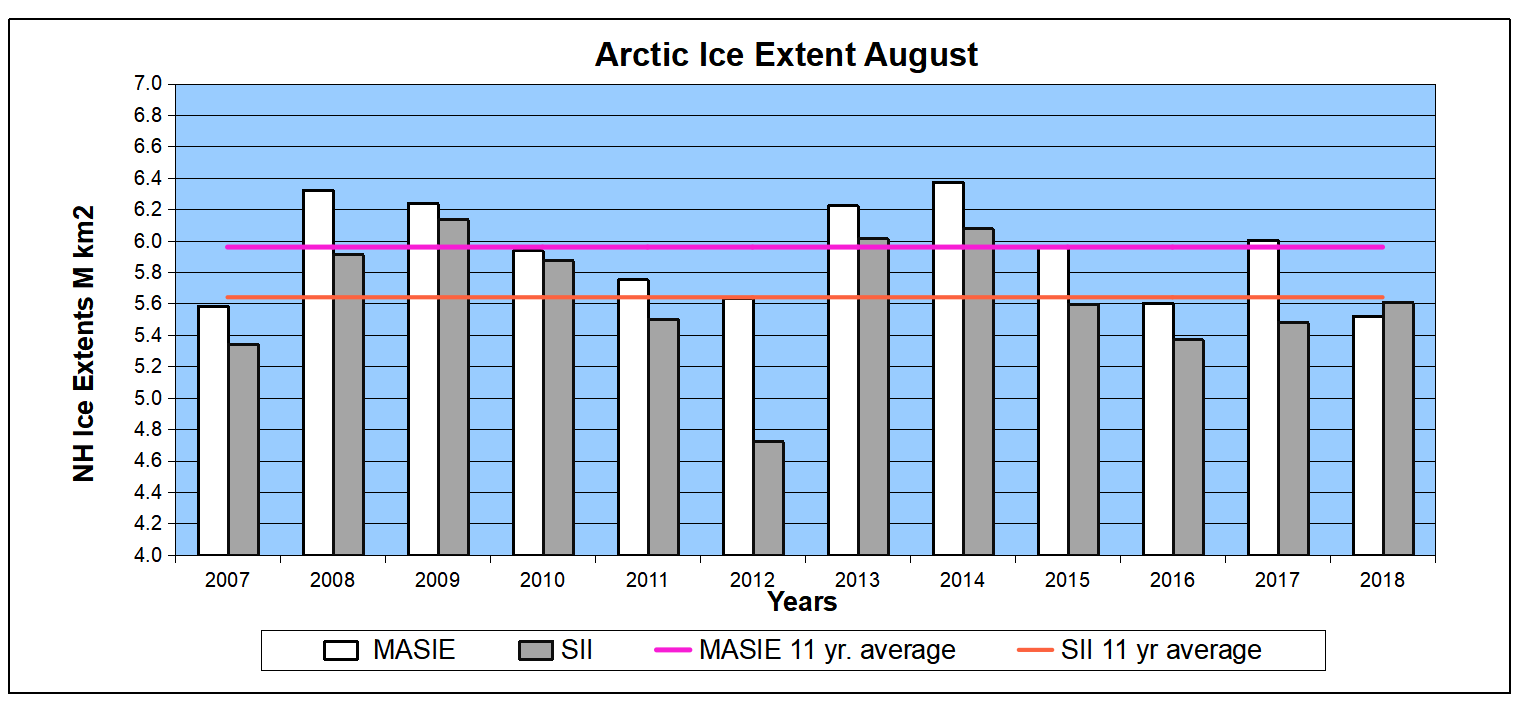
 The image above shows end of August ice charts from AARI (St. Petersburg, Russia) from 2009 to 2018. The legend identifies the thicker, multi-year ice in brown, and extents less than 7/10 in green. 2018 compares to other recent years as showing less ice on the European side, a surplus in East Siberian basin, and thick ice on the CanAm side. Some alarmists pointed to a bit of green showing at the northern tip of Greenland, but that also appeared in 2011.