US Nuclear Power Revival

Duggan Flanakin writes at Real Clear Energy Data Centers, Trump Spark U.S. Nuclear Revival.  Excerpts in italics with my bolds and added images.

With a strong push from the Trump White House, for the first time since Three Mile Island, the nuclear energy industry in the U.S. is bullish about its future. It’s about time, given that the average existing U.S. nuclear power plant was built based on 1980s technology.

A major reason for the virtual standstill in nuclear energy development in the U.S. was the Nuclear Regulatory Commission’s near-maniacal effort to reassure a skittish public that they would not issue permits to any nuclear power plant that had the potential for public harm.

The shot heard round the world signaling a change in U.S. nuclear energy policy was the summary firing of NRC Commissioner Christopher Hanson, whose divinity school background may have contributed to a perception he viewed his job as more a gatekeeper for regulatory control than a partner in building a U.S. nuclear future.  As Senate Environment and Public Works Committee chair Shelley Moore Capito (R, WV) said,

“For decades, the NRC took too long, cost too much, and did not have a predictable and efficient process to approve new licenses or modernize outdated regulations.” 

Newly installed NRC Chair David Wright has called the Trump directives not “just regulatory reform” but a “cultural transformation that positions the NRC to be a forward-leaning, risk-informed regulator for the future.” The agency’s internal culture is being reshaped into a more efficient and modern agency without sacrificing public safety, Wright said.

Several MEPs (mainly Greens) hold up anti-nuclear posters at the debate.

But it’s not just the NRC that is being transformed. Under presidents from Carter to Biden, nuclear was largely relegated to the closet as the primary focus was the media-driven “green energy” crusade. Wind and solar permits were issued without the cleanup requirements and prepayments mandatory for nuclear and fossil fuel facilities. Nuclear was deemed “dirty.”

The first Trump term was so mangled by political infighting (both intra-party and cross-party) that any real nuclear energy agenda lay buried among the lawsuits. In the interim, however, artificial intelligence made giant leaps and the demand for electric power for fast-growing data centers was exploding. Wind and solar cannot be relied upon by entities dependent upon 24/7/365 power – and nuclear is still viewed as the “cleaner” option vis-à-vis natural gas.

Even before Trump’s reelection, tech giants were busily signing nuclear energy deals to power their data centers. Last September the owner of the long-shuttered Three Mile Island Unit 1 nuclear power plant announced plans to restart operations in 2027, thanks to a 20-year power purchase agreement with Microsoft for a nearby AI data center.

Last October Amazon and Google both announced they would be investing in small modular reactors for AI data centers. Two months later Meta said it planned to follow suit. The amazing thing is the uncertainty that the SMR manufacturers will be able to deliver as quickly and as affordably as the tech giants demand. The simple reason? They have no track record yet. But energy demand is so high that waiting is not an option.

In the last few weeks, what was already a fast train picked up even more speed. On October 16 the U.S. Army unveiled its next-generation nuclear power Janus Program for the deployment of small modular reactors to support national defense installations and critical missions. Commercial microreactor manufacturers will partner with the Army’s Defense Innovation Unit with a goal of an operating reactor by September 30, 2028.

On October 26, Hyundai Engineering & Construction announced a basic design contract with Fermi America to construct four large nuclear reactors on a 8.1-square-mile property outside Amarillo, Texas. The Hyundai-designed AP1000 nuclear reactors will generate 4 GW for the HyperGrid complex, the world’s largest integrated energy and AI campus. The 11-GW project also includes 2 GW from small modular reactors, 4 GW from gas combined cycle plants, and 1 GW from solar and battery storage systems.

The integrated license application for the $500 billion project, the brainchild of former Energy Secretary Rick Perry and Fermi co-founder Toby Neugebauer, is currently under expedited review by the NRC. Meanwhile, Hyundai E&C is working on design tasks and preparations for the main construction phase, with finalization anticipated for an engineering, procurement, and construction (EPC) contract by spring 2026.

On October 28, Westinghouse Electric Co. joined Cameco Corporation and Brookfield Asset Management in a new strategic partnership with the U.S. government to accelerate the deployment of nuclear power. The government has committed to construction of at least $80 billion of new reactors using Westinghouse’s nuclear reactor technology to reinvigorate the U.S. nuclear power industrial base.

The government says this partnership will facilitate the growth and future of the U.S. nuclear power industry and the supporting supply chain. The entire project, which will deploy two-unit Westinghouse AP1000 reactors, is expected to create more than 100,000 construction jobs and support or sustain 45,000 manufacturing and engineering jobs across 43 states.

The AP300 SMR is a single-loop, 300-MWe pressurized water reactor that utilizes identical systems to the larger AP1000 reactor.

These are only a sampling of the active and planned contracts for nuclear power plant construction that have sprung out of the unplowed ground with the change in philosophy at the NRC and the White House. All systems are brightly lit green – but obstacles remain in the road.

Even with greatly shortened licensing timeframes, it will take time to complete site designs, obtain permits and licenses, and begin delivering much needed electricity to tech giants and other customers. Yet the biggest problem may be finding enough nuclear fuel at affordable prices to meet the mushrooming demand.

One option, says Curio CEO Ed McGinnis, is recognizing that spent nuclear fuel (including that from nuclear weapons) can safely be turned into fresh usable nuclear fuel and valuable rare metals and materials (like rhodium, palladium, krypton-85, and americium-241).

The Department of Energy’s Advanced Research Projects Agency-Energy (ARPA-E) recent research and development in the advanced reactor technology space. Source: DOE

U.S. production of uranium oxide in 2024 jumped exponentially to 677,000 pounds from just 50,000 pounds in 2023, and exploration and development activities in 2023 were the highest in a decade. On a down note, anti-nuclear activists have been waging a campaign to shut down the White Mesa Mill in Utah that processes uranium ore – and in the U.S. today only about 5% of nuclear fuel has been processed domestically.

The nuclear fuel conundrum is but one of the obstacles in the path of the massive U.S. nuclear power industry growth that is also a vital component of the growth of AI data centers and other emerging electricity-hungry technologies that are shaping our future. But all systems are go – and that is the giant step that had to be taken first.

Placing Melissa in History

Climatic media has fallen in love with Melissa, many of them blaming “climate change”, i.e. CO2 for her strength and destructive power.  No surprise that Imperial College London (who foisted its covid pandemic models upon us) reports that its IRIS model confirms a “rapid attribution” claim.  No doubt there will be more such yada yada at Belem COP to stir up the faithful.

For the rest of us, let’s remember the saying attributed to George Santayana: “Those who cannot remember the past are condemned to repeat it.”  For example, Melissa belongs to a class of stong Atlantic hurricanes going back almost a century.  Here’s a table of them along with peak sustained winds and the CO2 levels at the time.

Peak Wind CO2 Level
Hurricane Year mph ppm
“Cuba” 1932 175 308
“Labor Day” 1935 185 310
Janet 1955 175 314
Camille 1969 175 325
Anita 1977 175 334
David 1979 175 337
Allen 1980 190 339
Gilbert 1988 185 352
Andrew 1992 175 356
Mitch 1998 180 367
Wilma 2005 185 380
Rita 2005 180 380
Katrina 2005 175 380
Dean 2007 175 384
Felix 2007 175 384
Irma 2017 180 407
Maria 2017 175 407
Dorian 2019 185 411
Milton 2024 180 425
Melissa 2025 185 428

Note that all twenty hurricanes had winds ranging between 175 to 190 mph, going back to 1932.  Meanwhile CO2 has increased from 308 ppm to 428 (2025 ytd).  Note also the absence of such storms in the decade 2007 to 2017 despite CO2 adding 23 ppm in that period. The correlation between high wind speeds and CO2 concentrations is an insignificant 0.18.

Then there is the Global Accumulated Cyclone Energy (ACE) report that includes the effects of both minor and major storms, combining strength and frequency.

I added an overlay of CO2 to illustrate how unlikely is a link between CO2 and storms.  Finally from Roger Pielke Jr. a chart showing ACE strength per hurricane:

The charts show that 16 is the average ACE per hurricane, in North Atlantic since 1900 and Globally since 1980.  The trend is not upward, and in North Atlantic appears currently lower than the past.

See Also:

Devious Climate Attribution Studies


Solid Arctic Ice Recovery October 2025

The animation shows the rapid growth of Arctic ice extent during October 2025, from day 274 to day 304, yesterday.  For all of the fuss over the September minimum, little is said about Arctic ice growing 3M km2, that’s 3 Wadhams in one month!.  Look on the left (Russian side) at the complete closing of the Northern Sea Route for shipping.

The graph below shows 2025 compared to the 19 year average (2006 to 2024 inclusive), to SII (Sea Ice Index) and some notable years.

This year October added 2.6M km2 from end of September compared to an average October increase of 3.4M km2.  The first two weeks were above average, before the refreezing rate slowed down ending in a deficit of ~0.5M km2.  In other terms the end of October ice extents were four days behind the average, according to MASIE.  SII started the same, but tracked lower in the second half of October.

The table below shows the distribution of ice in the Arctic Ocean basins.

Region 2025304 Day 304 Ave. 2025-Ave. 2007304 2025-2007
 (0) Northern_Hemisphere 7867621 8401977 -534356 8175072 -307451
 (1) Beaufort_Sea 975681 937777 37904 1038126 -62444
 (2) Chukchi_Sea 683493 466318 217175 242685 440809
 (3) East_Siberian_Sea 1087032 952325 134707 835071 251961
 (4) Laptev_Sea 849204 848501 703 887789 -38585
 (5) Kara_Sea 137515 478870 -341355 311960 -174445
 (6) Barents_Sea 1466 81088 -79621 52823 -51356
 (7) Greenland_Sea 351374 418343 -66969 443559 -92184
 (8) Baffin_Bay_Gulf_of_St._Lawrence 128777 247258 -118481 289374 -160596
 (9) Canadian_Archipelago 568663 740190 -171526 817220 -248557
 (10) Hudson_Bay 8609 66501 -57892 48845 -40236
 (11) Central_Arctic 3051977 3153485 -101508 3206345.33 -154368

Overall ice extent was 534k km2 below average or 6%.  Surpluses appear on the Eurasian shelf seas of Beaufort, Chukchi and East Siberian, while sizeable deficits are shown elsewhere on the Atlantic side, especially Kara, Baffin Bay, Canadian Archipelago and Central Arctic.

Illustration by Eleanor Lutz shows Earth’s seasonal climate changes. If played in full screen, the four corners present views from top, bottom and sides. It is a visual representation of scientific datasets measuring ice and snow extents.


With Wind and Solar More Is Less

At their Energy Bad Boys website Mitch Rolling and Isaac Orr published More is Less with Wind and Solar.  Excerpts in italics with my bolds and added images.

Capacity Values of Wind and Solar Plummet as Penetration Increases

With all the talk about needing to dramatically increase power supplies to meet the growing demand from data centers, as well as for anticipated electric vehicle adoption and other electrification efforts, it’s time to highlight one glaring reality of filling that demand with wind and solarthe reality of diminishing returns.

As in: the more intermittent capacity you add, the less capacity value you get from it. When it comes to wind and solar, more is less.

How it Works

Electric grids and utilities across the country assign reliability ratings to wind and solar resources—called capacity values—and these values diminish to almost zero as the system adds more wind and solar.

This reality is lost on—or intentionally obfuscated by—many wind and solar advocates who like to brag about current high capacity values for wind and solar without mentioning the fact that these values plummet as you add more wind and solar to the grid.

What Are Capacity Values?

The term “capacity value” is defined by the National Renewable Energy Laboratory (NREL) as “the contribution of a power plant to reliably meeting demand. Capacity value is the contribution that a plant makes toward the planning reserve margin…”

Basically, capacity values are percentages of total installed capacity for each energy source that electric grids believe they can reliably count on to meet demand. It reflects the idea that while every energy source has a maximum capacity that it can reach under ideal conditions, not every energy source can reliably perform at these ratings at any given time and when needed.

Limitations of current capacity value methods

Current methodologies for calculating wind and solar capacity values have several limitations that need to be considered when referencing them as reliability metrics.

The first limitation is that they are dependent on existing resources already on the grid. This means that if the generation makeup of the grid changes dramatically, as is happening on power systems across the country, this will have a significant negative impact on the capacity values of wind and solar.

Furthermore, they are also dependent on current load profiles, which are also anticipated to change in major ways with the emergence of data center load growth.

Finally, many capacity values are based on average performance, and not during the highest stress hours for maintaining system reliability, such as peak demand or net peak demand (demand minus wind and solar generation). As a result, capacity values may not assess the reliability of wind and solar when they are needed most, which can lead to an overreliance on them for meeting peak and net peak demand.

Wind and solar capacity values plummet as the system adds more

Now that the basics are out of the way, let’s discuss the reality that many wind and solar advocates avoid: that every megawatt of wind and solar added to the system is less reliable than the one before it.

Wind and solar capacity values fall as more of these resources are added to the grid because their output patterns are often correlated—the sun sets over an entire continent or concentrated wind turbines experience a wind droughtand they are non-dispatchable. As a result, adding more of the same variable resource reaches a point where the resource does not meaningfully contribute to reliability.

Referring back to the methods above, this means that the more wind and solar you add, the less the load can increase on the system or the less perfect capacity can be removed, thus increasing the denominator of the equation at a higher rate than the numerator.

This is reflected by diminishing capacity values for wind and solar in several major regional transmission operators (RTOs) in the country, which we detail below.

Map of Diminishing Capacity Values for Major RTOs

For a summary comparison, the map above shows the current capacity values of wind and solar in major RTOs across the country and how they are all expected to decline in the future as more are added to the system.

Midcontinent Independent System Operator (MISO)

In almost every season for wind and solar capacity values plummet and reach as low as .4 percent for solar in winter and 8.6 percent for wind in fall by 2043. The one exception to this is wind in the summer months, which actually increases from 8 percent in 2025/26 to 11.5 percent in 2030 before falling again to 8.9 percent by 2043. Still not a great reliability rating compared to coal, gas, hydro, and nuclear, which range from 64 percent to 95 percent in every single season.

In its 2024 Regional Resource Assessment, MISO explains that even though wind and solar will make up the vast majority of installed capacity in the future, reliable/accredited capacity will still be made up of primarily thermal resources.

Pennsylvania-New Jersey-Maryland (PJM)

PJM shows a similar story. While onshore wind and offshore wind begin at 41 percent and 68 percent, respectively, in the 2027/28 planning year, these resources drop to 19 percent and 26 percent by 2035/36.  Solar already starts at a low capacity value, dropping from 7—9 percent in 2027/28 to 6—7 percent by 2035/36. PJM explains:

-The ratings for the two solar classes remain stable at low values during the entire period due to the high level of winter risk

-The ratings for the two wind classes decrease significantly due to a gradual shift in winter historical performance patterns driving the winter risk in the model (as shown in the above tables)

Electric Reliability Council of Texas (ERCOT)

ERCOT shows a similar effect as more wind and solar are added to the system, as the same trend can be seen in the following charts.  As you can see, as more solar is added to the grid, the ELCCs drop to the 0—2 percent range, even with significant amounts of wind capacity on the grid.  Similarly, as more wind is added to the ERCOT system, wind ELCCs drop into the 5—10 percent range.

We hear a lot about the complementary nature of wind and solar generation in ERCOT. While this is true to some extent, these results show that even this has its limits when relying on large amounts of wind and solar capacity for meeting demand because complementary generation won’t always be the case, and there will be times when both resources perform poorly at the same time.

Southwest Power Pool (SPP)

For Southwest Power Pool, solar values are fairly high at the moment, ranging from 55 percent to 74 percent, because it has very few solar resources on the grid, while wind is much lower, ranging from 19 percent to 26 percent, because it is already saturated with wind resources.

Conclusion

The trend is simple enough to catch—the more wind and solar are added, the less valuable every additional MW becomes to the grid. The New York ISO (NYISO) makes the case clear in its 2023-2042 System & Resource Outlook report:

One complex challenge that needs to be considered beyond 2040 is the relative ineffectiveness of new solar and wind resources to contribute during periods of reliability risk after a significant amount of capacity has been built.

This is an important reality to remember when wind and solar advocates try to present intermittent resources as reliable energy sources that are able to meet the power demand needs of the future.

The fact is that not only are wind and solar already intermittent and unreliable,
but they have diminishing returns as you add more of them.

As usual, we end with the recommendation of not only keeping our existing thermal fleet in operation for as long as possible, because they are often the most affordable and reliable power plants on the system, but also bringing back recently retired facilities and building new ones on top of it.

Bill Gates Returns to Energy Pragmatism

Alex Epstein reports regarding Bill Gates latest statement downplaying climate doomsterism, and reminds us that he hasn’t changed his mind so much as he is now able to speak freely.  For example, watch this short video of Bill Gates in 2019.

Alex Epstein posted his conversation with Fox News Will Cain: Why Bill Gates is finally rejecting climate catastrophism.  Excerpts in italics with his bolds and my added images.

Will Cain:

Joining us now to continue this conversation is the founder of Center for Industrial Progress, it’s Alex Epstein. Alex, great to see you here today.

I think that, first of all, we should celebrate that Bill Gates has seen the light, has now understood the truth, but that does lead to the question: Why?

Alex Epstein:

It’s a good question, and actually I don’t think Bill’s views have changed much.

I think he’s held the view that he’s saying now, and I think he’s even less of a climate catastrophist and anti-fossil fuel person than he’s letting on now. I think what’s changed—and this is good news—is the cultural, economic, and political environment.

And in particular what we see are, one, the rise of AI and people recognizing that you’re going to need more fossil fuels to provide the reliable electricity—key: reliable electricity—that AI requires.

Number two, you’ve got a government right now that is pro-fossil fuel and very anti-climate catastrophist.

And number three, to the extent I and some others can take credit, I think we’ve advanced the pro-fossil fuel argument that shows that, hey, we do have impact on climate, but the net effect of fossil fuel use is incredibly positive, including on the livability of climate, or safety from climate.

I think those three factors have created an environment where Bill Gates—who I admire in many ways, but is a very calculating guy—where he feels like it’s in his interest to tell more of the truth about this issue than he has in recent years.

Will Cain:

All right, let’s take your three potential explanations for the change of heart for Bill Gates.

Let’s set aside your personal advocacy and persuasion, which I find compelling. And it’s not just you alone, Alex. It’s really most of the thoughtful scientists and thinkers through the last several hundred years have understood the power of fossil fuels and economic growth in helping the vast majority of people across the world.

Maybe that finally broke through to Bill Gates. Maybe he just sees the writing on the wall and understands what’s happening in modern America under President Donald Trump.

But the first is quite interesting: AI and the rise of AI. Does Gates not have significant investment in AI?

Alex Epstein:

Well, he obviously has investments. I mean, every major tech company is taking into account AI, I think validly, whether their current investment level is right or not. It’s key to their future.

But it’s not even that it’s just of interest to his company, although that’s surely a factor. He thinks it’s a big interest to humanity.

But most importantly, all these things, it’s more okay to talk about it. We already knew that the world needed way more energy, but now it’s okay to talk about it.

That’s why all these tech companies who made net zero pledges are suddenly saying, “No, we don’t need net zero”. Nothing changed really in the information environment, but the cultural environment did change.

Will Cain:

Well, I guess I’m just a little skeptical on the sincerity today and yesterday, and when I notice he can mingle his own personal net worth and benefit with that of what is best for humanity.

And if he convinces himself that AI is what’s best for humanity, and AI needs energy to grow, and therefore AI needs fossil fuels, he can convince himself that using fossil fuels is what’s best for humanity. And I think that is a little more in line with what I would suspect to be the motivation of Bill Gates.

Alex Epstein:

It’s definitely true with the broader tech industry. Again, they made “net zero” commitments just a few years ago when Biden was president, when everyone was on to ESG, and then suddenly their views changed and they never really acknowledged it.

Now I’m grateful, guys. Welcome to the party. I’m glad Zuckerberg is here. I’m glad Bezos is here. I’m glad Gates is here. These are people I admire a lot in many ways. I’m glad they’re changing their views.

But maybe stick to the truth this time instead of being so opportunistic and not really explaining how one day you’re “net zero” and then when it conflicts with your business interests, then you’re suddenly, “hey, yeah, let’s use more fossil fuels, we need it for AI”.

I thought you were worried about a climate catastrophe. It turns out there was never a climate catastrophe.

Will Cain:

I’m glad they’re here too, Alex. I just wouldn’t issue them permanent membership yet in the Club of Truth. Alex Epstein, it’s great to have you here on the show today.

See Also:

Energy Realism Marching Ahead

The Reality

Energy sources are additive and symbiotic. Coal, oil, gas, wood, nuclear
and renewables all grew together, they didn’t replace each other.

The Fantasy

IPCC Global Warming Claims Not Only Wrong, But Impossible

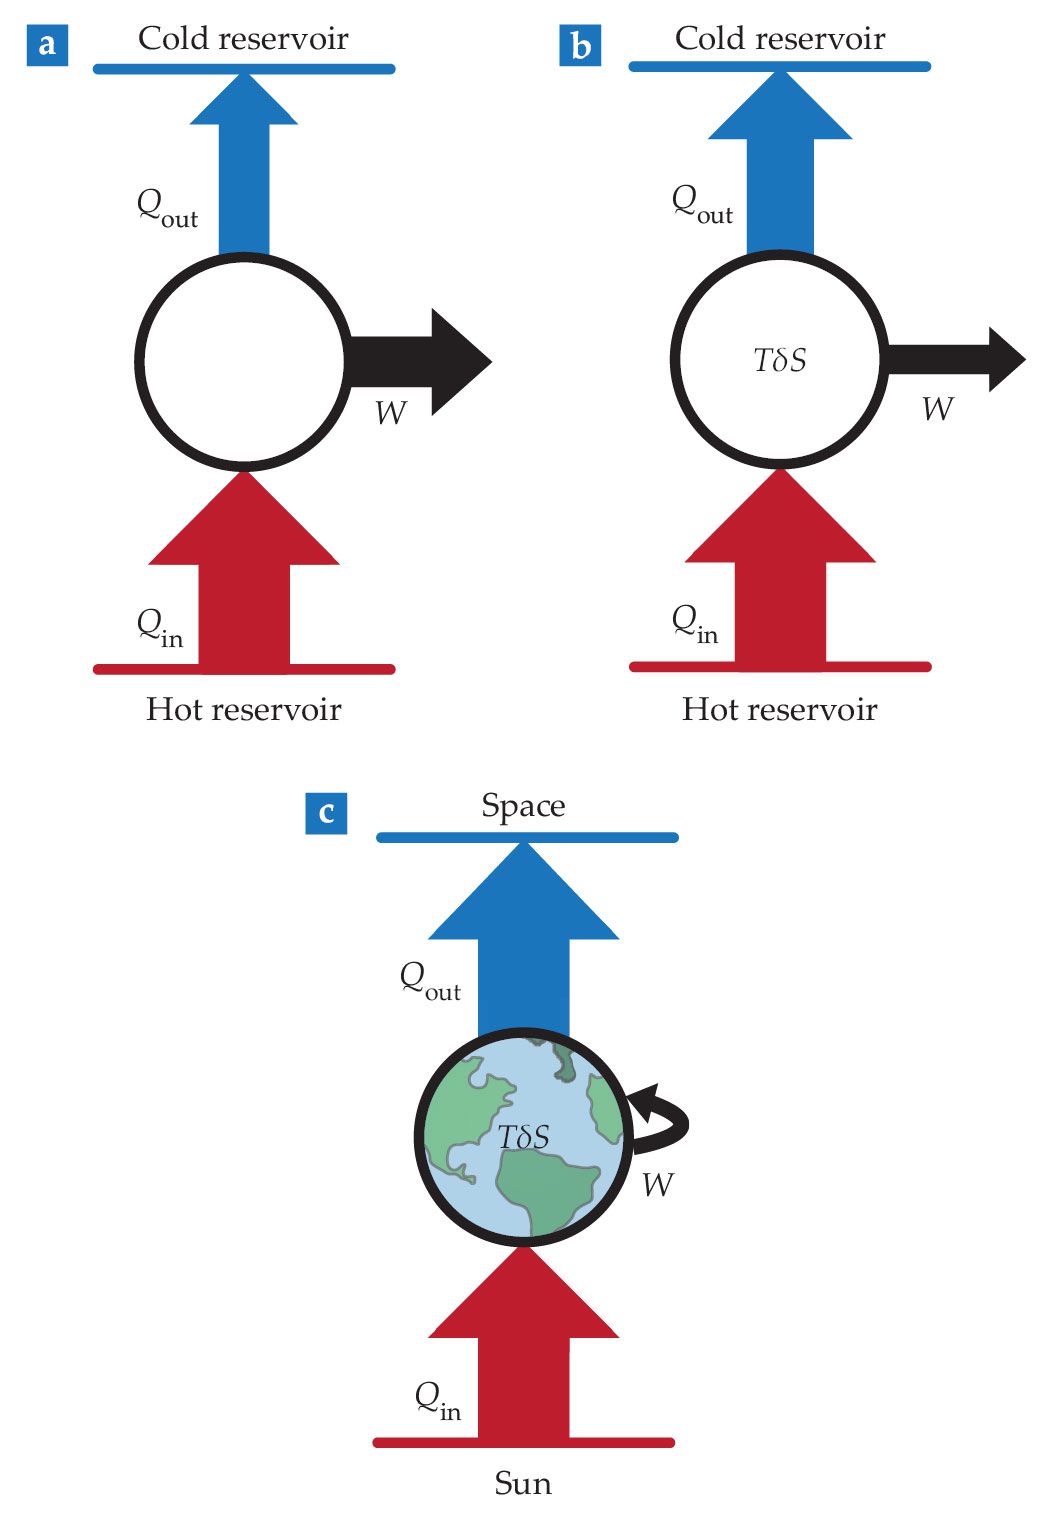
Climate as heat engine. A heat engine produces mechanical energy in the form of work W by absorbing an amount of heat Qin from a hot reservoir (the source) and depositing a smaller amount Qout into a cold reservoir (the sink). (a) An ideal Carnot heat engine does the job with the maximum possible efficiency. (b) Real heat engines are irreversible, and some work is lost via irreversible entropy production TδS. (c) For the climate system, the ultimate source is the Sun, with outer space acting as the sink. The work is performed internally and produces winds and ocean currents. As a result, Qin = Qout.

Ad Huijser recently published a paper explaining why IPCC claims about global warming are contradicted by observations of our Earth thermal system including a number of internal and external subsytems. The title Global Warming and the “impossible” Radiation Imbalance links to the pdf. This post is a synopsis to present the elements of his research findings, based on the rich detail, math and references found in the document. Excerpts in italics with my bolds and added images. H/T Kenneth Richard and No Tricks Zone.

Abstract

Any perturbation in the radiative balance at the top of the atmosphere (TOA) that induces a net energy flux into- or out of Earth’s thermal system will result in a surface temperature response until a new equilibrium is reached. According to the Anthropogenic Global Warming (AGW) hypothesis which attributes global warming solely to rising concentrations of Greenhouse gases (GHGs), the observed increase in Earth’s radiative imbalance is entirely driven by anthropogenic GHG-emissions.

However, a comparison of the observed TOA radiation imbalance with the assumed GHG forcing trend reveals that the latter is insufficient to account for the former. This discrepancy persists even when using the relatively high radiative forcing values for CO2 adopted by the Intergovernmental Panel on Climate Change (IPCC), thereby challenging the validity of attributing recent global warming exclusively to human-caused GHG emissions.

In this paper, Earth’s climate system is analyzed as a subsystem of the broader Earth Thermal System, allowing for the application of a “virtual balance” approach to distinguish between anthropogenic and other, natural contributions to global warming. Satellite-based TOA radiation data from the CERES program (since 2000), in conjunction with Ocean Heat Content (OHC) data from the ARGO float program (since 2004), indicate that natural forcings must also play a significant role. Specifically, the observed warming aligns with the net increase in incoming shortwave solar radiation (SWIN), likely due to changes in cloud cover and surface albedo. Arguments suggesting that the SWIN trend is merely a feedback response to GHG-induced warming are shown to be quantitatively insufficient.

This analysis concludes that approximately two-thirds of the observed global warming must be attributed to natural factors that increase incoming solar radiation, with only one-third attributable to rising GHG-concentrations. Taken together, these findings imply a much lower climate sensitivity than suggested by IPCC-endorsed Global Circulation Models (GCMs).

Introduction

On a global scale and over longer periods of time, the average surface temperature of our climate system reacts similarly to that of a thermal system such as a pot of water on a stove: when the incoming heat is steady and below boiling, the system stabilizes when the heat loss (via radiation and convection) equals the input. Analogously, Earth’s surface-atmosphere interface is the main absorber and emitter of heat. Reducing the “flame” (solar input) leads to cooling, regardless of the total heat already stored in the system. The system’s average temperature will drop as well, as soon as the heating stops. So, no sign of any “warming in the pipeline” for such a simple system.

The two transport mechanisms, air and ocean, operate on different timescales. Air has a low specific heat capacity, but high wind speeds make it a fast medium for heat transfer. Oceans, by contrast, have a high specific heat capacity but move more slowly. The Atlantic Meridional Overturning Circulation (AMOC) with the well-known Gulf Stream carrying warm water from south to north, can reach speeds up to about 3 m/s. But its warm current remains largely confined to surface layers due to limited solar radiation penetration and gravity-induced stratification. With a path-lengths of up to 8,000 km and an average speed of 1.5 m/s, ocean heat takes approximately 2 months to travel from the Gulf of Mexico to the Arctic. This is comparable to the 1 to 2 months delay between solar input and temperature response in the annual cycle, suggesting that oceanic heat transport is part of the climate system’s normal operation. Climate adaptation times from anthropogenic influences are estimated at 3 to 5 years. If “warming in the pipeline” exists, it must be buried in the much colder, deeper ocean layers.

ARGO float data since 2004 show substantial annual increases in Ocean Heat Content (OHC), sometimes expressed in mind-boggling terms such as 10²² joules per year (see Fig.1). While this may sound alarming [1,2], when converted to flux, it represents less than 1 W/m², a mere 0.6% of the average 160 W/m² of absorbed solar energy at the surface. All the rest is via evaporation, convection and ultimately by radiation sent back to space after globally being redistributed by wind and currents.

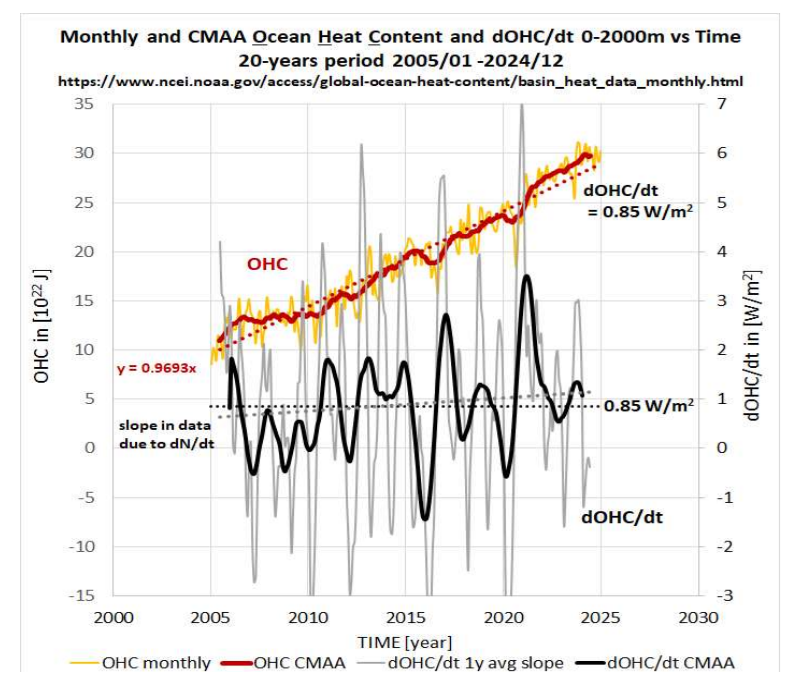
Fig. 1. Ocean Heat Content (OHC) anomaly from 0–2000 meters over time, shown as 3-month and annual moving averages (CMAA), along with their time derivatives. Notable are the relatively large variations, likely reflecting the influence of El Niño events. The average radiative imbalance at the top of the atmosphere (TOA), estimated at 0.85 W/m², corresponds approximately to the midpoint of the time series (around 2015). Data: https://www.ncei.noaa.gov/access/global-ocean-heat-content/basin_heat_data.html [7].

This raises the question: Why would extra GHGs that have only a limited effect on the 99.4% of the outgoing flux, have affected this 0.6% residue during a couple of decennia in such a way that we should be scared about all that “warming in the pipeline” as Hansen et al. [2] are warning us for? In the following sections, we examine data showing that observed trends in the radiation imbalance and OHC are better explained by the internal dynamics of the Earth’s thermal system and natural forcings such as from increasing solar radiation, rather than solely by GHG emissions.

Estimating our climate’s thermal capacity CCL

The rather fast responses of our climate indicates that the thermal capacity of our climate must be much less than the capacity of the entire Earth thermal system. This climate heat capacity CCL depends on how sunlight is being absorbed, how that heat is transferred to the atmosphere and which part of it is being stored in either land or ocean.

At continental land-area, sunlight is absorbed only at the very surface where the generated heat is also in direct contact with the atmosphere. Seasonal temperature variations don’t penetrate more than 1 to 2 meters deep in average and as a consequence, storage of heat is relatively small. Sunlight can penetrate pure water to several hundred meters deep, but in practice, penetration in the oceans is limited by scattering and absorption of organic and inorganic material. A good indication is the depth of the euphotic zone where algae and phytoplankton live, which need light to grow. In clear tropical waters where most of the sunlight hits our planet, this zone is 80 to 100 m deep [12].

Another important factor in our climate’s heat capacity is how this ocean layer of absorbed heat is in contact with the atmosphere. Tides, wind, waves and convection continuously mix the top layer of our oceans, by which heat is easily exchanged with the atmosphere. This mixed-layer is typically in the order of 25 – 100 m, dependent on season, latitude and on the definition of “well mixed” [13]. Below this ~100 m thick top-layer, where hardly any light is being absorbed and the mixing process has stopped, ocean temperatures drop quickly with depth. As the oceans’ vertical temperature gradient at that depth doesn’t support conductive nor convective heat flows going upward, climate processes at the surface will thus become isolated from the rest of the Earth’ thermal system.

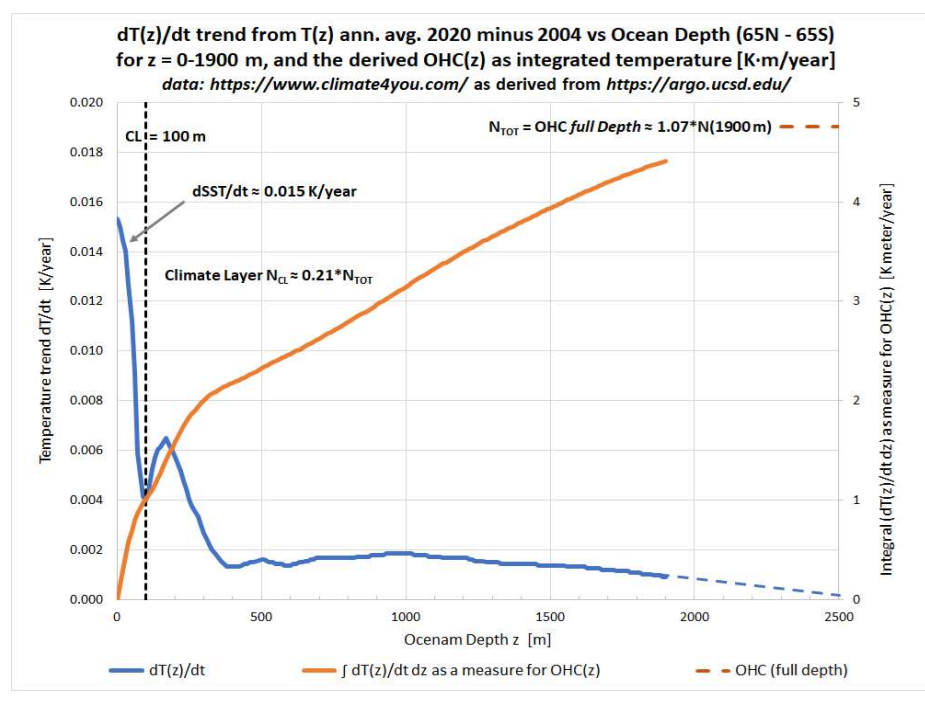
Figure 4 with the Change in Ocean Heat Content vs. Depth over the period 2004 – 2020 obtained via the ARGO-floats [6,14], offers a good indication for the average climate capacity CCL. It shows the top layer with a high surface temperature change according to the observed global warming rate of about 0.015 K/year, and a steep cut off at about 100 m depth in line with the explanation above. Below the top layer, temperature effects are small and difficult to interpret, probably due to averaging over all kinds of temperature/depth profiles in the various oceans ranging from Tropical- to Polar regions.

In case of a “perfect” equilibrium (N = 0, dTS/dt = 0), all of the absorbed sunlight up to about 100 m deep, has to leave on the ocean-atmosphere interface again. However, deep oceans are still very cold with a stable, negative temperature gradient towards the bottom. This gradient will anyhow push some of the absorbed heat downwards. Therefore, even at a climate equilibrium with dTS/dt= 0, we will observe N > 0. With the large heat capacity of the total ocean volume, that situation will not change easily, as it takes about 500 years with today’s N ≈ +1 W/m2 to raise its average temperature just 1°C.

The Earth’s climate system can thus be regarded as a subset of the total Earth’s thermal system (ETS) responding to different relaxation times. The climate relaxes to a new equilibrium within 3–5 years, while the deeper oceans operate on multidecadal or even longer timescales, related to their respective thermal capacities C for the ETS, and CCL for the climate system.

The (near) “steady state” character of current climate change

Despite the ongoing changes in climate, the current state can be considered a “near” steady-state. The GHG forcing trend has been pretty constant for decades. Other forcings, primarily in the SW channel, are also likely to change slowly and can be approximated as having constant trends over decadal timescales. Similarly, despite yearly fluctuations, the surface temperature trend has remained fairly stable since 2000.

This analysis strengthens the conclusion that the increase in both N(t) and N0(t) are not a direct consequence of greenhouse gas emissions, but rather of enhanced forcing in the SW-channel.

The preceding analysis highlights how the IPCC’s assumptions diverge significantly from observed reality. While the IPCC model components may collectively reproduce the observed warming trend, they fail to individually align with key observational data, in particular the Ocean Heat Content.

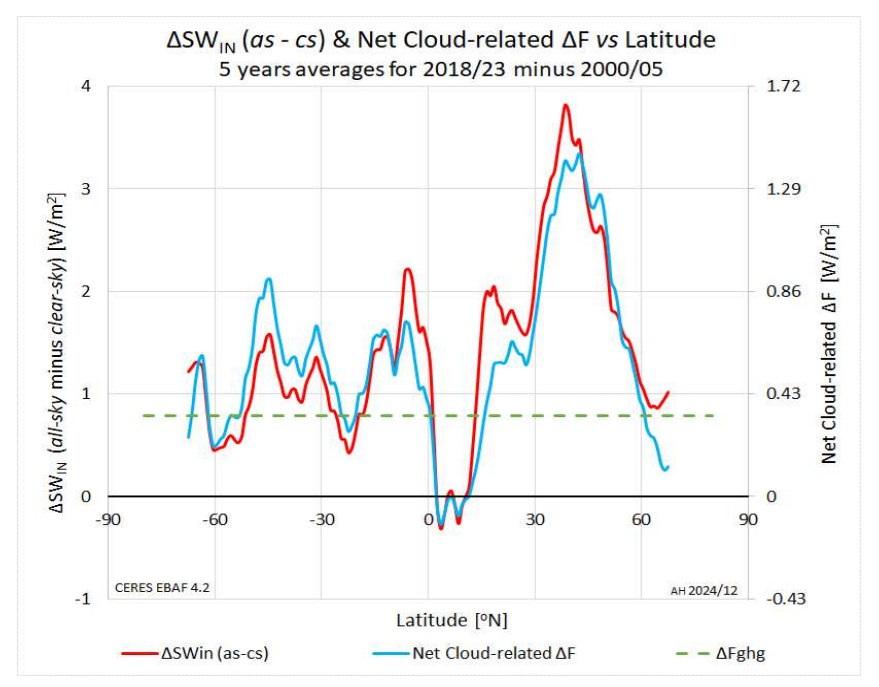
Figure 6 also illustrates that changes in cloudiness are more pronounced on the Northern Hemisphere, especially at mid-latitudes and over Western Europe. For example, the Dutch KNMI weather-station at Cabauw (51.87°N, 4.93oE), where all ground-level radiation components are monitored every 10 minutes, recorded an increase in solar radiation of almost +0.5 W/m²/year since 2000 [26]. Applying the 0.43 net-CRE factor (conservative for this latitude), we estimate a local forcing trend dFSW/dt ≈ 0.2 W/m²/year. This is an order of magnitude larger than the GHG forcing (0.019–0.037 W/m²/year). Even with the IPCC values, GHGs can just account for about 16% of the warming at this station. The average temperature trend for this rural station located in a polder largely covered by grassland, is with ~ +0.043 K/year almost 3x the global average. This, nor the other trends mentioned above can be adequately explained by the IPCC’s GHG-only model.

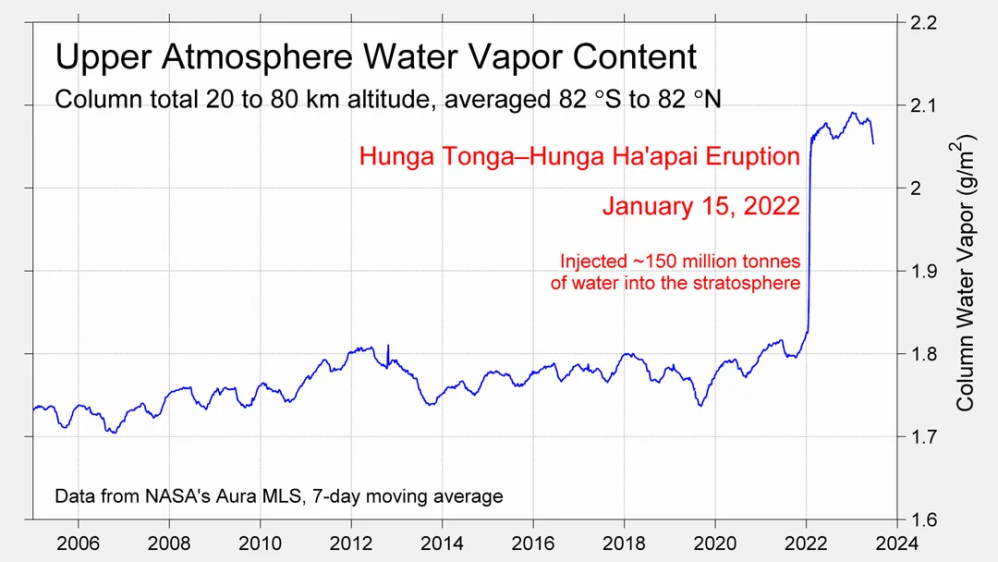
The IPCC places strong emphasis on the role of climate feedbacks in amplifying the warming effect of greenhouse gases (GHGs) [8]. These feedbacks are considered secondary consequences of Anthropogenic Global Warming, driven by the initial temperature increase from GHGs. Among them, Water-Vapor feedback is the most significant. A warmer atmosphere holds more water vapor (approximately +7%/K) and since water vapor is a potent GHG, even a small warming from CO2 can amplify itself through enhanced evaporation.

Other feedbacks recognized by the IPCC include Lapse Rate, Surface Albedo, and Cloud feedbacks [8], all of which are inherently tied to the presence and behavior of water in its various phases. Therefore, these feedbacks are natural responses to temperature changes, regardless of the original cause of warming, be it GHGs, incoming solar variability, or internal effects. They are not additive components to natural climate sensitivity, as treated by the IPCC, but rather integral parts of it [4].

This analysis reinforces a fundamental point: climate feedbacks are not external modifiers of climate sensitivity; rather, they are inherent to the system. Their combined effect is already embedded in the climate response function. The IPCC’s treatment of feedbacks as additive components used to “explain” high sensitivities in GCMs is conceptually flawed. Physically, Earth’s climate is governed by the mass balance of water in all its phases: ice, snow, liquid, vapor, and clouds. The dynamics between these phases are temperature-sensitive, and they constitute the feedback processes. Feedbacks aren’t just add-ons to the climate system, they are our climate.

Ocean Heat Content increase

In the introduction, the “heat in the pipeline” concept: the idea that heat stored in the deep, cold ocean layers could later resurface to significantly influence surface temperatures, was challenged. Without a substantial decrease in surface temperatures to reverse ocean stratification, this seems highly unlikely. Large and rapid temperature fluctuations during the pre-industrial era with rates up to plus, but also minus 0.05 K/year over several decennia as recorded in the Central England Temperature (CET) series [27], more than three times the rate observed today, further undermine the notion of a slow-release heat mechanism dominating surface temperature trends.

Ocean Heat Content must be related to solar energy. It is the prime source of energy heating the Earth thermal system. Almost 1 W/m2 of that 240 W/m2 solar flux that is in average entering the system, is presently remaining in the oceans. This is an order of magnitude larger than the estimated 0.1 W/m2 of geothermal heat upwelling from the Earth inner core [11]. Extra greenhouse gasses don’t add energy to the system, but just obstruct cooling. As shown in Section 5.3, this accounts for a radiation imbalance offset τ dFGHG/dt, or equivalent to a contribution to dOHC/dt of only about 0.08 W/m2.
.
As redistribution of “heat in the pipeline” will not change the total OHC, roughly 3/4 of the observed positive trend in OHC must at least be attributed to rising solar input. The oceans act in this way as our climate system’s thermal buffer. It will mitigate warming during periods of increased solar input and dampen cooling when solar input declines, underscoring its critical role in Earth’s climate stability.

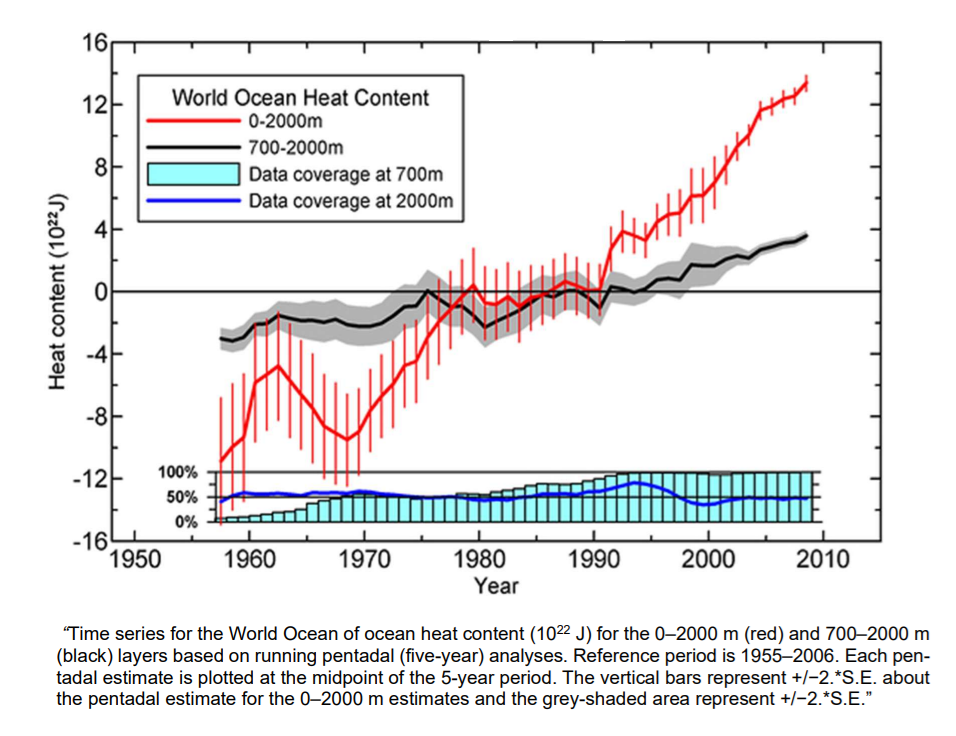
The strong downwards slope in the OHC before 1970 confirms the observation in Section 5.4 and expressed by (12) that around the turning point t = ζ, the forcing trend in the SW-channel had to be negative. Moreover, the rather slowly increasing 700-2000m OHC data in Fig.7 indicate that most of the fluctuations have occurred relatively close to the surface. Heat from e.g. seafloor volcanism as “warming from below”, is expected to show up more pronounced in this 700-2000m OHC-profile. Although we cannot rule out geothermal influences [29], this observation makes them less likely.

ERBE measurements of radiative imbalance.

As the OHC seems to be primarily coupled to SWIN, the most plausible cause would involve rapid changes in SW-forcing. A sudden drop in cloud-cover might explain such changes, but no convincing observations could be found for the 1960-1980 period. Alternatively, changes in the latitudinal distribution of cloud-cover as illustrated by Fig.6, can result in similar radiative impacts due to the stark contrast between a positive radiation imbalance in the Tropics and a very negative imbalance at the Poles. The ENSO-oscillations in the Pacific Ocean around the equator are a typical example for such influences, as also illustrated in Fig.3 [10]. Shifts in cloud distribution are linked to changes in wind patterns and/or ocean currents, reinforcing the idea as indicated in Section 1, that even minor disruptions in horizontal heat transport can trigger major shifts in our climate’s equilibrium [29, 30]. Sharp shifts in Earth’s radiation imbalance like the one around 1970 as inferred from Fig.7, may even represent one of those alleged tipping points. But in this case, certainly not one triggered by GHGs. Ironically, some climate scientists in the early 1970s predicted an impending (Little) Ice Age [31].

While additional data (e.g. radiation measurements) are needed to draw firm conclusions, the available evidence already challenges the prevailing GHG-centric narrative again. GHG emissions, with their near constant forcing rate, cannot account for the timing nor the magnitude of historical OHC trends, as NOAA explicitly suggests [32]. Similarly, claims by KNMI that “accelerations” in radiation imbalance trends are GHG-driven [1], are not supported by data. And finally, the alarms around “heat in the pipeline” must be exaggerated if not totally misplaced. Given the similarities in radiation imbalance and GHG forcing rates around 1970 with today’s situation, we must conclude that this assumed heat manifested itself at that time apparently as “cooling in the pipeline”.

However, warnings for continued warming even if we immediately stop now with emitting GHGs are nevertheless, absolutely justified. Only, it isn’t warming then from that heat in the pipeline due to historical emissions that will boost our temperatures. Warming will continue to go on as long as natural forcings will be acting. These are already today’s dominant drivers behind global temperature trends. And unfortunately, they will not be affected by the illusion of stopping global warming as created by implementing Net-Zero policies.

Summary and conclusions

This analysis demonstrates that a global warming scenario driven solely by greenhouse gases (GHGs) is inconsistent with more than 20 years of observations from space and of Ocean Heat Content. The standard anthropogenic global warming (AGW) hypothesis, which attributes all observed warming to rising GHG concentrations, particularly CO2, cannot explain the observed trends. Instead, natural factors, especially long-term increase in incoming solar radiation, appear to play a significant and likely dominant role in global warming since the mid-1970s.

The observed increase in incoming solar radiation cannot be accounted for by the possible anthropogenic side effects of Albedo- and Cloud-feedback. All evidence points to the conclusion that this “natural” forcing with a trend of about 0.035 W/m2/year is equal to, or even exceeds the greenhouse gas related forcing of about 0.019 W/m2/year. Based on these values, only 1/3rd of the observed temperature trend can be of anthropogenic origin. The remaining 2/3rd must stem from natural changes in our climate system, or more broadly, in our entire Earth’ thermal system.

Moreover, the observed increase in Earth’s radiation imbalance appears to be largely unrelated to GHGs. Instead, it correlates strongly with natural processes driving increased incoming solar radiation. Claims of “acceleration” in the radiation imbalance due to GHG emissions are not supported by the trend in accurately measured GHG concentrations. If any acceleration in global warming is occurring, it is almost certainly driven by the increasing flux of solar energy—an inherently natural phenomenon not induced by greenhouse gases.

In summary, this analysis challenges the notion that GHGs are the primary drivers of recent climate change. It underscores the importance of accounting for natural variability, especially in solar input, when interpreting warming trends and evaluating climate models.

Note: Dr. Ad Huijser, physicist and former CTO of Philips and director of the Philips Laboratories, describes himself as “amateur climatologist”. However his approach to climate physics is quite professional, I think.

See Also: 

Our Atmospheric Heat Engine


Texans, Don’t Mess With Emissions Reductions

Gregory Wrightstone writes at Lone Star Standard; Texans should stop spending on fake climate crisis.  Excerpts in italics with my bolds and added images.

Boasting that Texas “has built more wind power than any state and is a top contender for the most solar power,” Texas Tribune article bemoans a decline in federal subsidies for such energy sources and a potential loss of “billions in investments and thousands of jobs.”

Interestingly, the writers focus on business interests of the climate industrial complex and ignore the stated reason for subsidies – to avoid supposed catastrophic global warming. Planetary health – purported to be threatened by industrial emissions of carbon dioxide (CO2) – was not even an afterthought in the handwringing over wind and solar financial fortunes.

Regardless, Texans face no such peril and the billions already spent on “green” obsessions in the Lone Star State are for naught. “There is no evidence of a climate crisis in Texas and none can be reasonably expected,” says a report, “Texas and Climate Change,” recently published by the CO2 Coalition, Fairfax, Virginia.

Both the Fifth National Climate Assessment (NCA5) and a Texas A&M University report predict harm to Texans from human-induced warming. Climate change is “putting us at risk from climate hazards that degrade our lands and waters, quality of life, health and well-being, and cultural interconnectedness,” according to NCA5.

In contradicting those findings, the CO2 Coalition analyzed data from the National Oceanic and Atmospheric Administration (NOAA), U.S. Environmental Protection Agency (EPA), NASA, U.S. Department of Agriculture, reports published in peer-reviewed journals and others.

“The temperature in Texas has shown no unprecedented or unusual warming, despite increasing atmospheric carbon dioxide,” says the CO2 Coalition report. “Recent temperatures in Texas are similar to those found more than 100 years ago.”

In fact, the annual number of 100-degree days in Texas has an overall decreasing trend.

While some have claimed a connection between climate change and July’s tragic flooding in central Texas, no scientific basis for such a link exists. Though extreme, the flooding was not a first.

According to Harris County meteorologist Jeff Lindner, the July 4th flood of the Guadalupe River at Kerrville peaked at 34.29 feet, making it the third-highest flood on record for the city. The 2025 flood crest trails the 39.0-foot flood crest from 1932 and the 37.72-foot flood crest from in 1987.

“Over the last 28 years, flash floods, while varying greatly from year to year, have actually been in slight decline,” the CO2 Coalition report found.

Precipitation data from the U.S. Historical Climatology Network indicate that Texas has experienced a very slight increase (1 to 2 inches annually) in precipitation since 1895, which is contrary to the predictions of significant increases in rainfall from climate alarmists. If anything, the modest increase in Texas precipitation should have beneficial effects on the state’s agricultural yields.

As for drought – the primary scourge of crops throughout the world – government data show no discernable trend in the severity of arid spells in Texas, which is a direct contradiction to claims of increasing drought by both the Texas A&M report and NCA5.

Similarly rebutting the fearmongering of alarmists, the CO2 Coalition report found no increasing trends for wildfires, hurricanes and tornadoes.

With respect to tornadoes, the U.S., including Texas, has seen a decades-long decline in the most violent of twisters. The likely reason is a warming Earth – a natural phenomenon following the end of the Little Ice Age – reduces the temperature differentials between regions inside and outside equatorial regions that drive storms.

Like the rest of the world, Texas has experienced record-breaking growth in crop production over the last several decades. This is no coincidence, as research shows every increase of 1 part per million (ppm) in CO2 concentration boosts yields of corn and wheat by 0.4% and 1%, respectively. Based on these metrics, the 140-ppm increase in CO2 since the beginning of the Industrial Revolution has led to increases of 56%, 84% and 140% in corn, soybeans and wheat, respectively.

CO2 is necessary for life on Earth, and reducing emissions of the gas would be harmful to vegetation, including forests, grasslands and agricultural crops.

Even if Texas could stop emitting CO2, the amount of atmospheric warming averted would be only 0.0093 degrees and 0.0237 degrees by 2050 and 2100, respectively. These changes are negligible and cannot be felt or measured.

If the reason for spending on Texas climate policy were to enrich wind and solar developers, then, yes, lamentations over the demise of subsidies are understandable. However, there is no basis for spending a cent on a fake crisis – and certainly not on technologies that offer no benefit.

Anti-Tornado Tech Better Than Mitigation?

Gregory Wrightstone is a geologist; executive director of the CO2 Coalition, Fairfax, Va.; author of “Inconvenient Facts: The Science That Al Gore Doesn’t Want You to Know” and “A Very Convenient Warming: How modest warming and more CO2 are benefiting humanity.”

CO2 Coalition Texas Report is here.  My snyopsis is :

No Climate Crisis in Texas

September 2025 Ocean SST Cooling

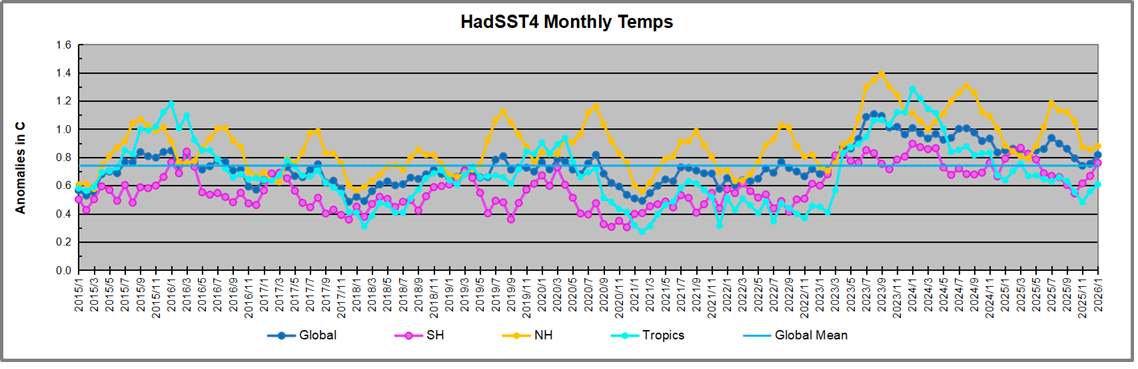
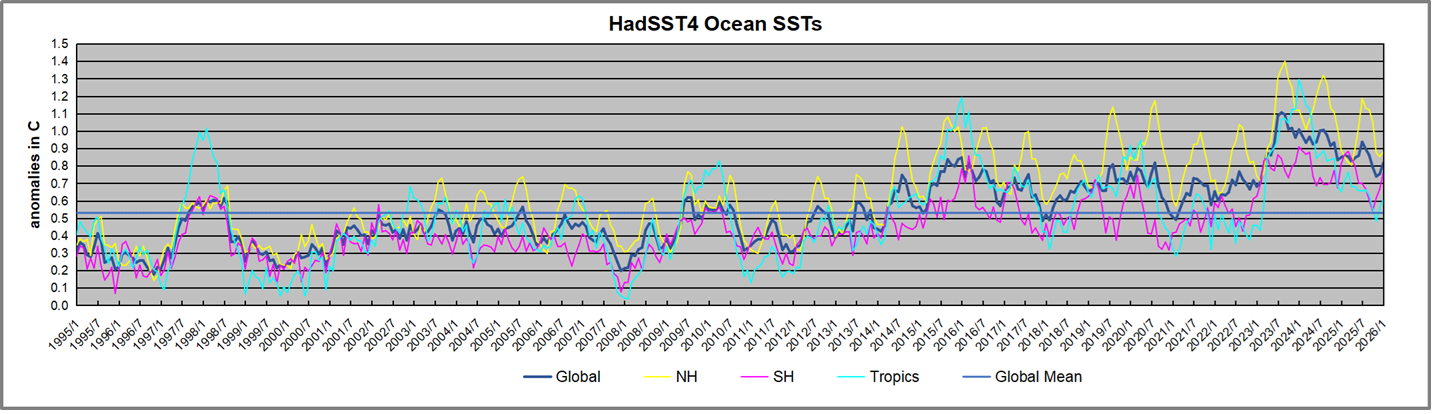
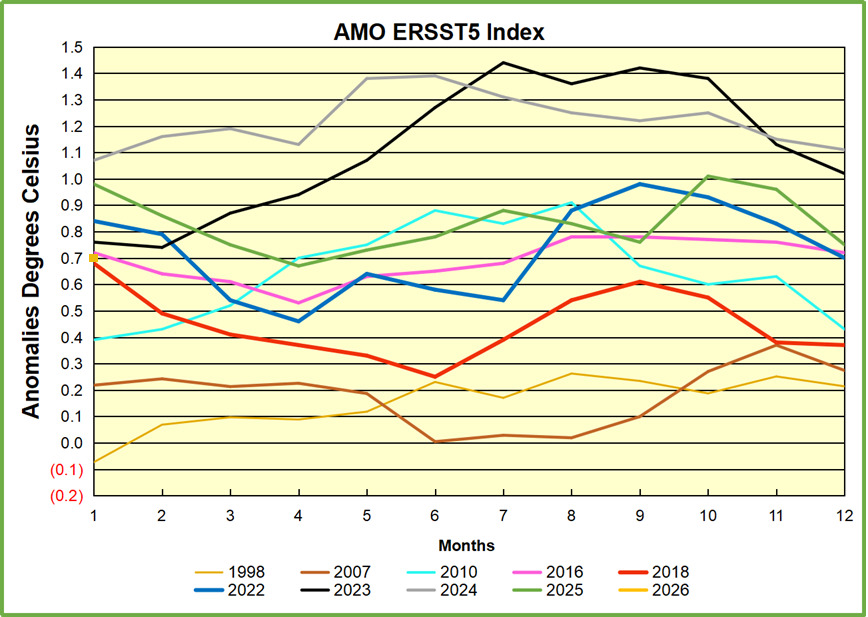
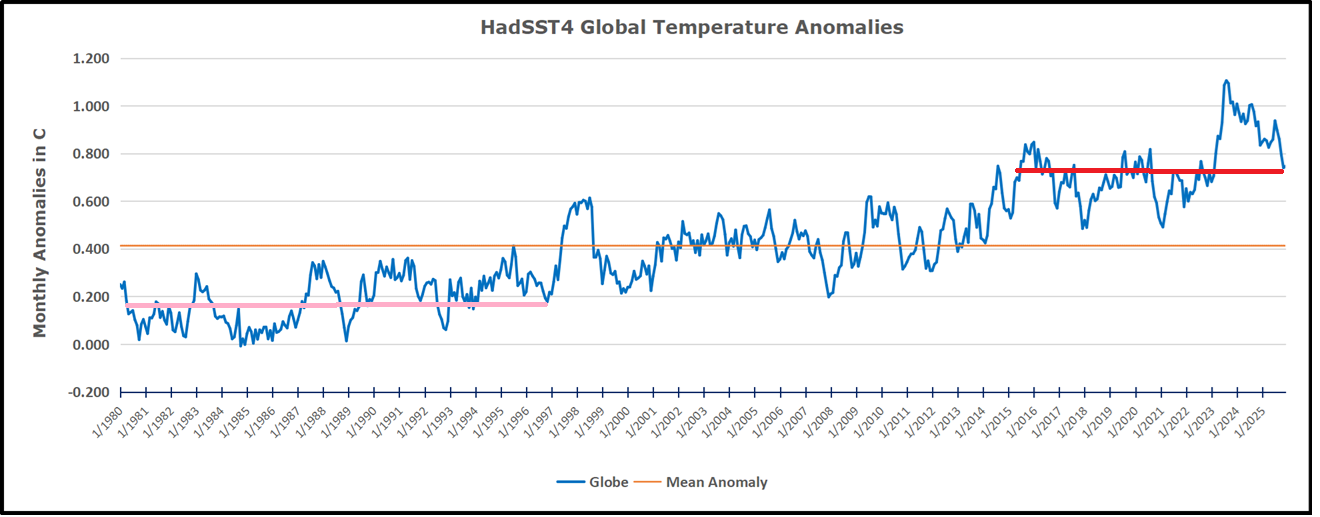
The best context for understanding decadal temperature changes comes from the world’s sea surface temperatures (SST), for several reasons:

  • The ocean covers 71% of the globe and drives average temperatures;
  • SSTs have a constant water content, (unlike air temperatures), so give a better reading of heat content variations;
  • A major El Nino was the dominant climate feature in recent years.

Previously I used HadSST3 for these reports, but Hadley Centre has made HadSST4 the priority, and v.3 will no longer be updated. I’ve grown weary of waiting each month for HadSST4 updates, so the July and August reports were based on data from OISST2.1.  This dataset uses the same in situ sources as HadSST along with satellite indicators. Now however, the US government is shut down and updates to climate datasets are likely to be delayed.  Reminds of what hospitals do when their budgets are slashed: They close the Maternity Ward to get public attention.

So this September report is based again on HadSST 4, but with a twist. The data is slightly different in the new version, 4.2.0.0 replacing 4.1.1.0. Product page is here.

The Current Context

The chart below shows SST monthly anomalies as reported in HadSST 4.2 starting in 2015 through September 2025. A global cooling pattern is seen clearly in the Tropics since its peak in 2016, joined by NH and SH cycling downward since 2016, followed by rising temperatures in 2023 and 2024 and cooling in 2025.

Note that in 2015-2016 the Tropics and SH peaked in between two summer NH spikes.  That pattern repeated in 2019-2020 with a lesser Tropics peak and SH bump, but with higher NH spikes. By end of 2020, cooler SSTs in all regions took the Global anomaly well below the mean for this period.  A small warming was driven by NH summer peaks in 2021-22, but offset by cooling in SH and the tropics, By January 2023 the global anomaly was again below the mean.

Then in 2023-24 came an event resembling 2015-16 with a Tropical spike and two NH spikes alongside, all higher than 2015-16. There was also a coinciding rise in SH, and the Global anomaly was pulled up to 1.1°C in 2023, ~0.3° higher than the 2015 peak.  Then NH started down autumn 2023, followed by Tropics and SH descending 2024 to the present. During 2 years of cooling in SH and the Tropics, the Global anomaly came back down, led by Tropics cooling from its 1.3°C peak 2024/01, down to 0.6C in September this year. Note the smaller peak in NH in July 2025 now declining along with SH and the Global anomaly cooler as well. Presently the Global anomaly is only slightly above the mean for this period

Comment:

The climatists have seized on this unusual warming as proof their Zero Carbon agenda is needed, without addressing how impossible it would be for CO2 warming the air to raise ocean temperatures.  It is the ocean that warms the air, not the other way around.  Recently Steven Koonin had this to say about the phonomenon confirmed in the graph above:

El Nino is a phenomenon in the climate system that happens once every four or five years.  Heat builds up in the equatorial Pacific to the west of Indonesia and so on.  Then when enough of it builds up it surges across the Pacific and changes the currents and the winds.  As it surges toward South America it was discovered and named in the 19th century  It iswell understood at this point that the phenomenon has nothing to do with CO2.

Now people talk about changes in that phenomena as a result of CO2 but it’s there in the climate system already and when it happens it influences weather all over the world.   We feel it when it gets rainier in Southern California for example.  So for the last 3 years we have been in the opposite of an El Nino, a La Nina, part of the reason people think the West Coast has been in drought.

It has now shifted in the last months to an El Nino condition that warms the globe and is thought to contribute to this Spike we have seen. But there are other contributions as well.  One of the most surprising ones is that back in January of 2022 an enormous underwater volcano went off in Tonga and it put up a lot of water vapor into the upper atmosphere. It increased the upper atmosphere of water vapor by about 10 percent, and that’s a warming effect, and it may be that is contributing to why the spike is so high.

A longer view of SSTs

To enlarge, open image in new tab.

The graph above is noisy, but the density is needed to see the seasonal patterns in the oceanic fluctuations.  Previous posts focused on the rise and fall of the last El Nino starting in 2015.  This post adds a longer view, encompassing the significant 1998 El Nino and since.  The color schemes are retained for Global, Tropics, NH and SH anomalies.  Despite the longer time frame, I have kept the monthly data (rather than yearly averages) because of interesting shifts between January and July. 1995 is a reasonable (ENSO neutral) starting point prior to the first El Nino.

The sharp Tropical rise peaking in 1998 is dominant in the record, starting Jan. ’97 to pull up SSTs uniformly before returning to the same level Jan. ’99. There were strong cool periods before and after the 1998 El Nino event. Then SSTs in all regions returned to the mean in 2001-2.

SSTS fluctuate around the mean until 2007, when another, smaller ENSO event occurs. There is cooling 2007-8,  a lower peak warming in 2009-10, following by cooling in 2011-12.  Again SSTs are average 2013-14.

Now a different pattern appears.  The Tropics cooled sharply to Jan 11, then rise steadily for 4 years to Jan 15, at which point the most recent major El Nino takes off.  But this time in contrast to ’97-’99, the Northern Hemisphere produces peaks every summer pulling up the Global average.  In fact, these NH peaks appear every July starting in 2003, growing stronger to produce 3 massive highs in 2014, 15 and 16.  NH July 2017 was only slightly lower, and a fifth NH peak still lower in Sept. 2018.

The highest summer NH peaks came in 2019 and 2020, only this time the Tropics and SH were offsetting rather adding to the warming. (Note: these are high anomalies on top of the highest absolute temps in the NH.)  Since 2014 SH has played a moderating role, offsetting the NH warming pulses. After September 2020 temps dropped off down until February 2021.  In 2021-22 there were again summer NH spikes, but in 2022 moderated first by cooling Tropics and SH SSTs, then in October to January 2023 by deeper cooling in NH and Tropics.

Then in 2023 the Tropics flipped from below to well above average, while NH produced a summer peak extending into September higher than any previous year.  Despite El Nino driving the Tropics January 2024 anomaly higher than 1998 and 2016 peaks, following months cooled in all regions, and the Tropics continued cooling in April, May and June along with SH dropping.  After July and August NH warming again pulled the global anomaly higher, September through January 2025 resumed cooling in all regions, continuing February through April 2025, with little change in May,June and July despite upward bumps in NH. Now temps in all regions are cooling August and September 2025.

What to make of all this? The patterns suggest that in addition to El Ninos in the Pacific driving the Tropic SSTs, something else is going on in the NH.  The obvious culprit is the North Atlantic, since I have seen this sort of pulsing before.  After reading some papers by David Dilley, I confirmed his observation of Atlantic pulses into the Arctic every 8 to 10 years.

Contemporary AMO Observations

Through January 2023 I depended on the Kaplan AMO Index (not smoothed, not detrended) for N. Atlantic observations. But it is no longer being updated, and NOAA says they don’t know its future.  So I find that ERSSTv5 AMO dataset has current data.  It differs from Kaplan, which reported average absolute temps measured in N. Atlantic.  “ERSST5 AMO  follows Trenberth and Shea (2006) proposal to use the NA region EQ-60°N, 0°-80°W and subtract the global rise of SST 60°S-60°N to obtain a measure of the internal variability, arguing that the effect of external forcing on the North Atlantic should be similar to the effect on the other oceans.”  So the values represent SST anomaly differences between the N. Atlantic and the Global ocean.

The chart above confirms what Kaplan also showed.  As August is the hottest month for the N. Atlantic, its variability, high and low, drives the annual results for this basin.  Note also the peaks in 2010, lows after 2014, and a rise in 2021. Then in 2023 the peak reached 1.4C before declining to 0.9 last month.  An annual chart below is informative:

Note the difference between blue/green years, beige/brown, and purple/red years.  2010, 2021, 2022 all peaked strongly in August or September.  1998 and 2007 were mildly warm.  2016 and 2018 were matching or cooler than the global average.  2023 started out slightly warm, then rose steadily to an  extraordinary peak in July.  August to October were only slightly lower, but by December cooled by ~0.4C.

Then in 2024 the AMO anomaly started higher than any previous year, then leveled off for two months declining slightly into April.  Remarkably, May showed an upward leap putting this on a higher track than 2023, and rising slightly higher in June.  In July, August and September 2024 the anomaly declined, and despite a small rise in October, ended close to where it began.  Note 2025 started much lower than the previous year and headed sharply downward, well below the previous two years, then since April through September aligning with 2010.

The pattern suggests the ocean may be demonstrating a stairstep pattern like that we have also seen in HadCRUT4.

The rose line is the average anomaly 1982-1996 inclusive, value 0.18.  The orange line the average 1982-2025, value 0.41 also for the period 1997-2012. The red line is 2015-2025, value 0.69. As noted above, these rising stages are driven by the combined warming in the Tropics and NH, including both Pacific and Atlantic basins.

Curiosity:  Solar Coincidence?

The news about our current solar cycle 25 is that the solar activity is hitting peak numbers now and higher  than expected 1-2 years in the future.  As livescience put it:  Solar maximum could hit us harder and sooner than we thought. How dangerous will the sun’s chaotic peak be?  Some charts from spaceweatherlive look familar to these sea surface temperature charts.

Summary

The oceans are driving the warming this century.  SSTs took a step up with the 1998 El Nino and have stayed there with help from the North Atlantic, and more recently the Pacific northern “Blob.”  The ocean surfaces are releasing a lot of energy, warming the air, but eventually will have a cooling effect.  The decline after 1937 was rapid by comparison, so one wonders: How long can the oceans keep this up? And is the sun adding forcing to this process?

uss-pearl-harbor-deploys-global-drifter-buoys-in-pacific-ocean

USS Pearl Harbor deploys Global Drifter Buoys in Pacific Ocean

How Badly Climatists Attack Meat

For those who prefer to read, below is a lightly edited transcript from the closed captions with my bolds and added images.

This is a short story about how the BBC and the UK Parliament turned the opinions of just ten people into the single voice of 66 million. At the centre of this story is our favourite food. Meat production has long bothered the environmental movement and climate campaigners, because it is at the centre of culture, and family and social life.

And this is where green ideology longs to be. Consequently, greens have urged us to give up meat, telling us of the harm done to nature by our diets. They have urged us to cut down, to become vegetarian or vegan. Or to switch to other forms of protein. No thanks! Green attempts to control our diets have been met with resistance.

But UK politicians have now decided to tackle the problem of the public’s lack of interest in the green agenda.
“Dear resident. Dear resident. Dear resident.
You could be one of over 100 people selected to take part in the UK-wide Citizens’ Assembly on how should the UK tackle climate change.” They believe that they can change our behaviour by focusing their interventions on the things which the public will find least unacceptable. Parliament believes that by convening a Climate Assembly, the government, politicians, and civil servants can find out what level of regulation of their lifestyles the wider public will accept.

“The UK government has legally committed to reach Net Zero greenhouse gas emissions by 2050. To help inform how we’re going to reach Net Zero, 108 members of the public were brought together by the UK parliament in our first ever Citizens’ Assembly on climate change. They discussed the impact of what we eat and how we used the land.”

But what recommendations did the Climate Assembly make? Reduce our meat and dairy consumption by 20-40%, but with no bans or taxes.” The Climate Assembly provided Parliament with this information and it has now been used as the basis for policies. “The fact that you’ve given up time to come here and take this seriously is of the greatest importance.” But what really happened in the Climate Assembly? Did it really recommend that the government should find ways to make us eat less meat?

The findings of the Climate Assembly, which met over six weekends, were published in a 500-page report. The reduction of meat and dairy consumption does appear in the key recommendations of the report, in a section on “what we eat and how we use the land”. But this was not the view of the whole Assembly.

On the weekend during which the Assembly discussed this question, it was divided into three groups, only one of which was tasked with a discussion on “what we eat and how we use the land”. Just 35 Assembly members, out of 108, were in this group. They heard from just one academic’s views on meat, Rosie Green:

“We know that red and processed meat is associated with a number of health conditions. So it’s linked to heart disease, it’s linked to strokes, it’s linked to particular types of cancer, like bowel cancer, and it’s also linked to diabetes.Whereas on the other hand, eating fruit and vegetables is linked to prevention of all those conditions. So if you eat the more fruit and vegetables you eat, there’s less likely you are to suffer from those diseases.”

There was no debate or criticism of these questionable scientific claims made by an academic, who has manifestly strayed into political activism. “Meat will never ever be banned. It will never be banned.” “I don’t like the idea of controlling things at all.”

But the Climate Assembly were not fools. When they were asked to vote on what they believed the government should prioritize from a list of eight options available to them, just 29 per cent chose reducing meat as a priority. It was the second least popular option prioritized by the group. And 29% of 35 just people is ten people.

Nonetheless, the report claimed that ‘assembly members tended to express support for” the idea. On the available evidence, that claim simply isn’t true. The report emphasizes reducing meat and dairy in our diets, despite this underwhelming support for it, because the report was not written by the Assembly itself. It was written by the academic activists and green campaigning organizations that ran the event.

The claim has now been used by politicians and civil servants designing the UK’s climate policies, to meet the Net Zero target. They had already decided that changing people’s diets will be part of the Net Zero agenda. In 2019, The Climate Change Committee produced a report on Net Zero, which proposed interventions to produce behaviour change, including the reduction of meat and dairy consumption.

In their new Net Zero policy report launched last week, the Committee claim that they have incorporated the Climate Assembly’s recommendations in their analysis, including the reduction of meat and dairy consumption.

“The Climate Assembly said they would be happy with a 20 to 40 per cent reduction in meat consumption. We’ve looked really carefully at the Climate Assembly’s recommendations, and actually we were quite engaged in the process as well.  If you take the time to guide people through this, to explain why the changes are needed, to explain the sorts of things that need to happen, they’re really supportive of action. And actually we were surprised how supportive they were of lots of the things that we were thinking of already. What we’ve done is we’ve taken their advice, and we’ve constructed our scenarios to align to it.”

But though these civil servants seem to have enthusiastically embraced what the public think, as represented by what the Climate Assembly seemed to tell them, they have forgotten that the recommendation came from just ten people. The views of these ten people is now at the centre of the Climate Change Committee’s advice to Parliament, which they are almost certain to adopt.

From the Sixth Carbon Budget–The UK’s path to Net Zero

But what the authors of the Climate Assembly report could not ignore, was the Assembly’s insistence that changes to diets should be voluntary, not compulsory. How will the government legislate for voluntary behavioral change? It has turned to the UK’s defacto state broadcaster, the BBC.

The BBC presents itself as a news broadcaster, but this BBC video on meat consumption and climate change shows that it has a role engineering the social values and behavioral changes that government policy requires.

“The average Brit eats meat twice a day. And we’re eating much more protein than we need. Would more of us change our diet, if we knew it was also better for the planet?”

Rather than investigating the claims seemingly produced by the Climate Assembly, but which were just the views of ten of its members, the BBC uncritically reports them. It shows the views of one Assembly member’s concerns about his own meat consumption, and its damaging effect on the environment: a seventeen-year-old boy, who has decided to give up meat.

“After the second weekend of the Assembly I became pescatarian. When I was able to see right there on the graph that beef had a big proportion of higher CO2 emissions than fish, I knew that if I carried on eating beef then I know I’d be making the wrong sort of choice for the environment”.“So Max decided to give up his beloved beef steak…”

And rather than challenging a young person about how he formed such a view of the world, and asking questions about the ideology and one-sided view that was presented to the Climate Assembly, the BBC uses him, to encourage its audience to change their diets and behaviour.

In this way, the BBC, turns ten into 66 million. It forgets the views that many of us may have about politicians’ and civil servants’ designs for our lives and lifestyles for the next decades. The public has once again been excluded from debates about climate policy.

Just in:  Beyond Meat stock tanks to $1 after debt swap deal dilutes company shares

Beyond Meat’s stock collapsed to near $1 a share on Tuesday after the embattled plant-based meat maker finalized a debt exchange deal that handed bondholders hundreds of millions of new shares — effectively wiping out most existing investors.  In the summer of 2019, the stock neared $240 a share — its peak price. Since then, the stock has lost more than 99% of its value.