Norway Leads Europe Back to Energy Sanity

An article at Liberty Beacon spills the beans, or IOW, explains how they are letting the oil and gas cat out of the bag: ‘We are talking about energy security for Europe’: Norway doubles down on oil and gas production.  Excerpts in italics with my bolds and added images.

Norway, an energy superpower, which gives it its massive sovereign wealth fund,
is stepping up for itself and Europe. Sensible. Everybody wins.
Meanwhile, the Left and the UK look like idiots.

In case of any doubt about Norway’s commitment to maintain – and expand – its production of gas and oil offshore, the energy minister,

“We will develop, not dismantle, activity on our continental shelf.”

This week, to the alarm of environmental campaigners, he announced that three gasfields off the country’s southern coast would reopen by the end of 2028 – nearly three decades after they closed – to meet a shortfall caused by the impact of the war in Ukraine and disruption to supplies from the Middle East.

The decision will help keep gas and oil production at about the 2025 level – which has been stable for almost 20 years – and stay broadly the same for the rest of this decade. Norway has 97 offshore oilfields, three of which came on stream last year, and its Norwegian Offshore Directorate expects “100 and beyond” within the next two years, still producing at least the present level of 2m barrels of oil daily.

The Barents Sea, in the high north, is the new gas and oil frontier – with the prospect of mining for seabed minerals between northern Norway and Greenland, a more distant prospect after initial surveys by the Norwegian Offshore Directorate – an agency of Aasland’s department – showed potential.

“Norwegian offshore production plays an important role in ensuring energy security in Europe,” says Aasland.

“The world, and Europe, will have a need for oil and gas for decades to come and it is crucial that Norway continues to develop its continental shelf to remain a reliable and long-term supplier … and (with) a high level of exploration activity.

The sector generates vast wealth for Norway, but the decision this week to reopen the Albuskjell, Vest Ekofisk and Tommeliten Gamma gasfields in the North Sea, which were closed in 1998, has received heavy criticism in some quarters.  It goes against the advice of the country’s environment agency, and the Socialist Left party accused the government of “greenwashing”.

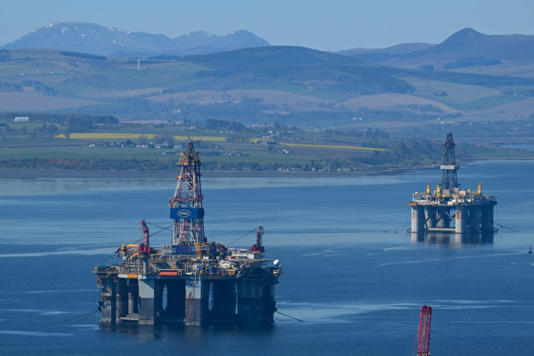
North Sea oil rigs | Source: GETTY © GB News

Matt Gibson provides additional details at MSN Norway reopens three North Sea gas fields to power millions of homes while UK stalls.  Excerpts in italics with my bolds and added images

Norway plans to revive three mothballed North Sea gas fields as demand in Europe soars.  As the UK stalls on developing its side of the basin, with new licences banned and work on two fields frozen because of climate challenges, the Norwegian fields will be opened for the first time in 30 years.

They are believed to contain enough fuel to heat millions of homes and the country says it is vital for European energy security.  The gas will be sent by pipeline to Germany with light oil sent to the UK.

The Norwegian government has also said that it is keen to further exploit its resources in the North Sea, the Norwegian Sea and the Barents Sea. It plans to access 70 blocks identified on the seabed.  Prime Minister Jonas Gahr Støre said: “Norway’s oil and gas industry is vital to Norway and to Europe.” Energy minister Terje Aasland said: “Norwegian production of oil and gas is an important contribution to energy security in Europe.

“Developing new gas fields allows Norway to maintain high supply levels over the long term. This has become all the more crucial since Russia’s full-scale invasion of Ukraine and the conflict in the Middle East.”

The three fields are run by ConocoPhillips. The company’s European president, Steinar Våge, said: “By utilising existing infrastructure, we can produce substantial resources at low cost, and strengthen gas exports to Europe.”

The UK spent £20b buying oil and gas from Norway last year.
Meanwhile, its domestic output continues to fall. 

Offshore operators have complained that it is becoming difficult to work under the current political regime. Drilling at both Rosebank, Britain’s largest untapped oil field, and Jackdaw, a gas field, has been halted after a legal challenge on climate grounds.  The decision on whether work can restart rests with energy secretary, Ed Miliband.

The Norwegian fields were closed in 1998. However, thanks to new technology, they have become accessible.  They are set to reopen in 2028 and are predicted to be in operation for 20 years. Energy experts suggested that the UK’s offshore industry was being held back by policy.

A spokesman for Offshore Energies UK told the Telegraph:

“The discrepancy in success in the two different regions of the North Sea is not dictated by geology. “It is entirely determined by how respective governments treat oil and gas resources through policy, regulation and taxation.”

Shadow energy minister Claire Coutinho said:

“Norway just announced 70 new blocks of oil and gas exploration, including in the North Sea. “Meanwhile, just over the border on the British side of the North Sea, our Energy Secretary tells us we’ve got nothing left so he has to ban new licences.

“Same basin. Same geology. The difference is political will.”

Apologies to anyone offended by an oilman’s vocabulary.

Fossil Fuel Lawsuits Drive Up Energy Prices

How to Sue Fossil Fuel Companies Over Climate Change

Power the Future warns of the large scale attack on US energy platform in an article Green Groups’ 600+ Lawsuits Are Driving Up Energy Costs.  Excerpts in italics with my bolds and added images.

As the Trump Administration meets with oil and gas CEOs to discuss lowering gas prices, there’s a growing question that can’t be ignored: Who is working just as aggressively to stop it?

Green groups have filed over 600 lawsuits targeting energy policies and projects. These efforts are not isolated; they form a coordinated strategy to challenge nearly every aspect of an energy agenda focused on increasing supply and lowering costs.

Organizations like the Natural Resources Defense Council, Sierra Club,
and Earthjustice openly tout their litigation records.

NRDC alone has reported suing the administration more than 160 times, including efforts that helped halt major infrastructure projects like Keystone XL. The Sierra Club has claimed more than 300 cases during Trump’s first term and over 100 additional legal actions in 2025 alone. Earthjustice similarly boasts more than 200 lawsuits.

This is not routine legal oversight; this is a full-scale attack to reshape U.S. energy policy through the courts.

Many of these organizations operate within a broader network of donors, including foreign billionaires like Hansjörg Wyss, whose funding has supported a range of environmental advocacy initiatives. That raises important transparency concerns: if overseas money is helping fuel legal campaigns that influence U.S. energy policy, the public deserves to know.

“The environmental movement has weaponized litigation to deliberately undermine and slow down American energy production at every turn,” said Daniel Turner, Founder and Executive Director of Power The Future. “These groups operate as a well-funded and aggressive adversary to U.S. energy independence, not as some innocent third party simply looking out for nature. While American families and workers suffer from higher energy costs and lost opportunities, these organizations file lawsuit after lawsuit to block responsible domestic development. It’s time to treat them as the serious obstacle they are and shine a light on who is really pulling the strings behind this coordinated campaign against our nation’s energy industry.”

Economist Wayne Winegarden describes the economic damages done by this litiigation in his Forbes article Fossil Fuel Lawsuits Are A Tax On Consumers.  Excerpts in italics with my bolds and added images.

Announcing the state’s lawsuit against energy producers, California AG Rob Bonta claimed it is time to make energy companies pay for “the harm they have caused.” It is one of more than thirty such lawsuits around the country.

As I have argued herehere, and here, these lawsuits are not heroic efforts to safeguard the environment. The filings by cities and state AGs, as well as the dozens of other suits they hope to inspire, will primarily harm families by worsening the affordability crisis that is already harming households across the country. As with any policy that drives up the costs of energy, low- and middle-income families will bear the brunt of the costs.

Of course, harming families and local businesses through higher energy costs is not how the plaintiffs justify their lawsuits. California and other elected officials around the country sell their lawsuits to their local constituents with populist tropes about corporate accountability.

Yet, based on the comments of many of the AGs and plaintiff attorneys, the litigants recognize that one impact from the lawsuits will be higher costs on consumers. For many plaintiffs, imposing larger costs on families and businesses is an intended outcome.

Take comments California’s attorney general made in late April to an environmental group about this litigation. Responding to a questions from the host, he said

“One goal for the litigation is to make oil and gas more expensive as a way to disincentive use of these energy sources and impose billions of dollars in costs that these companies will have to share with their shareholders.”

Higher energy costs harm families’ financial stability. As the Federal Reserve notes, “when gasoline prices increase, a larger share of households’ budgets is likely to be spent on it, which leaves less to spend on other goods and services. The same goes for businesses whose goods must be shipped from place to place or that use fuel as a major input (such as the airline industry). Higher oil prices tend to make production more expensive for businesses, just as they make it more expensive for households to do the things they normally do.”

https://i2.wp.com/royaldutchshellplc.com/wp-content/uploads/2017/07/Screen-Shot-2017-07-18-at-09.18.32.jpg

If the plaintiffs are able to extract a $200 billion settlement from the energy companies, which is much less than what they are asking for, then the price of gasoline would increase by 62-cents a gallon based on my previous analysis relating higher oil prices to higher gasoline costs. That is a more than 17 percent increase in the average price of a gallon of gas as of May 13, 2024.

Further, due to energy’s ubiquitous use, prices would also increase for a wide range of goods such from cell phones to groceries, as well as services, particularly heating and cooling our homes. These higher costs will diminish national economic growth and reduce economic opportunities.

Making matters worse, climate litigation deters companies and investors from allocating their capital toward developing potential clean energy innovations. The deterrent is even larger because technologies that were once heralded as important sources of low-emission energy now face the same serious litigation exposure.

For instance, increasing use of natural gas is an important reason why carbon emissions have been declining over the past twenty years. However, natural gas producers are still targeted in these lawsuits. Given the pollution associated with all energy sources – including solar and wind – the lawsuits send an anti-innovation signal to all potential energy entrepreneurs.

Then there is the lawsuits’ hypocrisy. For example, the California attorney general claims he wants to punish fossil fuel companies because the companies allegedly knew that global climate change was a risk but intentionally hid these risks from the public. But California, the U.S. Government, and governments around the world were also well aware of these risks.

Suing fossil fuel producers for the costs of climate change is economically
damaging, environmentally suspect, and based on dubious claims.

It will also harm families, particularly working families, at a time when they are already struggling with the high cost of living. Ultimately, there are many serious adverse consequences from state and local litigation against traditional energy companies, but no economic upsides should the plaintiffs prevail.

Climate Activists storm the bastion of Exxon Mobil, here seen without their shareholder disguises.


DOJ Sues Against Minnesota’s Climate Lawsuit

Climate Change Dispatch reports DOJ Sues Minnesota Over State Climate Lawsuit Targeting Energy Companies.  Excerpts in italics with my bolds and added images.

Justice Department argues the state case oversteps federal authority,
seeks to reshape national energy policy.

The complaint, filed Monday, May 4, in the U.S. District Court for the District of Minnesota, accuses state officials of trying to impose their own climate policies on domestic energy producers in a way the DOJ says burdens national energy development and intrudes on federal authority.

The underlying lawsuit was filed in 2020 by Minnesota Attorney General Keith Ellison against Exxon Mobil, the American Petroleum Institute, Koch Industries, and Koch subsidiary Flint Hills Resources.

Minnesota brought the case under state consumer-protection laws, alleging that the companies engaged in fraud and deceptive business practices by misleading the public about “climate change and the role of fossil-fuel products in climate change.”

That lawsuit remains pending after years of procedural fights over whether it belongs in state or federal court.

Minnesota succeeded in keeping the case in state court in 2024, after the U.S. Supreme Court declined to review a lower-court ruling allowing the lawsuit to proceed there.

In its new complaint, the DOJ argues that authority over national energy policy
and major questions involving greenhouse gas emissions rests
with the federal government, not individual states.

The department is asking the court to block Minnesota from pursuing the 2020 lawsuit and prevent the state from bringing similar litigation in the future.

“Climate change lawsuits, like Minnesota’s, artfully plead around federal law while transparently seeking to change national energy policy related to global greenhouse gas emissions and to regulate conduct beyond local borders,” the complaint states.

The federal government’s move to counter climate litigation with its own lawsuit follows an executive order issued last year by President Donald Trump, who directed the DOJ to “take all appropriate action to stop” state lawsuits seeking to “dictate national energy policy.”

Associate Attorney General Stanley Woodward said in a statement:

“President Trump promised to unleash American energy dominance, and Minnesota officials cannot undermine his directive by mandating that their woke climate preferences become the uniform policy of our Nation,”

“Imagine an argument so airtight about science so settled
over technology so reliable that you have to use censorship
to make sure nobody gives a dissenting opinion.”  @ProctorZ

US to Partner Belgian Nuclear Power Revival

BREAKING: U.S. Unleashes $10 Billion Nuclear Shockwave To Revive Belgium’s Energy!

Mackenzie Web reports on an announcement in Belgian news site La Libre “The United States wants to help Belgium restart its nuclear power plants, Donald Trump is fully behind the project” (translation) Excerpts in italics with my bolds and added images.

In a bold revelation, U.S. Ambassador to Belgium Bill White announced a game-changing investment plan that shifts the energy landscape of Europe. America is prepared to finance up to 50 percent of new nuclear reactor construction in Belgium, potentially injecting $10 billion into this initiative. His remarks, delivered to the Belgian newspaper La Libre, signal a renewed focus on nuclear energy as a reliable power source. White, clearly aligned with Trump’s energy strategy, stated,

“Washington is all-in on helping Belgium reverse decades of suicidal green phase-out madness.”

Several MEPs (mainly Greens) hold up anti-nuclear posters at EU debate.

This renewed commitment comes at a pivotal time for Belgium as it seeks to reclaim its energy independence. The country’s new right-leaning government, led by Prime Minister Bart De Wever, is actively nationalizing its nuclear fleet and abandoning plans to decommission existing reactors. No longer willing to rely on inconsistent renewable energy sources, Belgium is stepping back into its nuclear past, which had been shunned during years of leftist climate policies prioritizing wind and solar over proven energy sources. As White puts it, the reality of energy security is finally sinking in.

American companies Westinghouse and GE Vernova are set to lead the charge in this nuclear renaissance. Westinghouse’s AP1000 reactor, equipped with advanced passive safety features, promises a safer, more efficient alternative to outdated technologies previously favored in Europe. With an impressive capability for 72 hours of blackout protection, this reactor is already in operation in the U.S. and China, demonstrating its reliability. Similarly, GE Vernova’s BWRX-300 small modular reactor boasts rapid deployment capabilities, making it a perfect fit for Belgium’s urgent energy needs.

BWRX-300 Small Modular Reactor | GE Vernova Hitachi

The significance of this investment stretches beyond economics; it also reinforces America’s longstanding alliance with Belgium. White highlighted that this initiative harkens back to an 80-year partnership where the Belgian Congo’s uranium was pivotal in America’s atomic endeavors during World War II. The contribution of Belgian resources in winning past conflicts illustrates the strategic bonds between the two nations, and today’s nuclear cooperation continues that legacy. As White emphasizes, this is not merely a financial deal—it is a calculated move toward mutual security, ensuring that European nations can break away from fluctuating foreign energy supplies.

Moreover, this initiative marks a decisive pivot from recent energy decisions that left European nations vulnerable. The reliance on Russian and Middle Eastern sources has proven costly and unstable, especially amid geopolitical tensions. White asserts that under this new agreement, Belgium can expect “no more blackouts” and “no more skyrocketing bills,” fundamentally changing the energy conversation in Europe. With the U.S. stepping up to fill this critical void, the interests of American energy innovation directly align with the needs of a nation seeking stability.

In summation, this announcement is a shot across the bow to proponents of renewable energy who have long championed policies ignoring the realities of energy demand and practicality. The message is clear: America is not just offering financial assistance; it is providing a framework for a robust nuclear future. While globalists may resist this trend, the power of American engineering and technology is poised to reshape Belgium’s energy landscape, ensuring real leadership is showcased on the world stage. The green dream is receding, while the nuclear renaissance emerges, casting doubt on the feasibility of relying solely on renewables.

How Past EPA Funded Activists, Wasteful Green Schemes

Bradley Jaye explains the news in Climate Change Dispatch article EPA Head Details How Tax Dollars Funded Activists, Wasteful Green Schemes.  Excerpts in italics with my bolds and added images.

Zeldin explains how EPA grants cycled through multiple groups,
each taking a cut, before funding more activist groups.

Environmental Protection Agency (EPA) Administrator Lee Zeldin revealed how federal dollars spent on “environmental justice” often perpetuate a wasteful yet lucrative cycle of environmental activism. [some emphasis, links added]

Zeldin explained on The Alex Marlow Show how his agency has stopped the scamming by slashing wasteful spending, creating savings far beyond the EPA’s annual budget.

“It’s the principle that there needs to be a zero tolerance policy for any waste and abuse,” Zeldin told host Alex Marlow. “It’s also the principle of being able to do more with less, and we proved over the course of our first 15 months here that we can achieve extraordinary savings here at the agency.”

EPA’s annual operating budget at the time of Zeldin’s arrival was “about $10 billion,” yet he said, “Over the first year that I was in this position, we saved $30 billion.”

“In 2024, this agency obligated and spent over $60 billion, and we were able to cancel grants and contracts. We did real estate consolidation [and] staff efficiencies with an agency-wide reorganization,” he explained. “We closed an EPA museum that nobody knew about or almost no one even visited.”

Zeldin pointed to an exchange with Senator Sheldon Whitehouse (D-RI) in a congressional hearing regarding wasteful solar grants that the self-proclaimed climate change champion supported.

“We had examples where the grant was going through up to four different pass-throughs, where each pass-through entity was getting at least 15% to administer their part of the pass-through,” Zeldin said. “I mean, a lot of this is just inexcusable.”

“The money that gets appropriated in the name of environmental justice to remediate an environmental issue, but then the dollar goes to an activist group to train other activist groups to come to D.C. and advocate for the next dollar to go to them to go out and be activists, like, wait, I thought we were spending this dollar to remediate an environmental issue,” he explained further.

“So yeah, it’s about doing more with less, and we have found extraordinary ways to save the taxpayers tens of billions of dollars.”

See Also

How Wasteful is Green Energy? Count the Ways


UN Climate Panel Quietly Admits Its Doomsday Climate Scenarios Were ‘Implausible’

Tyler Durden writes at ZeroHedge UN Climate Panel Quietly Admits Its Doomsday Climate Scenarios Were ‘Implausible‘. excerpts in italics with my bolds and added images.

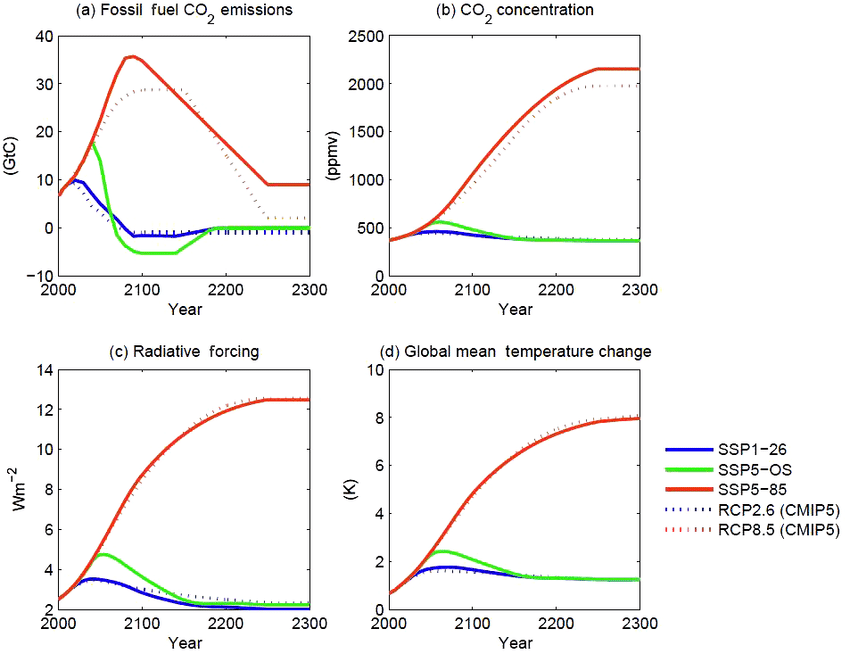
The IPCC has published a new generation of climate scenarios – and buried in the fine print is a remarkable concession: the extreme warming pathways that dominated climate research, policy, and media coverage for decades were never actually plausible. It took a while to notice because almost no one in mainstream media bothered to report it.  Science policy analyst Roger Pielke Jr. wrote,

“The Intergovernmental Panel on Climate Change (IPCC) has just published the next generation of climate scenarios,” calling it “big news” that “eliminated the most extreme scenarios that have dominated climate research over much of the past several decades.” 

The conclusion was unambiguous. “The IPCC and broader research community has now admitted that the scenarios that have dominated climate research, assessment and policy during the past two cycles of the IPCC assessment process are implausible. They describe impossible futures.”

https://rclutz.com/wp-content/uploads/2020/07/co-2-emissions-a-and-concentrations-b-anthropogenic-radiative-forcing-c-and.png

Those “impossible futures” formed the backbone of a decade-plus of apocalyptic climate messaging – melting ice caps, submerged coastlines, mass extinctions, widespread crop failures, and global hunger, always around the corner, always demanding immediate, economy-reshaping action to avert a catastrophe that, it now turns out, the underlying science community had assigned to a category closer to science fiction than projection.

The new IPCC framework formally demotes its remaining “HIGH scenario” from expected outcome to “exploratory – a thought experiment, not a projection.” [SSP5-85]

That’s a significant institutional retreat. 

https://rclutz.com/wp-content/uploads/2020/12/pielkejr.2020-fig1.png?w=1000

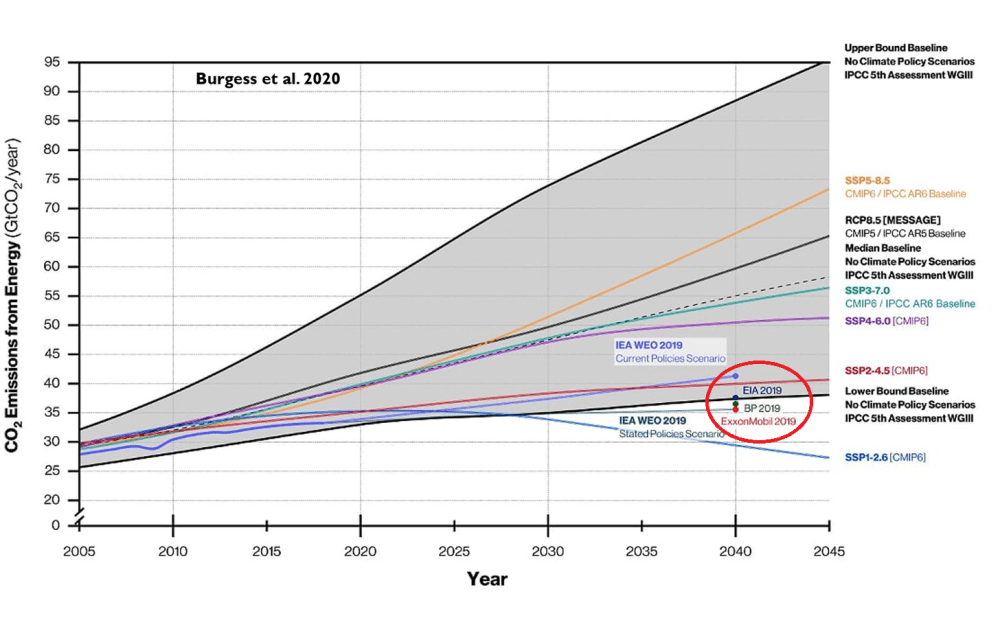
Pielke noted that the previous framework lacked “any systematic effort to evaluate plausibility of scenarios,” meaning the scariest pathways were able to dominate the policy debate for years without anyone in the room applying a basic reality check.

What matters today is that the group with official responsibility for developing climate scenarios for the IPCC and broader research community has now admitted that the scenarios that have dominated climate research, assessment and policy during the past two cycles of the IPCC assessment process are implausible. They describe impossible futures.

Curiously, the revised framework was technically adopted back in 2021, but has only now filtered into public view as related technical and institutional changes caught up. And it’s fair to ask why. The policy consequences of those “impossible futures” were very real.

As the Daily Sceptic’s Chris Morrison opines

It cannot be over-emphasised how important this finding of implausibility is. It means that almost every fearmongering mainstream media climate headline and story that has been written over the last 15 years is junk. Of course it also explains why a growing band of sceptical commentators have refused to accept the political concept of ‘settled’ science and have engaged in widespread debunking. Shooting fish in a barrel is one way of describing this work. At times, with just a modicum of investigative scepticism, the stories can be seen as little more than an insult to average human intelligence.

When the RCP8.5 assumptions are loaded into computer models, they run politically-convenient red hot suggestions that the temperature in 2100 will rise by about 4°C from a 1850-1900 baseline – in other words, a rise of nearly 3°C in the next 80 years. Only the most deranged eco loons will claim such large short-term rises out loud, so the activist scientists quietly loaded garbage assumptions into their computers to arrive at their garbage-out Armageddon scares. The writing was on the wall for RCP8.5 last year when President Trump’s executive order titled ‘Restoring Gold Standard Science’ effectively banned the use of RCP8.5 for scientists on the United States federal payroll. It also noted one of the unrealistic RCP8.5 assumptions driving deliberate climate psychosis to be that end-of-century coal use will exceed estimates of recoverable reserves.

At the time, the climate researcher Zeke Hausfather dismissed the Trump Administration’s claims about RCP8.5 by stating that the research community had moved on. But Pielke has taken issue with this ‘nothing to see here’ claim. He states that from 2018 to 2021, Google Scholar reported 17,000 articles published using RCP8.5 compared with 16,900 in the next three year period. “Some shift,” he observed.

Again, those using less charitable words might note that the ultimate climate crackpipe has proved difficult to put down. A long and painful process of rehabilitation now seems likely.

Free Climate Infographics at World of CO2 2026 Update

https://rclutz.com/wp-content/uploads/2023/01/dont-know-dont-be-scared.png

Many of my posts include some high quality infographics produced by a colleague, Raymond Inauen of RIC-Communications.  In 2024 because of other pressing time demands, Raymond discontinued the website he set up to host the infographics.  This post is to announce that he has now reactivated the  website up for the public to access a series of infographics regarding CO2 and climate science.

The Website content is:

The World of CO2


Readers will be aware of previous posts on the four themes to be discovered.  Raymond introduces this resource in this way:

WELCO₂ME

Would you like to learn more about CO₂ so you can have informed conversations about climate policy and future energy investments? Or would you rather pass judgment on CO₂ after learning about the basics? Then this is the website for you.

There are 29 infographic images that can be downloaded in four PDF files.  Thanks again, Raymond for your interest and efforts to make essential scientific information available to one and all. PDF links are in red.

There are 29 infographic images that can be downloaded in four PDF files. Thanks again, Raymond for your interest and efforts to make essential scientific information available to one and all. PDF links are in red.

World of CO2: CO2 charts

Example (#8 of 14)


World of CO2: Climate Change Charts

Example (#5 of 6)

 World of CO2: The World of Energy Charts

Example (#7 of 7)

World of CO2: World of Ice Ages Charts

Example (#1 of 2)

The World of CO2 home page is:

The World of CO2

At that website the high resolution infographic PDFs can be downloaded at no charge with no restrictions on use. There are also informative videos and FAQ pages, as well as links to contact with questions, comments or additional suggestions. There is also a link to support this work if you are so inclined.

What Coal Did Today

Frank Clemente and Fred Palmer remind us how essential is coal power with their Real Clear Energy article What Coal Did Today.  Text is below with my bolds and added images.

Coal has been the material foundation of industrialization, urbanization, modernization and technological development for more than two centuries. The examples are endless. It was coal that propelled the Industrial Revolution in England that spread throughout the world. It was coal that provided the electrification of virtually every society.

Progress of civilization through changing mixes of energy sources.

Coal was the foundational fuel for the electrification of the Tennessee Valley Authority and brought myriad associated benefits to the cities, towns and farms across the entire American landscape. It was coal that powered the Transcontinental Railroad and the steamships that traversed every ocean. Coal produced the steel that enabled the skyscrapers, bridges, hospitals, highways, dams. irrigation systems and power plants. Steel remains the backbone of practically every home, factory, school and hospital.

And it was coal that provided the means to lift millions upon millions out of poverty and extended human existence to enjoy a higher quality of life. It is no coincidence that the U.S. increase in life expectancy from 48 in 1900 to 77 in 2000 was highly correlated with the rise of coal-based electricity. No wonder that the National Academy of Engineering (NAE) identified “electrification” as the greatest engineering achievement of the 20th century.

But coal is far more than history. It is a current global reality,
improving the daily lives of billions of people throughout the world.

Consider the continuing role coal plays in the largest urbanizing society in the world—comprising 1.5 Billion people—nearly 20%% of the global population:

India: coal generates 75% of electricity, produces over 80% of steel and the vast majority of cement. India’s urban population is projected to grow by an incredible 400 million people by 2050, resulting in over 900 million living in cities, The World Bank has warned that 50% of the necessary urban infrastructure for 2050 has not yet built. Coal is the sine qua non of that growth.

As a result, India’s installed crude steel capacity of about 180 million metric tons in fiscal year 2025 is set to grow, reaching up to 280 million metric tons by 2035 alone.

And the beat goes on, By 2050, 68% of the world’s population is projected to live in urban areas, adding approximately 2.5 billion people to cities, some 80 million a year, 220,000 each day, 9,000 per hour and 190 new urbanites every single minute 24/7 for 24 years.

And we don’t need coal?

IBM Shareholders Get Climate/AI Bias Alert (Milloy)

Milloy reads AI bias/climate riot act to IBM management at annual shareholder meeting.  Here is the media release and audio presentation for the IBM shareholder proposal of the Free Enterprise Project of the National Center for Public Policy Research. The annual shareholder meeting is April 28, 2026. Text of press release below with my bolds and added images.

Press Release: IBM’s AI Model: Garbage In, Garbage Out

Washington, D.C. – At next week’s IBM annual meeting, shareholders will vote on a proposal from the National Center for Public Policy Research’s Free Enterprise Project (FEP) tackling potential bias within the company’s artificial intelligence models.

Proposal 7 (“AI Bias Audit”) requests “a report, within the next year, on the methods used to eliminate bias from the Company’s artificial intelligence (AI) models.”

At the April 28 meeting, FEP Executive Director Steve Milloy will cite climate alarmism as an example of where AI too often gets it wrong:

I am an AI user and it can be a great tool. But AI is subject to what 1950s IBM programmer George Fuechsel called “GIGO” – garbage in, garbage out. The Internet is full of amazing information. It is also full of amazing garbage. AI models often cannot distinguish between the two.

An example of garbage-in, garbage-out AI occurs in the controversial area of global warming and climate change. Here are three hardcore facts about climate:

♦  It cannot be scientifically demonstrated that greenhouse gas emissions have had
any effect on global climate.
♦  Emissions-driven climate models do not work.
♦  No emissions-based apocalyptic climate prediction has ever come true.

Despite these realities, if you query IBM AI on climate, you will get back gloom-and-doom climate hoax dogma. This happens because the Internet has been loaded for decades with bogus climate hoax claims and assumptions that are erroneous garbage.

Milloy believes IBM’s own website is partly to blame for this misinformation:

On IBM’s website, IBM’s chief sustainability officer says, for example, that:

Global warming is “leading to increased flooding, causing heat stroke and destroying farms and livelihoods. Insurance is becoming unaffordable.”

None of that is true. But it is what IBM AI is programmed with. Even IBM staff has been polluted with the climate. It is precisely the sort of garbage that George Fueschsel warned about.

The mindless parroting of climate hoax garbage to governments, businesses and the public has had devastating economic and societal impacts around the world – from wars to inflation to deadly energy failures to energy rationing to crop failures to deindustrialization to lost jobs to wasted taxpayer money to traumatized school children and beyond.

It has been estimated that world has wasted $10 trillion chasing the climate hoax narrative since 2015 alone. The list of harms from the climate hoax is endless. Yet IBM AI has learned the hoax and spreads the climate garbage on to users. Milloy will say:

“While IBM may be great at the computing part of AI, the world actually functions on realities that are often lost in the Internet dumpster,”  “Management needs to be much more humble about all this. It needs to take the bias problem seriously. Touchy-feely videos on the IBM website just don’t cut it.”

IBM shareholders can support Proposal 7 by voting their proxies before Tuesday’s meeting.


March 2026 Mild Warming SSTs Continue

The best context for understanding decadal temperature changes comes from the world’s sea surface temperatures (SST), for several reasons:

  • The ocean covers 71% of the globe and drives average temperatures;
  • SSTs have a constant water content, (unlike air temperatures), so give a better reading of heat content variations;
  • A major El Nino was the dominant climate feature in recent years.

Previously I used HadSST3 for these reports, but Hadley Centre has made HadSST4 the priority, and v.3 will no longer be updated.  This February report is based on HadSST 4, but with a twist. The data is slightly different in the new version, 4.2.0.0 replacing 4.1.1.0. Product page is here.

The Current Context

The chart below shows SST monthly anomalies as reported in HadSST 4.2 starting in 2015 through February 2026. A global cooling pattern is seen clearly in the Tropics since its peak in 2016, joined by NH and SH cycling downward since 2016, followed by rising temperatures in 2023 and 2024 and cooling in 2025, now with a mild rising in 2026.


Note that in 2015-2016 the Tropics and SH peaked in between two summer NH spikes.  That pattern repeated in 2019-2020 with a lesser Tropics peak and SH bump, but with higher NH spikes. By end of 2020, cooler SSTs in all regions took the Global anomaly well below the mean for this period.  A small warming was driven by NH summer peaks in 2021-22, but offset by cooling in SH and the tropics, By January 2023 the global anomaly was again below the mean.

Then in 2023-24 came an event resembling 2015-16 with a Tropical spike and two NH spikes alongside, all higher than 2015-16. There was also a coinciding rise in SH, and the Global anomaly was pulled up to 1.1°C in 2023, ~0.3° higher than the 2015 peak.  Then NH started down autumn 2023, followed by Tropics and SH descending 2024 to the present. During 2 years of cooling in SH and the Tropics, the Global anomaly came back down, led by Tropics cooling from its 1.3°C peak 2024/01, down to 0.6C in September this year. Note the smaller peak in NH in July 2025 now declining along with SH and the Global anomaly cooler as well. In December the Global anomaly exactly matched the mean for this period, with all regions converging on that value, led by a 6 month drop in NH.  Now in 2026 the first 3 months show a mild warming in all regions, in March approximately matching values 3 years ago, 03/2023 before the warming spike.

Comment:

The climatists have seized on this unusual warming as proof their Zero Carbon agenda is needed, without addressing how impossible it would be for CO2 warming the air to raise ocean temperatures.  It is the ocean that warms the air, not the other way around.  Recently Steven Koonin had this to say about the phonomenon confirmed in the graph above:

El Nino is a phenomenon in the climate system that happens once every four or five years.  Heat builds up in the equatorial Pacific to the west of Indonesia and so on.  Then when enough of it builds up it surges across the Pacific and changes the currents and the winds.  As it surges toward South America it was discovered and named in the 19th century  It iswell understood at this point that the phenomenon has nothing to do with CO2.

Now people talk about changes in that phenomena as a result of CO2 but it’s there in the climate system already and when it happens it influences weather all over the world.   We feel it when it gets rainier in Southern California for example.  So for the last 3 years we have been in the opposite of an El Nino, a La Nina, part of the reason people think the West Coast has been in drought.

It has now shifted in the last months to an El Nino condition that warms the globe and is thought to contribute to this Spike we have seen. But there are other contributions as well.  One of the most surprising ones is that back in January of 2022 an enormous underwater volcano went off in Tonga and it put up a lot of water vapor into the upper atmosphere. It increased the upper atmosphere of water vapor by about 10 percent, and that’s a warming effect, and it may be that is contributing to why the spike is so high.

A longer view of SSTs

To enlarge, open image in new tab.

The graph above is noisy, but the density is needed to see the seasonal patterns in the oceanic fluctuations.  Previous posts focused on the rise and fall of the last El Nino starting in 2015.  This post adds a longer view, encompassing the significant 1998 El Nino and since.  The color schemes are retained for Global, Tropics, NH and SH anomalies.  Despite the longer time frame, I have kept the monthly data (rather than yearly averages) because of interesting shifts between January and July. 1995 is a reasonable (ENSO neutral) starting point prior to the first El Nino.

The sharp Tropical rise peaking in 1998 was dominant in the record, starting Jan. ’97 to pull up SSTs uniformly before returning to the same level Jan. ’99. There were strong cool periods before and after the 1998 El Nino event. Then SSTs in all regions returned to the mean in 2001-2.

SSTS fluctuate around the mean until 2007, when another, smaller ENSO event occurs. There is cooling 2007-8,  a lower peak warming in 2009-10, following by cooling in 2011-12.  Again SSTs are average 2013-14.

Now a different pattern appears.  The Tropics cooled sharply to Jan 11, then rise steadily for 4 years to Jan 15, at which point the most recent major El Nino takes off.  But this time in contrast to ’97-’99, the Northern Hemisphere produces peaks every summer pulling up the Global average.  In fact, these NH peaks appear every July starting in 2003, growing stronger to produce 3 massive highs in 2014, 15 and 16.  NH July 2017 was only slightly lower, and a fifth NH peak still lower in Sept. 2018.

The highest summer NH peaks came in 2019 and 2020, only this time the Tropics and SH were offsetting rather adding to the warming. (Note: these are high anomalies on top of the highest absolute temps in the NH.)  Since 2014 SH has played a moderating role, offsetting the NH warming pulses. After September 2020 temps dropped off down until February 2021.  In 2021-22 there were again summer NH spikes, but in 2022 moderated first by cooling Tropics and SH SSTs, then in October to January 2023 by deeper cooling in NH and Tropics.

Then in 2023 the Tropics flipped from below to well above average, while NH produced a summer peak extending into September higher than any previous year.  Despite El Nino driving the Tropics January 2024 anomaly higher than 1998 and 2016 peaks, following months cooled in all regions, and the Tropics continued cooling in April, May and June along with SH dropping.  After July and August NH warming again pulled the global anomaly higher, September through January 2025 resumed cooling in all regions, continuing February through April 2025, with little change in May,June and July despite upward bumps in NH. Now temps in all regions have cooled led by NH from August through December 2025. A mild warming in 2026 appears in all regions January through March.

What to make of all this? The patterns suggest that in addition to El Ninos in the Pacific driving the Tropic SSTs, something else is going on in the NH.  The obvious culprit is the North Atlantic, since I have seen this sort of pulsing before.  After reading some papers by David Dilley, I confirmed his observation of Atlantic pulses into the Arctic every 8 to 10 years.

Contemporary AMO Observations

Through January 2023 I depended on the Kaplan AMO Index (not smoothed, not detrended) for N. Atlantic observations. But it is no longer being updated, and NOAA says they don’t know its future.  So I find that ERSSTv5 AMO dataset has current data.  It differs from Kaplan, which reported average absolute temps measured in N. Atlantic.  “ERSST5 AMO  follows Trenberth and Shea (2006) proposal to use the NA region EQ-60°N, 0°-80°W and subtract the global rise of SST 60°S-60°N to obtain a measure of the internal variability, arguing that the effect of external forcing on the North Atlantic should be similar to the effect on the other oceans.”  So the values represent SST anomaly differences between the N. Atlantic and the Global ocean.

The chart above confirms what Kaplan also showed.  As August is the hottest month for the N. Atlantic, its variability, high and low, drives the annual results for this basin.  Note also the peaks in 2010, lows after 2014, and a rise in 2021. Then in 2023 the peak reached 1.4C before declining to 0.9 August 2026.  An annual chart below is informative:


Note the difference between blue/green years, beige/brown, and purple/red years.  2010, 2021, 2022 all peaked strongly in August or September.  1998 and 2007 were mildly warm.  2016 and 2018 were matching or cooler than the global average.  2023 started out slightly warm, then rose steadily to an  extraordinary peak in July.  August to October were only slightly lower, but by December cooled by ~0.4C.

Then in 2024 the AMO anomaly started higher than any previous year, then leveled off for two months declining slightly into April.  Remarkably, May showed an upward leap putting this on a higher track than 2023, and rising slightly higher in June.  In July, August and September 2024 the anomaly declined, and despite a small rise in October, ended close to where it began.  Note 2025 started much lower than the previous year and headed sharply downward, well below the previous two years, then since April through September aligning with 2010. In October there was an unusual upward spike, now reversed down to match 2022 and 2016.  The orange 2026 line continues downward and is visible on top of 2016 purple line, well below the peak years of 2023 and 2024.

The pattern suggests the ocean may be demonstrating a stairstep pattern like that we have also seen in HadCRUT4.

The rose line is the average anomaly 1982-1996 inclusive, value 0.18.  The orange line the average 1982-2025, value 0.41 also for the period 1997-2012. The red line is 2015-2025, value 0.74. As noted above, these rising stages are driven by the combined warming in the Tropics and NH, including both Pacific and Atlantic basins.

Curiosity:  Solar Coincidence?

The news about our current solar cycle 25 is that the solar activity is hitting peak numbers now and higher  than expected 1-2 years in the future.  As livescience put it:  Solar maximum could hit us harder and sooner than we thought. How dangerous will the sun’s chaotic peak be?  Some charts from spaceweatherlive look familar to these sea surface temperature charts.

Summary

The oceans are driving the warming this century.  SSTs took a step up with the 1998 El Nino and have stayed there with help from the North Atlantic, and more recently the Pacific northern “Blob.”  The ocean surfaces are releasing a lot of energy, warming the air, but eventually will have a cooling effect.  The decline after 1937 was rapid by comparison, so one wonders: How long can the oceans keep this up? And is the sun adding forcing to this process?

uss-pearl-harbor-deploys-global-drifter-buoys-in-pacific-ocean

USS Pearl Harbor deploys Global Drifter Buoys in Pacific Ocean