Climatism and Virtual Virtues


Following an alert posted by Lubos Motl, I upgraded my windows operating system from #7 to #10, since the grace period is ending August 1. And it went quite smoothly in retrospect, but with much anxiety in the process. It seems that Windows Defender latest version doesn’t play as nice with other anti-malware programs. Also some head-scratching as to the usage of cpu by strangely named programs that may or may not be malware. And there are the inevitable hiccups and tweaks needed to restore operations as before.

It occurred to me in this process that the internet and the associated tools have become for us a kind of utility, like electricity. When we flip the light switch, the room should light up. And when we boot up our home computers, we expect to be on line and wired in. Any upgrade introduces uncertainty into that dependency, and is uncomfortable.

It also reflects on how much we modern urban dwellers exist within a cocoon of man-made structures, both physical and cyberspace. Extrapolating from our daily experience, it is a small step to thinking that the larger environment beyond our cocoons, if not entirely man-made, is at least hugely subject to human influence. And from that premise comes the climatism faith: the belief that mother Nature is being ruined by humans burning fossil fuels, that the planet will burn up, glaciers will melt, cities and islands will submerge, etc. etc. etc.

For centuries those who farm or otherwise make a living from the land or ocean have accepted and adapted to the uncertainties of weather and variable harvests. They are among the most skeptical concerning man-made climate change.

But the majority of university educated urban dwellers are converts to climatism, and participate more or less in a range of Virtual Virtues; i.e. Supporting abstract causes to protect Nature from humans. Some examples:
Save the Arctic: Support Greenpeace.:
Stop Rising CO2: Support 350.org.
Save Animals from extinction: Support WWF.
Etc.

These and other variations of “fighting Climate Change” give the illusion of “making a difference”, and thus feeling good about doing good. It is truly not about Science any more, it is about being Virtually Virtuous.

Footnote: In his lifetime, Marshall McLuhan foresaw the rise of the Global Village along with the return of tribalism, pre-conditions for the present obsession with climatism. Quotations:

“All media are extensions of some human faculty-psychic or physical.”

“The new electronic interdependence recreates the world in the image of a global village.”

“The world is now like a continually sounding tribal drum, where everybody gets the message…. all the time.”

“Our technology forces us to live mythically.”

“Politics will eventually be replaced by imagery.  The politician will be only too happy to abdicate in favor of his image, because the image will be much more powerful than he could ever be.”

“The more you create village conditions, the more discontinuity and division and diversity. The global village absolutely insures maximal disagreement on all points. It never occurred to me that uniformity and tranquility were the properties of the global village. It has more spite and envy. The spaces and times are pulled out from between people. A world in which people encounter each other in depth all the time. The tribal-global village is far more divisive — full of fighting — than any nationalism ever was. Village is fission, not fusion, in depth all the time.” (McLuhan “The Hot and Cool Interview” 57–58)

That full interview is the best summary of McLuhan’s views and is here.

Climate Lemmings (h/t Beth)


Arctic Ice Outlook July 20

For a change, note the Arctic ice chart above from AARI, the Arctic and Antarctic Research Institute, St. Petersburg, Russia.  Based upon such information, they are holding up the Polar Ocean Challenge exploration ship at Murmansk because of too much ice in the Northern Sea Route.  Any excessive delay puts at risk their plan to circumnavigate the North Pole counterclockwise, starting in Bristol, UK.

So what is going on with Arctic ice, and what is the outlook?

Half of the maximum ice extent is gone as of yesterday, and in a typical year, one third will remain when melting stops in September.  Remember that the days are already shortening while the warming momentum will take 2 more months to cease.  So 2016 started with about 15M km2 of ice, is now at 7.5M and is likely to end up about 5M km2.

The Sea Ice Prediction Network (SIPN) gathers forecasts using various methods and in June provided their first of three estimates of the September monthly average Arctic ice extent, as reported by NSIDC Sea Ice Index (produced by NOAA).


The median Outlook value for September 2016 sea ice extent is 4.28 million square kilometers with quartiles of 4.10 and 4.63 million square kilometers (See Figure 1 in the full report, below). Contributions are based on a range of methods: statistical, dynamical models, estimates based on trends, and two informal polls.

The median Outlook value is also down from last year by more than 700,000 square kilometers. This year’s forecast compares to observed values of 4.3 million square kilometers in 2007, 3.6 million square kilometers in 2012, and 4.63 million square kilometers in 2015. Only one forecast suggests a new record low is possible, one ties with 2012, while all others do not forecast a new record low for 2016. (No forecast from Peter Wadhams is included this year.)

In the chart below MASIE shows 2016 Mid-July  Arctic ice extent has slipped below average and 2015. SII is back on line and was reporting similar extents during June (as it has in the past).  But in July SII was showing ~400k km2 less ice most days, but is now aligned with MASIE.  (SII and MASIE comparison is here.)

MASIE 2016 day202

At the present pace of declining ice extents, 2016 is running five days ahead of the ten-year average, and seven days ahead of 2015.  By the end of July, both the average and 2015 ice extents will be about 7M km2, so a loss of 1M or more in the next 10 days.

.

Comparing the Arctic ice extents with their maximums shows the melting is occurring mostly in the marginal seas, now including Kara Sea as expected in July.

2016202 NH Max Loss % Loss Sea Max % Total Loss
 (0) Northern_Hemisphere 7577692 50.26% 100%
 (1) Beaufort_Sea 367069 34.29% 5%
 (2) Chukchi_Sea 311512 32.25% 4%
 (3) East_Siberian_Sea 185840 17.09% 2%
 (4) Laptev_Sea 108421 12.08% 1%
 (5) Kara_Sea 808138 86.43% 10%
 (6) Barents_Sea 599344 99.99% 8%
 (7) Greenland_Sea 440533 66.78% 6%
 (8) Baffin_Bay_Gulf_of_St._Lawrence 1451812 88.28% 18%
 (9) Canadian_Archipelago 246806 28.93% 3%
 (10) Hudson_Bay 1044475 82.84% 13%
 (11) Central_Arctic 158032 4.87% 2%
 (12) Bering_Sea 768232 100.00% 10%
 (13) Baltic_Sea 97582 100.00% 1%
 (14) Sea_of_Okhotsk 1308697 100.00% 17%

It is clear from the above that the bulk of ice losses are coming from Okhotsk, Barents and Bering Seas (100% melted), along with Kara Sea, Hudson Bay and Baffin Bay-St. Lawrence (67+% melted).  All of them are marginal seas that will go down close to zero by September.  Note: Some seas are not at max on the NH max day.  Thus, totals from adding losses will vary from NH daily total.

CPC shows the Arctic Oscillation waffling between positive and negative values, recently positive and forecasted to near neutral. Generally, positive AO signifies lower pressures over Arctic ice, with more cloud, lower insolation and less melting.  The outlook at this point is mixed.

September Minimum Outlook

Historically, where will ice be remaining when Arctic melting stops? Over the last 10 years, on average MASIE shows the annual minimum occurring about day 260. Of course in a given year, the daily minimum varies slightly a few days +/- from that.

For comparison, here are sea ice extents reported from 2007, 2012, 2014 and 2015 for day 260:

Arctic Regions 2007 2012 2014 2015
Central Arctic Sea 2.67 2.64 2.98 2.93
BCE 0.50 0.31 1.38 0.89
Greenland & CAA 0.56 0.41 0.55 0.46
Bits & Pieces 0.32 0.04 0.22 0.15
NH Total 4.05 3.40 5.13 4.44

Notes: Extents are in M km2.  BCE region includes Beaufort, Chukchi and Eastern Siberian seas. Greenland Sea (not the ice sheet). Canadian Arctic Archipelago (CAA).  Locations of the Bits and Pieces vary.

As the table shows, low NH minimums come mainly from ice losses in Central Arctic and BCE.  The great 2012 cyclone hit both in order to set the recent record. The recovery since 2012 shows in 2014, with some dropoff last year, mostly in BCE.

Summary

We are well into the melt season, and the resulting minimum will depend upon the vagaries of weather between now and September.  Early on, 2016 was slightly higher than 2015 in March, lower in May and now tracking slightly below the past.  Note: 2016 melt season is starting without the Blob, with El Nino over, and a cold blob in the North Atlantic.  The AO has been hovering around neutral, now possibly indicating cloud cover reducing the pace of melting.

Meanwhile we can watch and appreciate the beauty of the changing ice conditions.


Arctic Reflection: Clouds replace snow and ice as solar reflector NASA photo

Footnote:  Regarding the colder than normal water in the North Atlantic

A 2016 article for EOS is entitled Atlantic Sea Ice Could Grow in the Next Decade

Changing ocean circulation in the North Atlantic could lead to winter sea ice coverage remaining steady and even growing in select regions.

The researchers analyzed simulations from the Community Earth System Model, modeling both atmosphere and ocean circulation. They found that decadal-scale trends in Arctic winter sea ice extent are largely explained by changes in ocean circulation rather than by large-scale external factors like anthropogenic warming.

From the Abstract of Yeager et al.

We present evidence that the extreme negative trends in Arctic winter sea-ice extent in the late 1990s were a predictable consequence of the preceding decade of persistent positive winter North Atlantic Oscillation (NAO) conditions and associated spin-up of the thermohaline circulation (THC). Initialized forecasts made with the Community Earth System Model decadal prediction system indicate that relatively low rates of North Atlantic Deep Water formation in recent years will result in a continuation of a THC spin-down that began more than a decade ago. Consequently, projected 10-year trends in winter Arctic winter sea-ice extent seem likely to be much more positive than has recently been observed, with the possibility of actual decadal growth in Atlantic sea-ice in the near future.

Arctic Ice Watch Mid-July

In the chart below MASIE shows 2016 Mid-July  Arctic ice extent has slipped below average and 2015. SII is back on line and was reporting similar extents during June (as it has in the past).  But in July SII is showing ~400k km2 less ice most days. (SII and MASIE comparison is here.)

MASIE 2016 day197

Looking into the details, some marginal seas are melting earlier than last year, while the central, enduring ice pack is relatively unaffected.  Despite greater losses in Okhotsk, 2016 ice extent in June is fairly ordinary with slight differences across the regions.  At the present pace of declining ice extents, 2016 is running three days ahead of the ten-year average, and seven days ahead of 2015.

US Navy predicts summer ice free Arctic by 2016 Greenpeace icebreaking ship, Arctic Sunrise, among broken floes of Arctic sea ice, photographed from the air. This image was taken in the Fram Strait. Good to see Greenpeace doing their bit to create more open water.

US Navy predicts summer ice free Arctic by 2016. Greenpeace icebreaking ship, Arctic Sunrise, among broken floes of Arctic sea ice, photographed from the air. This image was taken in the Fram Strait. Greenpeace doing their bit to create more open water.

As the chart below shows, the seas most down from average this year are Kara, Barents, Greenland Sea and Baffin Bay.  Meanwhile higher extents are showing in Chukchi, Laptev, and Hudson Bay, resulting in 2016 slightly below average. Beaufort Sea has returned to average after a weather event in June reduced ice by more than 150k km2.

Region 2016197 Day 197 Average 2016-Ave.
 (0) Northern_Hemisphere 8139126 8345952 -206826
 (1) Beaufort_Sea 844302 839527 4775
 (2) Chukchi_Sea 698967 632572 66395
 (3) East_Siberian_Sea 940706 944437 -3731
 (4) Laptev_Sea 838590 592558 246032
 (5) Kara_Sea 155252 371043 -215791
 (6) Barents_Sea 35 54678 -54642
 (7) Greenland_Sea 228393 428257 -199865
 (8) Baffin_Bay_Gulf_of_St._Lawrence 201400 272271 -70872
 (9) Canadian_Archipelago 684418 709717 -25299
 (10) Hudson_Bay 445064 316953 128111
 (11) Central_Arctic 3100876 3178016 -77140
 (12) Bering_Sea 0 1600 -1600
 (13) Baltic_Sea 0 2 -2
 (14) Sea_of_Okhotsk 0 3125 -3125

.

Comparing the Arctic ice extents with their maximums shows the melting is occurring mostly in the marginal seas, now including Kara Sea as expected in July.

2016197 NH Max Loss % Loss Sea Max % Total Loss
 (0) Northern_Hemisphere 6938473 46.02% 100%
 (1) Beaufort_Sea 226143 21.13% 3%
 (2) Chukchi_Sea 267022 27.64% 4%
 (3) East_Siberian_Sea 146414 13.47% 2%
 (4) Laptev_Sea 59220 6.60% 1%
 (5) Kara_Sea 779736 83.40% 11%
 (6) Barents_Sea 599344 99.99% 8%
 (7) Greenland_Sea 431320 65.38% 6%
 (8) Baffin_Bay_Gulf_of_St._Lawrence 1443182 87.75% 20%
 (9) Canadian_Archipelago 168760 19.78% 2%
 (10) Hudson_Bay 815807 64.70% 11%
 (11) Central_Arctic 145834 4.49% 2%
 (12) Bering_Sea 768232 100.00% 11%
 (13) Baltic_Sea 97582 100.00% 1%
 (14) Sea_of_Okhotsk 1308697 100.00% 18%

It is clear from the above that the bulk of ice losses are coming from Okhotsk, Barents and Bering Seas (100% melted),along with Kara Sea, Hudson Bay and Baffin Bay-St. Lawrence (65+% melted).  All of them are marginal seas that will go down close to zero by September.  Note: Some seas are not at max on the NH max day.  Thus, totals from adding losses will vary from NH daily total.

CPC shows the Arctic Oscillation waffling between positive and negative values, recently positive and forecasted to near neutral. Generally, positive AO signifies lower pressures over Arctic ice, with more cloud, lower insolation and less melting.  The outlook at this point is mixed.

September Minimum Outlook

Historically, where will ice be remaining when Arctic melting stops? Over the last 10 years, on average MASIE shows the annual minimum occurring about day 260. Of course in a given year, the daily minimum varies slightly a few days +/- from that.

For comparison, here are sea ice extents reported from 2007, 2012, 2014 and 2015 for day 260:

Arctic Regions 2007 2012 2014 2015
Central Arctic Sea 2.67 2.64 2.98 2.93
BCE 0.50 0.31 1.38 0.89
Greenland & CAA 0.56 0.41 0.55 0.46
Bits & Pieces 0.32 0.04 0.22 0.15
NH Total 4.05 3.40 5.13 4.44

Notes: Extents are in M km2.  BCE region includes Beaufort, Chukchi and Eastern Siberian seas. Greenland Sea (not the ice sheet). Canadian Arctic Archipelago (CAA).  Locations of the Bits and Pieces vary.

As the table shows, low NH minimums come mainly from ice losses in Central Arctic and BCE.  The great 2012 cyclone hit both in order to set the recent record. The recovery since 2012 shows in 2014, with some dropoff last year, mostly in BCE.

Summary

We are well into the melt season, and the resulting minimum will depend upon the vagaries of weather between now and September.  Early on, 2016 was slightly higher than 2015 in March, lower in May and now closing the gap. Note: 2016 melt season is starting without the Blob, with El Nino over, and a cold blob in the North Atlantic.  The AO has been hovering around neutral, now possibly indicating cloud cover reducing the pace of melting.

Meanwhile we can watch and appreciate the beauty of the changing ice conditions.


Arctic Reflection: Clouds replace snow and ice as solar reflector NASA photo

Footnote:  Regarding the colder than normal water in the North Atlantic

A 2016 article for EOS is entitled Atlantic Sea Ice Could Grow in the Next Decade

Changing ocean circulation in the North Atlantic could lead to winter sea ice coverage remaining steady and even growing in select regions.

The researchers analyzed simulations from the Community Earth System Model, modeling both atmosphere and ocean circulation. They found that decadal-scale trends in Arctic winter sea ice extent are largely explained by changes in ocean circulation rather than by large-scale external factors like anthropogenic warming.

From the Abstract of Yeager et al.

We present evidence that the extreme negative trends in Arctic winter sea-ice extent in the late 1990s were a predictable consequence of the preceding decade of persistent positive winter North Atlantic Oscillation (NAO) conditions and associated spin-up of the thermohaline circulation (THC). Initialized forecasts made with the Community Earth System Model decadal prediction system indicate that relatively low rates of North Atlantic Deep Water formation in recent years will result in a continuation of a THC spin-down that began more than a decade ago. Consequently, projected 10-year trends in winter Arctic winter sea-ice extent seem likely to be much more positive than has recently been observed, with the possibility of actual decadal growth in Atlantic sea-ice in the near future.

Climate Crisis Inc. Update


cov_en_1Five years ago Jo Nova provided a graphic displaying the workings of the Climate Scare Machine.  The figures are out-dated and this post is to update the growth of the Climate Crisis Industry and its outlook.

From Jo Nova (here) in 2010 dollars:
Climate Change Scare Machine Cycle: see how your tax dollars are converted into alarming messages

The money, power, and influence is vastly larger on the side that benefits from the alarm
On the skeptical side, Exxon chipped in all of $23 million over ten years, but it’s chump-change. The fossil fuel industry doesn’t like carbon legislation, but it’s not life or death, unlike the situation for wind and solar, which would be virtually wiped out without the subsidies provided by the scare.

The US government has poured in $79 billion and then some. But the pro-scare funding is pervasive: for example — the Australian government spent $14 million on a single Ad campaign, and another $90 million every year on a Department of Climate Change. The UK government paid for lobbyists to lobby it, and the BBC “partners” with the lobby groups. The EU doesn’t just subsidize renewables, it also pays them to push for more subsidies. Even the dastardly Exxon paid more than 20 times as much for a single renewables research project than it did to skeptics.

Last year in carbon markets $142 billion dollars turned over, and $243 billion was invested in renewables. If the carbon market idea went global it was projected to reach $2 trillion a year. Every banker and his dog has a bone in this game. Why wouldn’t they?

Industry 2015 Update from Climate Change Business Journal

(reported in Insurance Journal here).

Interest in climate change is becoming an increasingly powerful economic driver, so much so that some see it as an industry in itself whose growth is driven in large part by policymaking.

The $1.5 trillion global “climate change industry” grew at between 17 and 24 percent annually from 2005-2008, slowing to between 4 and 6 percent following the recession with the exception of 2011’s inexplicable 15 percent growth, according to Climate Change Business Journal.

The San Diego, Calif.-based publication includes within that industry nine segments and 38 sub-segments. This encompasses sectors like renewables, green building and hybrid vehicles.

That also includes the climate change consulting market, which a recent report by the journal estimates at $1.9 billion worldwide and $890 million in the U.S.

Included in this sub-segment, which the report shows is one of the fastest growing areas of the climate change industry, are environmental consultants and engineers, risk managers, assurance, as well as legal and other professional services.

Figures for the climate change consulting market are expected to more than double in the next five years, and the report’s authors believe the climate change industry as a whole will have an even steeper and faster growth trajectory than the environmental consulting industry – an industry that in 1976 had billings of $600 million and today generates $27 billion.

Paul Driessen puts the numbers in context (here).

The answer is simple. The annual revenue of the Climate Crisis & Renewable Energy Industry has become a $1.5-trillion-a-year business! That’s equal to the annual economic activity generated by the entire US nonprofit sector, or all savings over the past ten years from consumers switching to generic drugs. By comparison, revenue for the much-vilified Koch Industries are about $115 billion, for ExxonMobil around $365 billion.

According to a 200-page analysis by the Climate Change Business Journal, this Climate Industrial Complex can be divided into nine segments:

  • low carbon and renewable power;
  • carbon capture and storage;
  • energy storage, such as batteries;
  • energy efficiency;
  • green buildings;
  • transportation;
  • carbon trading;
  • climate change adaptation; and
  • consulting and research.

Consulting alone is a $27-billion-per-year industry that handles “reputation management” for companies and tries to link weather events, food shortages and other problems to climate change. Research includes engineering R&D and climate studies.

In other words, the current amount of annual spending is $1.5-trillion in the two boxes of Jo Nova’s diagram: Industrials and Financial Houses.  There’s additional money sloshing around in other boxes of the scare machine.

The $1.5-trillion price tag appears to exclude most of the Big Green environmentalism industry, a $13.4-billion-per-year business in the USA alone. The MacArthur Foundation just gave another $50 million to global warming alarmist groups. Ex-NY Mayor Michael Bloomberg and Chesapeake Energy gave the Sierra Club $105 million to wage war on coal (shortly before the Club began waging war on natural gas and Chesapeake Energy, in what some see as poetic justice). Warren Buffett, numerous “progressive” foundations, Vladimir Putin cronies and countless companies also give endless millions to Big Green.

Our hard-earned tax dollars are likewise only partially included in the CCBJ tally. As professor, author and columnist Larry Bell notes in his new book, Scared Witless: Prophets and profits of climate doom, the U.S. government spent over $185 billion between 2003 and 2010 on climate change items – and this wild spending spree has gotten even worse in the ensuing Obama years. We are paying for questionable to fraudulent global warming studies, climate-related technology research, loans and tax breaks for Solyndra and other companies that go bankrupt, and “climate adaptation” foreign aid to poor countries.

Also not included: the salaries and pensions of thousands of EPA, NOAA, Interior, Energy and other federal bureaucrats who devote endless hours to devising and imposing regulations for Clean Power Plans, drilling and mining bans, renewable energy installations, and countless Climate Crisis, Inc. handouts. A significant part of the $1.9 trillion per year that American businesses and families pay to comply with mountains of federal regulations is also based on climate chaos claims.

Add in the state and local equivalents of these federal programs, bureaucrats, regulations and restrictions, and we’re talking serious money. There are also consumer costs, including the far higher electricity prices families and businesses must pay, especially in states that want to prove their climate credentials.

Summary

Looking into the future, IEA expects additional spending just in the energy sector to meet climate change targets on the order of $35-trillion over the period 2015 to 2030.  All this remarkable growth comes in a market for non-solutions to the non-problem of global warming.  (Note to Lewandowsky:  It is not a conspiracy, it’s a monopoly.)

There also may be a limit to how much can be extracted.

Climate cashCow

Footnotes:

  1.  The Climate Change Business Journal produced the report of 2015 industry revenues and sectors, referenced by the Insurance Journal article.  More recent reports likely show much higher revenues, but I am unwilling to buy a report from CCBJ.

2.  A recent example of the dash for climate cash is the rise of Climate Medicine.


Radiation Myopia

A recent thread comment illustrates how the global warming PR campaign has installed a bogus climate paradigm in public awareness: The Supremacy of Infrared Radiation. In a discussion about clouds and the Arctic, this comment appeared:

I disagree with the comments that clouds at the poles should cause cooling.
In general the earth absorbs heat from the sun near the equator and expels it near the poles via up welling radiation. A low humidity clear sky near the poles allows most gray body radiation from the ice/oceans/land to emit directly to space. Clouds at the poles would interfere with that process and the poles would warm thus melting the ice faster. And in a general sense, that is what we’ve seen over the last 40 years. (linked to a graph of declining ice extent since 1979).

Heat Transfer Mechanisms

It takes some work to untangle the problems with this statement. Because it is true that earth’s climate system takes in solar energy mostly at the equator, which is then transported and expelled mostly at the poles. The myopia is in the notion that this is a purely radiative heat transfer. The misconception arises from confusing the view from the top of the atmosphere (TOA) with the view at the surface where we live. The TOA energy balance is purely radiative.  Incoming: Short Wave (SW) in, minus Outgoing: (SW) reflected/scattered out, and minus Long Wave (LW, mostly Infrared) emitted out.

Nearer the surface, the movement of energy is dominated by other more powerful heat transfers: Conduction (from warm to cool by direct contact), Convection (air moving from warm to cool objects) and Latent Heat (water changing phases from ice to liquid to gas and back again). These processes move massive amounts of energy upward from the surface toward the nearly absolute cold of space. IR active gases, mainly H2O and the minor trace gas CO2, do absorb and re-emit some LW energy, but at a scale orders of magnitude less.

Polar Heat Exchanges

The comment above attributes warming in the Arctic to the radiative properties of H20 in clouds. There is no claim that CO2 is a factor, since it acknowledges that clear dry skies offer no significant impediment to the cooling processes. But do water vapor and clouds delay cooling in the Arctic?

While it is true that moist air in the tropics makes for mild evenings after sundown, the Arctic situation differs. There is a short season when the summer sun shines, and most of the year is dark and extremely cold.

Most people fail to appreciate the huge heat losses at the Arctic pole. Mark Brandon has an excellent post on this at his wonderful blog, Mallemaroking.

By his calculations the sensible heat loss in Arctic winter ranges 200-400 Wm2.

The annual cycle of sensible heat flux from the ocean to the atmosphere for 4 different wind speeds.

As the diagram clearly shows, except for a short time in high summer, the energy flow is from the water heating the air. Transfers by latent heat are in addition to the above.

For a long time I misinterpreted the meaning of charts like the current one below from DMI:

meanT_2016DMI

Those are air temperatures, and if they are above average, it means that the water is losing more heat than past normals. It’s not that warmer air causes ice melt, but the other way around: Oceans are always moving heat, and more open water means more heat loss into the air, resulting in higher air temperatures, though still way below zero most of the year.

For comparison, look at the same chart from 1977 when ice extent was much higher the entire year:

Summary

So if there is to be any warming effect on ice formation from clouds, it can only happen in peak summer, the precise time when their shading effect exceeds any radiative warming.  And the existence of clouds indicates moisture in the air which came from the ocean evaporating.

The myopic focus on radiation and air temperatures leads into a false analogy:  thinking the Arctic is a kind of refrigerator. I explained in some detail why this is not so:  Arctic Is Not a Refrigerator

If one wants to use the refrigerator analogy in relation to earth’s climate, at least do it correctly as Dr. Salby does:

From Physics of the Atmosphere and Climate, pg.82

A closed system that performs work through a conversion of heat that is absorbed by it is a heat engine. Conversely, a system that rejects heat through a conversion of work that is performed on it is a refrigerator.

In Chap. 6, we will see that individual air parcels comprising the circulation of the troposphere behave as a heat engine. By absorbing heat at the Earth’s surface, through transfers of radiative, sensible, and latent heat, individual parcels perform net work as they evolve through a thermodynamic cycle (2.13). Ultimately realized as kinetic energy, the heat absorbed maintains the circulation against frictional dissipation. It makes the circulation of the troposphere thermally driven.

In contrast, the circulation of the stratosphere behaves as a radiative refrigerator. For motion to occur, individual air parcels must have work performed on them. The kinetic energy produced is eventually converted to heat and rejected to space through LW cooling. It makes the circulation of the stratosphere mechanically driven. Gravity waves and planetary waves that propagate upward from the troposphere are dissipated in the stratosphere. Their absorption exerts an influence on the stratosphere analogous to paddle work. By forcing motion that rearranges air, it drives the stratospheric circulation out of radiative equilibrium, which results in net LW cooling to space.

Troposphere=Heat Engine

Stratosphere = Refrigerator


Alarmist Heads in the Clouds

A new study from Scripps at UC San Diego claims proof of greenhouse gas warming by means of changes to the clouds. The paper is behind a paywall, so the reasoning is not accessible, but the media releases will ensure wide repetition.

From the news release July 11, 2016 (here)
Clouds Are Moving Higher, Subtropical Dry Zones Expanding, According to Satellite Analysis
Scripps-led study confirms computerized climate simulations projecting effects of global warming

Inconsistent satellite imaging of clouds over the decades has been a hindrance to improving scientists’ understanding. Records of cloudiness from satellites originally designed to monitor weather are prone to spurious trends related to changes in satellite orbit, instrument calibration, degradation of sensors over time, and other factors.

When the researchers removed such artifacts from the record, the data exhibited large-scale patterns of cloud change between the 1980s and 2000s that are consistent with climate model predictions for that time period, including poleward retreat of mid-latitude storm tracks, expansion of subtropical dry zones, and increasing height of the highest cloud tops. These cloud changes enhance absorption of solar radiation by the earth and reduce emission of thermal radiation to space. This exacerbates global warming caused by increasing greenhouse gas concentrations.

The researchers drew from several independent corrected satellite records in their analysis. They concluded that the behavior of clouds they observed is consistent with a human-caused increase in greenhouse gas concentrations and a planet-wide recovery from two major volcanic eruptions, the 1982 El Chichón eruption in Mexico and the 1991 eruption of Mt. Pinatubo in the Philippines. Aerosols ejected from those eruptions had a net cooling effect on the planet for several years after they took place.

Barring another volcanic event of this sort, the scientists expect the cloud trends to continue in the future as the planet continues to warm due to increasing greenhouse gas concentrations. (My bolds)

Another Example of Lop-sided Myopia and Confirmation Bias

The report above violates basic physics, resulting in a gross distortion. Two points are critical. When it comes to clouds, the greenhouse gas that matters is H2O, not CO2. Any IR effects are 96% due to the presence of water vapor and the droplets in the clouds.

And even more importantly, as Dr. Salby illustrated (here), the net effect from clouds is cooling, not warming.

Net cloud forcing is then −15 W m−2. It represents radiative cooling of the Earth-atmosphere system. This is four times as great as the additional warming of the Earth’s surface that would be introduced by a doubling of CO2. Latent heat transfer to the atmosphere (Fig. 1.32) is 90 W m−2. It is an order of magnitude greater. Consequently, the direct radiative effect of increased CO2 would be overshadowed by even a small adjustment of convection (Sec. 8.7).

Convective clouds forming over the Amazon in a blanket smoke. Credit: Prof. Ilan Koren

This is confirmed by other researchers, such as I. Koren, G. Dagan, and O. Altaratz. From aerosol-limited to invigoration of warm convective clouds. Science, 2014; 344 (6188) here.

They then looked at another source of data: that of the Clouds’ and Earth’s Radiant Energy System (CERES) satellite instruments which measure fluxes of reflected and emitted radiation from Earth to space, to help scientists understand how the climate varies over time. When analyzed together with the aerosol loading over the same area at the same time, the outcome, says Koren, was a “textbook demonstration of the invigoration effect” of added aerosols on clouds. In other words, the radiation data fit the unique signature of clouds that were growing higher and larger. Such clouds show a strong increase in cooling due to the reflected short waves, but that effect is partly cancelled out by the enhanced, trapped, long-wave radiation coming from underneath. (My bold)

More info on clouds is here:Climate Partly Cloudy 

Summary

Once again, atmospheric physics is willfully distorted in order to get a headline and burnish credentials in support of man-made climate change. They promote a myopic and lop-sided picture to frighten a public mostly ill-equipped to see through their mumbo-jumbo.

mumbo_jumbo_flamingo-land1

Climate Medicine

Climate Quakery

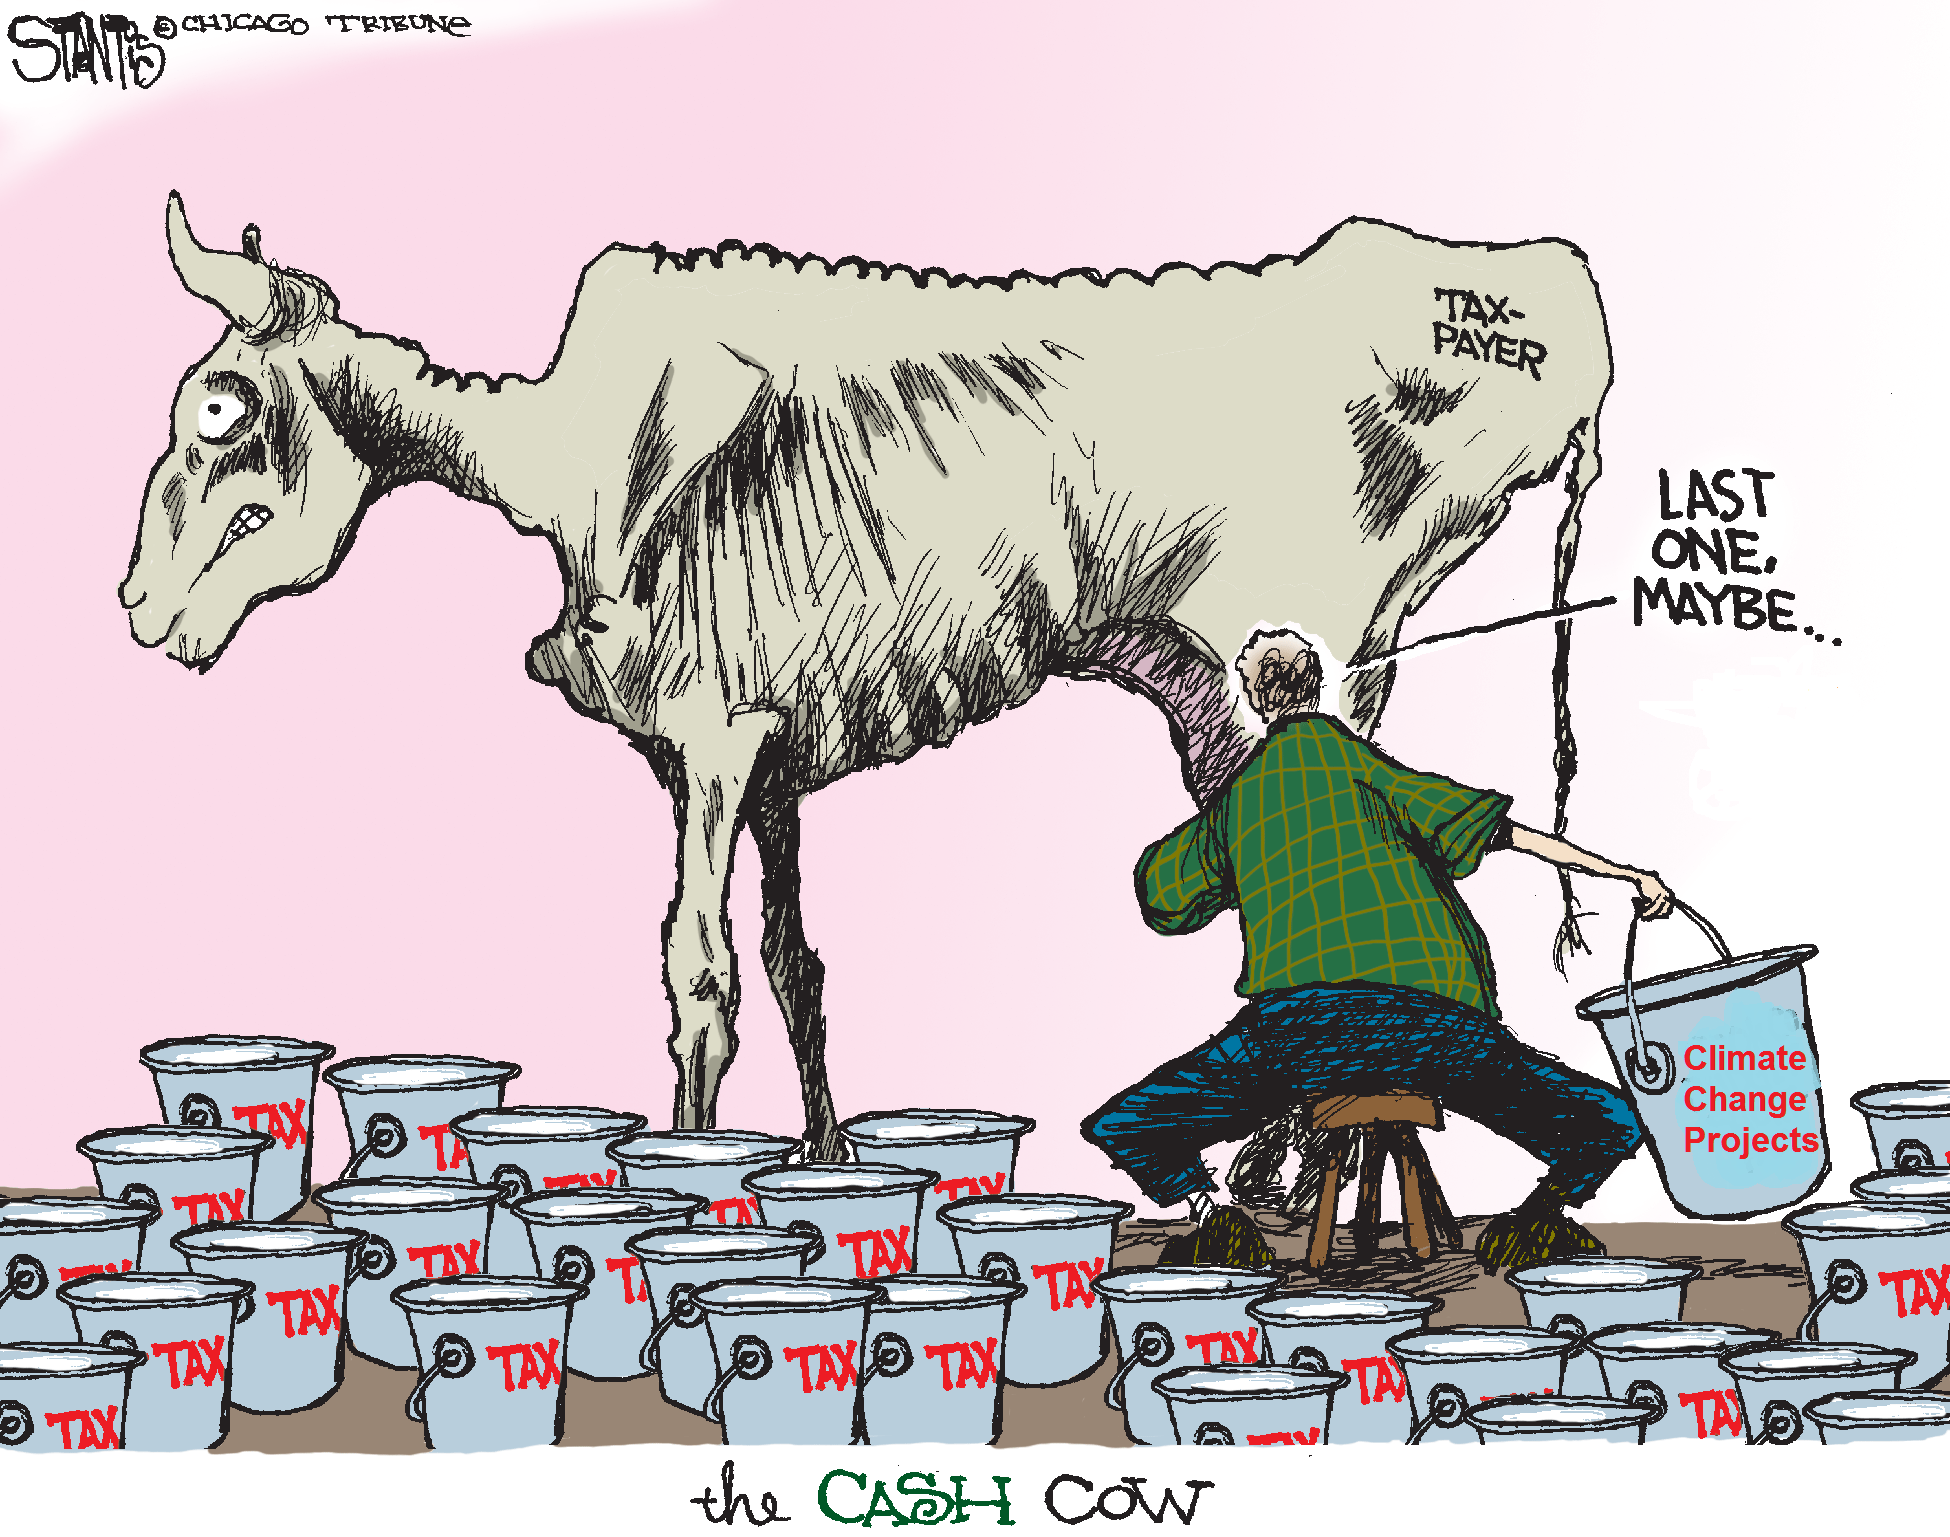
As Richard Lindzen predicted, everyone wants on the climate bandwagon, because that is where the money is.  Medical scientists are pushing for their share of the pie, as evidenced by last week’s Met office gathering on Assessing the Global Impacts of Climate and Extreme Weather on Health and Well-Being. Not coincidentally, the 2nd Global Conference on Health and Climate was held July 7-8, 2016 in Paris.

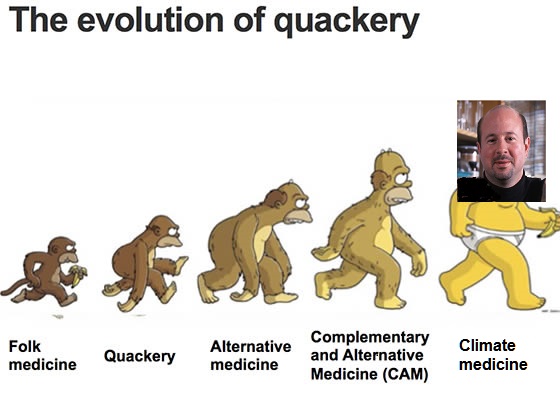
The new field of Climate Medicine is evidenced by a slew of new organizations and studies.  In addition to numerous agencies set up within WHO and the UN, and governmental entities (such as the Met Office), there are many NGOs, such as:

Health Care Without Harm
Health and Environment Alliance
Health and Climate Foundation
Climate and Health Council
United States National Association of County and City Health Officials
Care International
Global Gender and Climate Alliance / Women’s Environment and   Development Organization
International Federation of Medical Students’ Associations
Climate Change and Human Health Programme, Columbia U.
Center for Health and the Global Environment, Harvard
National Center for Epidemiology and Population Health, ANC Canberra
Centre for Sustainability and the Global Environment, U of Wisconsin
Environmental Change Institute, Oxford
London School of Tropical Medicine and Hygiene, London, UK
International Human Dimensions Programme on Global Environmental Change, US National Academies of Science
US Climate and Health Alliance
Etc, etc., etc.

Of course, they are encouraged and abetted by the IPCC.

climatechange-infographic2

From the Fifth Assessment Report:

Until mid-century, projected climate change will impact human health mainly by exacerbating health problems that already exist (very high confidence). Throughout the 21st century, climate change is expected to lead to increases in ill-health in many regions and especially in developing countries with low income, as compared to a baseline without climate change (high confidence). By 2100 for RCP8.5, the combination of high temperature and humidity in some areas for parts of the year is expected to compromise common human activities, including growing food and working outdoors (high confidence). {2.3.2}

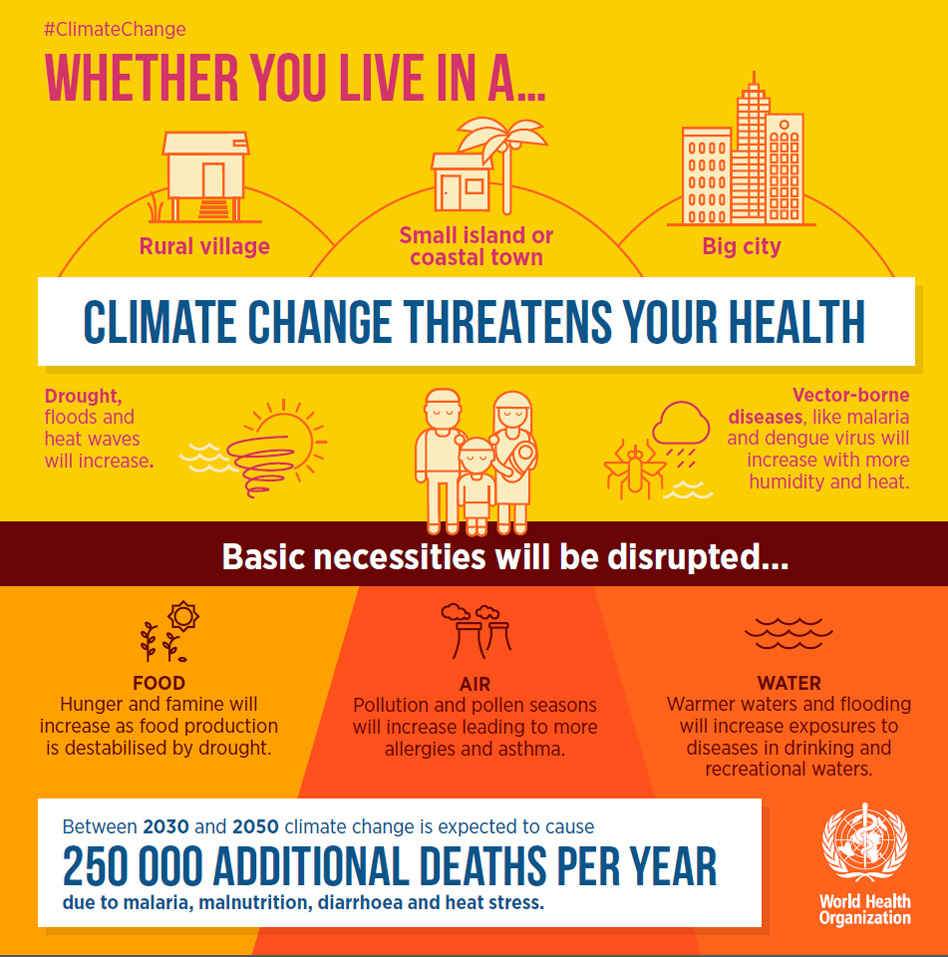
In urban areas climate change is projected to increase risks for people, assets, economies and ecosystems, including risks from heat stress, storms and extreme precipitation, inland and coastal flooding, landslides, air pollution, drought, water scarcity, sea level rise and storm surges (very high confidence). These risks are amplified for those lacking essential infrastructure and services or living in exposed areas. {2.3.2}

Feared Climate Health Impacts Are Unsupported by Scientific Research

NIPCC has a compendium of peer-reviewed studies on this issue and provides these findings (here)

Key Findings: Human Health
• Warmer temperatures lead to a decrease in temperature-related mortality, including deaths associated with cardiovascular disease, respiratory disease, and strokes. The evidence of this benefit comes from research conducted in every major country of the world.

• In the United States the average person who died because of cold temperature exposure lost in excess of 10 years of potential life, whereas the average person who died because of hot temperature exposure likely lost no more than a few days or weeks of life.

• In the U.S., some 4,600 deaths are delayed each year as people move from cold northeastern states to warm southwestern states. Between 3 and 7% of the gains in longevity experienced over the past three decades was due simply to people moving to warmer states.

• Cold-related deaths are far more numerous than heat-related deaths in the United States, Europe, and almost all countries outside the tropics. Coronary and cerebral thrombosis account for about half of all cold-related mortality.

• Global warming is reducing the incidence of cardiovascular diseases related to low temperatures and wintry weather by a much greater degree than it increases the incidence of cardiovascular diseases associated with high temperatures and summer heat waves.

• A large body of scientific examination and research contradict the claim that malaria will expand across the globe and intensify as a result of CO2 -induced warming.

• Concerns over large increases in vector-borne diseases such as dengue as a result of rising temperatures are unfounded and unsupported by the scientific literature, as climatic indices are poor predictors for dengue disease.

• While temperature and climate largely determine the geographical distribution of ticks, they are not among the significant factors determining the incidence of tick-borne diseases.

• The ongoing rise in the air’s CO2 content is not only raising the productivity of Earth’s common food plants but also significantly increasing the quantity and potency of the many healthpromoting substances found in their tissues, which are the ultimate sources of sustenance for essentially all animals and humans.

• Atmospheric CO2 enrichment positively impacts the production of numerous health-promoting substances found in medicinal or “health food” plants, and this phenomenon may have contributed to the increase in human life span that has occurred over the past century or so.

• There is little reason to expect any significant CO2 -induced increases in human-health-harming substances produced by plants as atmospheric CO2 levels continue to rise.

Source: Chapter 7. “Human Health,” Climate Change Reconsidered II: Biological Impacts (Chicago, IL: The Heartland Institute, 2014).
Full text of Chapter 7 and references on Human health begins pg. 955 of the full report here

Summary

Advances in medical science and public health have  benefited billions of people with longer and higher quality lives.  Yet this crucial social asset has joined the list of those fields corrupted by the dash for climate cash. Increasingly, medical talent and resources are diverted into inventing bogeymen and studying imaginary public health crises.

Economists Francesco Boselloa, Roberto Roson and Richard Tol conducted an exhaustive study called Economy-wide estimates of the implications of climate change: Human health

After reviewing all the research and crunching the numbers, they concluded that achieving one degree of global warming by 2050 will, on balance, save more than 800,000 lives annually.

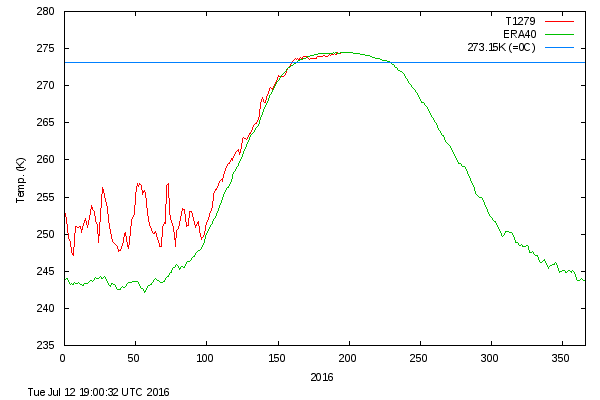
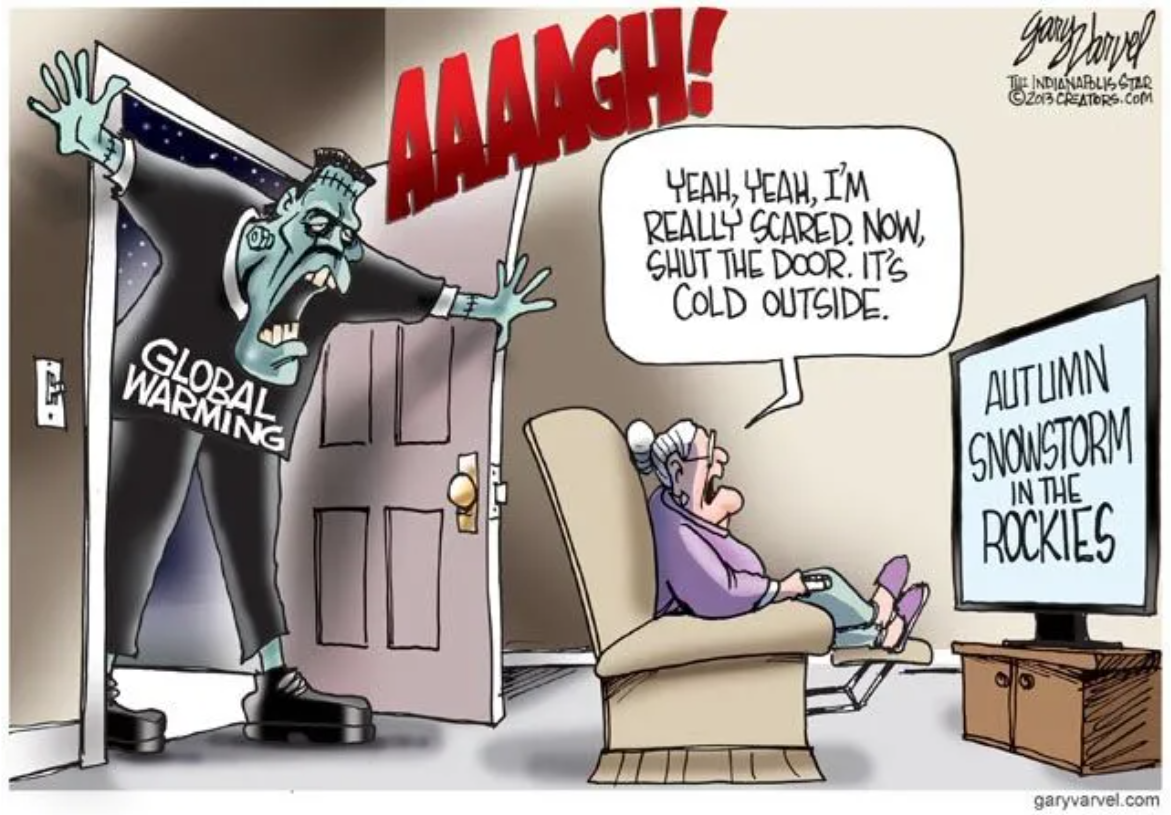
Not only is the warming not happening, we would be more healthy if it did.

Oh, Dr. Frankenmann, what have you wrought?


Footnote:  More proof against Climate Medicine

From: Gasparrini et al: Mortality risk attributable to high and low ambient temperature: a multicountry observational study. The Lancet, May 2015

Cold weather kills 20 times as many people as hot weather, according to an international study analyzing over 74 million deaths in 384 locations across 13 countries. The findings, published in The Lancet, also reveal that deaths due to moderately hot or cold weather substantially exceed those resulting from extreme heat waves or cold spells.

“It’s often assumed that extreme weather causes the majority of deaths, with most previous research focusing on the effects of extreme heat waves,” says lead author Dr Antonio Gasparrini from the London School of Hygiene & Tropical Medicine in the UK. “Our findings, from an analysis of the largest dataset of temperature-related deaths ever collected, show that the majority of these deaths actually happen on moderately hot and cold days, with most deaths caused by moderately cold temperatures.”


Average Arctic Melt July 7

In the chart below MASIE shows 2016 Mid-June  Arctic ice extent drew near to average and close to 2015, then dropped lower before again converging on average by the end.  Now in July 2016 is matching the average extent measured over the last ten years, 2006-2015.  With SII back on line, it was reporting similar extents during June (as it has in the past).  Recently it is starting to underestimate again, ~400k km2 lower. (SII and MASIE comparison is here.)

MASIE 2016 day188

Looking into the details, some marginal seas are melting earlier than last year, while the central, enduring ice pack is relatively unaffected.  In fact, a large difference between 2016 and 2015 comes from the losses from maximums in a single place: Sea of Okhotsk.  To date 1303k km2 of ice was lost this year vs. 753k km2 lost in 2015 in that sea at the same date.

Despite greater losses in Okhotsk, 2016 ice extent in July is fairly ordinary with slight differences across the regions.  At the present pace of declining ice extents, the last three days 2016 matches the ten-year average, and is four days ahead of 2015.

Comparing the Arctic ice extents with their maximums shows the melting is occurring mostly in the marginal seas, now including Kara Sea as expected in June.  Most of the additional ice loss in July comes from Baffin and Hudson Bays.

2016188 NH Max Loss % Loss Sea Max % Total Loss
 (0) Northern_Hemisphere 5880825 39.00% 100%
 (1) Beaufort_Sea 243265 22.73% 4%
 (2) Chukchi_Sea 214347 22.19% 3%
 (3) East_Siberian_Sea 26723 2.46% 0%
 (4) Laptev_Sea 35559 3.96% 1%
 (5) Kara_Sea 648206 69.33% 10%
 (6) Barents_Sea 589137 98.29% 10%
 (7) Greenland_Sea 300055 45.48% 5%
 (8) Baffin_Bay_Gulf_of_St._Lawrence 1266759 77.03% 20%
 (9) Canadian_Archipelago 88793 10.41% 1%
 (10) Hudson_Bay 533623 42.32% 9%
 (11) Central_Arctic 80724 2.49% 1%
 (12) Bering_Sea 768232 100.00% 12%
 (13) Baltic_Sea 97582 100.00% 2%
 (14) Sea_of_Okhotsk 1306657 99.84% 21%

It is clear from the above that the bulk of ice losses are coming from Okhotsk, Barents and Bering Seas (95+% melted), along with Kara Sea and Baffin Bay-St. Lawrence (70+% melted).  Hudson  Bay has lost 42% of max extent.  All of them are marginal seas that will go down close to zero by September.  Note: Some seas are not at max on the NH max day.  Thus, totals from adding losses will vary from NH daily total.

For additional context on Arctic melt see last Arctic Ice Watch June 30


Warm is Cold, and Down is Up

Paul Homewood has a post today: Who Is Lying? John Holdren, Jennifer Francis, Or NOAA?

The issue revolves around claims of global warming changing the jet stream, resulting in extreme weather, including colder winters in the US. That’s a neat trick: Getting global warming to produce cold weather.
.
Lying presumes they know the truth and speak falsely. This is more a case of saying what they believe but being wrong. (“Love of Theory is the Root of all Evil” –William Briggs)

Seasoned meteorologist Judah Cohen of AER sees it differently.

My colleagues, at AER and at selected universities, and I have found a robust relationship between two October Eurasian snow indices and the large-scale winter hemispheric circulation pattern known as the North Atlantic or Arctic Oscillation pattern (N/AO).

The N/AO is more highly correlated with or explains the highest variance of winter temperatures in eastern North America, Europe and East Asia than any other single or combination of atmospheric or coupled ocean-atmosphere patterns that we know of. Therefore, if we can predict the winter N/AO (whether it will be negative or positive) that provides the best chance for a successful winter temperature forecast in North America but certainly does not guarantee it.

He goes on to say that precipitation is the key, not air temperatures, and ENSO is a driving force:

As long as I have been a seasonal forecaster, I have always considered El Nino/Southern Oscillation (ENSO) as a better predictor of precipitation than temperature across the Eastern US. I think this is supported by the observational or statistical analysis as well as the skill or accuracy of the climate models.

There have been recent modeling studies that demonstrate that El Nino modulates the strength and position of the Aleutian Low that then favors stratospheric warmings and subsequently a negative winter N/AO that are consistent with our own research on the relationship between snow cover and stratospheric warmings. So the influence of ENSO on winter temperatures in the Mid-Atlantic and the Northeast may be greater than I acknowledge or that is represented in our seasonal forecast model.

Summary

As Cohen’s diagram shows, there is an effect from warming, but in the stratosphere. Global warming theory claims CO2 causes warming in the troposphere and cooling in the stratosphere. So whatever is going on, it is not due to CO2.

Cohen’s interview with the Washington Post.

its-easier-to-fool-people-than-to-convince-them-that-they-have-been-fooled


Climategate Redux?

The AAAS (American Association for the Advancement of Science) sent a letter on June 28, 2016 urging the US congress to act on climate change:

There is strong evidence that ongoing climate change is having broad negative impacts on society, including the global economy, natural resources, and human health. For the United States, climate change impacts include greater threats of extreme weather events, sea level rise, and increased risk of regional water scarcity, heat waves, wildfires, and the disturbance of biological systems. The severity of climate change impacts is increasing and is expected to increase substantially in the coming decades.

Those of us with short memories need to be reminded that the Climategate emails were triggered by an appeal to congress in 2009 by the AAAS. Dr. Arnd Bernaerts provides the background and the historical context.

On October 21, 2009 the AAAS letter included this:

Moreover, there is strong evidence that ongoing climate change will have broad impacts on society, including the global economy and on the environment. For the United States, climate change impacts include sea level rise for coastal states, greater threats of extreme weather events, and increased risk of regional water scarcity, urban heat waves, western wildfires, and the disturbance of biological systems throughout the country. The severity of climate change impacts is expected to increase substantially in the coming decades.
Full text provided by Dr. Bernaerts here, along with his response.

The Climategate Emails

2011 Report here
More than 5,000 documents have been leaked online purporting to be the correspondence of climate scientists at the University of East Anglia who were previously accused of ‘massaging’ evidence of man-made climate change.

Following on from the original ‘climategate’ emails of 2009, the new package appears to show systematic suppression of evidence, and even publication of reports that scientists knew to to be based on flawed approaches. 

The leaker of the emails “FOIA” said this in a comment at the time, Nov. 17, 2009:
We feel that climate science is, in the current situation, too important to be kept under wraps.
We hereby release a random selection of correspondence, code, and documents.
Hopefully it will give some insight into the science and the people behind it.

Dr. Bernaerts comments on the current situation:

I had hoped that the “endorsement” by “FOIA said” would give a helpful impulse to my complaint about a science which is not able to define what they are talking about, namely CLIMATE. Those not happy with the AGW discussion should have pressured WMO, IPCC and consorts to demonstrate that they are capable to do what every academic is trained to do, to provide reasonable and workable definitions. Unfortunately that did not materialize. The definition matter remains neglected by AGW supporters and sceptics alike. A great pity. A further conference paper from January 2010, available at: http://www.whatisclimate.com/ explains this in more detail.

What has changed in the world of AAAS and in the field of supporting and opposing views: Much too little. A pity that we cannot ask FOIA what would be his view today.

The Climate Lemmings
h/t Beth