
In the chart below MASIE shows 2016 Mid-July Arctic ice extent has slipped below average and 2015. SII is back on line and was reporting similar extents during June (as it has in the past). But in July SII is showing ~400k km2 less ice most days. (SII and MASIE comparison is here.)
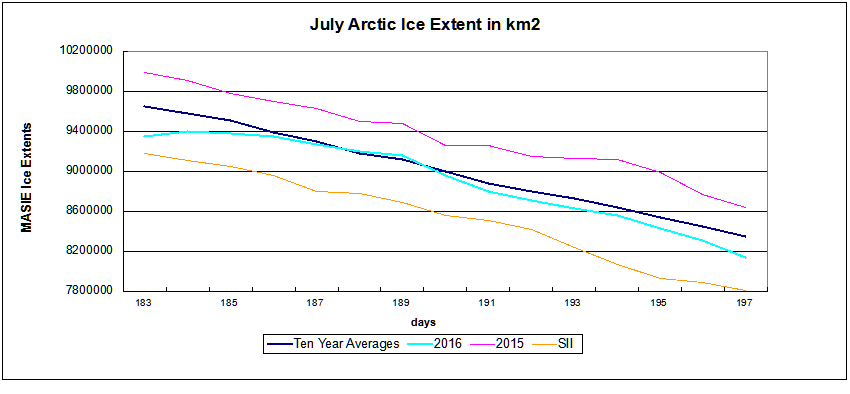
Looking into the details, some marginal seas are melting earlier than last year, while the central, enduring ice pack is relatively unaffected. Despite greater losses in Okhotsk, 2016 ice extent in June is fairly ordinary with slight differences across the regions. At the present pace of declining ice extents, 2016 is running three days ahead of the ten-year average, and seven days ahead of 2015.
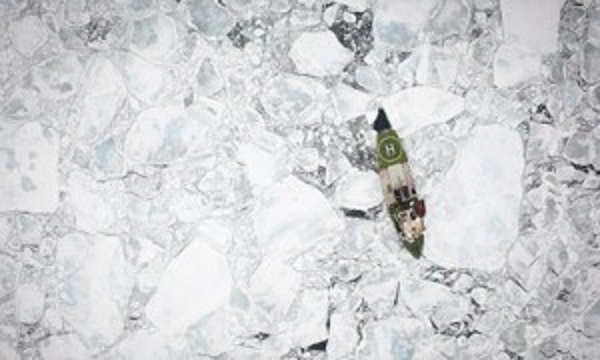
US Navy predicts summer ice free Arctic by 2016. Greenpeace icebreaking ship, Arctic Sunrise, among broken floes of Arctic sea ice, photographed from the air. This image was taken in the Fram Strait. Greenpeace doing their bit to create more open water.
As the chart below shows, the seas most down from average this year are Kara, Barents, Greenland Sea and Baffin Bay. Meanwhile higher extents are showing in Chukchi, Laptev, and Hudson Bay, resulting in 2016 slightly below average. Beaufort Sea has returned to average after a weather event in June reduced ice by more than 150k km2.
| Region | 2016197 | Day 197 Average | 2016-Ave. |
| (0) Northern_Hemisphere | 8139126 | 8345952 | -206826 |
| (1) Beaufort_Sea | 844302 | 839527 | 4775 |
| (2) Chukchi_Sea | 698967 | 632572 | 66395 |
| (3) East_Siberian_Sea | 940706 | 944437 | -3731 |
| (4) Laptev_Sea | 838590 | 592558 | 246032 |
| (5) Kara_Sea | 155252 | 371043 | -215791 |
| (6) Barents_Sea | 35 | 54678 | -54642 |
| (7) Greenland_Sea | 228393 | 428257 | -199865 |
| (8) Baffin_Bay_Gulf_of_St._Lawrence | 201400 | 272271 | -70872 |
| (9) Canadian_Archipelago | 684418 | 709717 | -25299 |
| (10) Hudson_Bay | 445064 | 316953 | 128111 |
| (11) Central_Arctic | 3100876 | 3178016 | -77140 |
| (12) Bering_Sea | 0 | 1600 | -1600 |
| (13) Baltic_Sea | 0 | 2 | -2 |
| (14) Sea_of_Okhotsk | 0 | 3125 | -3125 |
.
Comparing the Arctic ice extents with their maximums shows the melting is occurring mostly in the marginal seas, now including Kara Sea as expected in July.
| 2016197 | NH Max Loss | % Loss Sea Max | % Total Loss |
| (0) Northern_Hemisphere | 6938473 | 46.02% | 100% |
| (1) Beaufort_Sea | 226143 | 21.13% | 3% |
| (2) Chukchi_Sea | 267022 | 27.64% | 4% |
| (3) East_Siberian_Sea | 146414 | 13.47% | 2% |
| (4) Laptev_Sea | 59220 | 6.60% | 1% |
| (5) Kara_Sea | 779736 | 83.40% | 11% |
| (6) Barents_Sea | 599344 | 99.99% | 8% |
| (7) Greenland_Sea | 431320 | 65.38% | 6% |
| (8) Baffin_Bay_Gulf_of_St._Lawrence | 1443182 | 87.75% | 20% |
| (9) Canadian_Archipelago | 168760 | 19.78% | 2% |
| (10) Hudson_Bay | 815807 | 64.70% | 11% |
| (11) Central_Arctic | 145834 | 4.49% | 2% |
| (12) Bering_Sea | 768232 | 100.00% | 11% |
| (13) Baltic_Sea | 97582 | 100.00% | 1% |
| (14) Sea_of_Okhotsk | 1308697 | 100.00% | 18% |
It is clear from the above that the bulk of ice losses are coming from Okhotsk, Barents and Bering Seas (100% melted),along with Kara Sea, Hudson Bay and Baffin Bay-St. Lawrence (65+% melted). All of them are marginal seas that will go down close to zero by September. Note: Some seas are not at max on the NH max day. Thus, totals from adding losses will vary from NH daily total.


CPC shows the Arctic Oscillation waffling between positive and negative values, recently positive and forecasted to near neutral. Generally, positive AO signifies lower pressures over Arctic ice, with more cloud, lower insolation and less melting. The outlook at this point is mixed.
September Minimum Outlook
Historically, where will ice be remaining when Arctic melting stops? Over the last 10 years, on average MASIE shows the annual minimum occurring about day 260. Of course in a given year, the daily minimum varies slightly a few days +/- from that.
For comparison, here are sea ice extents reported from 2007, 2012, 2014 and 2015 for day 260:
| Arctic Regions | 2007 | 2012 | 2014 | 2015 |
| Central Arctic Sea | 2.67 | 2.64 | 2.98 | 2.93 |
| BCE | 0.50 | 0.31 | 1.38 | 0.89 |
| Greenland & CAA | 0.56 | 0.41 | 0.55 | 0.46 |
| Bits & Pieces | 0.32 | 0.04 | 0.22 | 0.15 |
| NH Total | 4.05 | 3.40 | 5.13 | 4.44 |
Notes: Extents are in M km2. BCE region includes Beaufort, Chukchi and Eastern Siberian seas. Greenland Sea (not the ice sheet). Canadian Arctic Archipelago (CAA). Locations of the Bits and Pieces vary.
As the table shows, low NH minimums come mainly from ice losses in Central Arctic and BCE. The great 2012 cyclone hit both in order to set the recent record. The recovery since 2012 shows in 2014, with some dropoff last year, mostly in BCE.
Summary
We are well into the melt season, and the resulting minimum will depend upon the vagaries of weather between now and September. Early on, 2016 was slightly higher than 2015 in March, lower in May and now closing the gap. Note: 2016 melt season is starting without the Blob, with El Nino over, and a cold blob in the North Atlantic. The AO has been hovering around neutral, now possibly indicating cloud cover reducing the pace of melting.
Meanwhile we can watch and appreciate the beauty of the changing ice conditions.

Arctic Reflection: Clouds replace snow and ice as solar reflector NASA photo
Footnote: Regarding the colder than normal water in the North Atlantic
A 2016 article for EOS is entitled Atlantic Sea Ice Could Grow in the Next Decade
Changing ocean circulation in the North Atlantic could lead to winter sea ice coverage remaining steady and even growing in select regions.
The researchers analyzed simulations from the Community Earth System Model, modeling both atmosphere and ocean circulation. They found that decadal-scale trends in Arctic winter sea ice extent are largely explained by changes in ocean circulation rather than by large-scale external factors like anthropogenic warming.
From the Abstract of Yeager et al.
We present evidence that the extreme negative trends in Arctic winter sea-ice extent in the late 1990s were a predictable consequence of the preceding decade of persistent positive winter North Atlantic Oscillation (NAO) conditions and associated spin-up of the thermohaline circulation (THC). Initialized forecasts made with the Community Earth System Model decadal prediction system indicate that relatively low rates of North Atlantic Deep Water formation in recent years will result in a continuation of a THC spin-down that began more than a decade ago. Consequently, projected 10-year trends in winter Arctic winter sea-ice extent seem likely to be much more positive than has recently been observed, with the possibility of actual decadal growth in Atlantic sea-ice in the near future.

Reblogged this on TheFlippinTruth.
LikeLike
Reblogged this on Climate Collections.
LikeLike