Pacific Ice Seesaw Feb. 2019


10 Days in Pacific Arctic:
The above image shows the pacific ice seesaw returning at the end of February.  Bering Sea on the right was at 95% of 2018 maximum and then lost  180k km2 in ten days, now at 65 % of max.  Meanwhile on the left Okhotsk Sea gained 70k km2, and is now 106% of 2018 maximum.

The graph below shows February progress in ice extent recovery.As noted before, the month started with a slight decline, then ice grew rapidly for 18 days peaking on day 54 above the 12 yr. average, and above the previous two years.  Then ice retreated the last five days with the February monthly average ending  240k km2 or 2% below average. SII lags MASIE by ~100k km2 for the month.

The next two weeks will show whether 2019 is maxed out, or whether the ice extent catches up to the average which flatlines over that period.

The table below shows the distribution of ice in the various Arctic basins.

Region 2019059 Day 059 
Average
2019-Ave. 2018059 2019-2018
 (0) Northern_Hemisphere 14625288 15006867 -381579 14485052 140236
 (1) Beaufort_Sea 1070498 1070200 297 1070445 53
 (2) Chukchi_Sea 960221 965872 -5651 965971 -5750
 (3) East_Siberian_Sea 1087137 1087133 4 1087120 18
 (4) Laptev_Sea 897845 897842 3 897845 0
 (5) Kara_Sea 931672 929289 2383 922905 8767
 (6) Barents_Sea 684894 625620 59274 544938 139956
 (7) Greenland_Sea 513404 628938 -115534 473064 40340
 (8) Baffin_Bay_Gulf_of_St._Lawrence 1570308 1539346 30962 1786606 -216298
 (9) Canadian_Archipelago 853337 853036 302 853109 229
 (10) Hudson_Bay 1260903 1260611 293 1260838 66
 (11) Central_Arctic 3231172 3213214 17958 3065181 165991
 (12) Bering_Sea 250169 710647 -460479 336065 -85896
 (13) Baltic_Sea 39687 110466 -70780 123280 -83594
 (14) Sea_of_Okhotsk 1260392 1067746 192646 1069898 190494

The table shows how 2019 is matching the 12-year average almost everywhere.  Barents Sea has caught up and edged ahead of average, and much higher than last year.  Greenland Sea is below average but higher than 2018.  The overall deficit is due to Bering ice down 460k km2 to average, only partially offset by a surplus of 193k km2 in Okhotsk.

cg524a47d218458

Footnote:  At his AER blog  Arctic Oscillation and Polar Vortex Analysis and Forecasts Dr. Judah Cohen writes on Feb. 25 regarding this cold winter in the Arctic. Excerpts in italics with my bolds.

As I have written many times in the blog this fall and winter season the influence of a significant stratospheric PV disruption typically lasts on the order of four to eight weeks. It certainly looks like the PV split from early January has gone the distance and has persisted for a full eight weeks or possibly even a little longer. Based on the latest polar cap geopotential heights (PCHs) forecast the whole event is winding down over the next week or so. Therefore, I think that we can start to draft the obituary for this event.

The stratosphere-troposphere coupling differed from last year’s PV split and other previous similar events but certainly not all. Though the “dripping” of warm PCHs occurred periodically, there were long gaps between “drips” where the tropospheric PCHs even turned cold for an appreciable period. Also, the AO and NAO never turned strongly negative nor was there any persistent period where both indices remained in negative territory. This is in strong contrast to last winter. As I wrote in last week’s blog, I think at least part of the reason might be the relatively cold central Arctic this winter compared with the last several winters where the Arctic was near or at record warm.

Though despite what could be considered atypical or less traditional stratosphere-troposphere coupling following the stratospheric PV split, I would argue there were still some impressive impacts on the weather. Maybe those impacts were more discernable and more impressive across North America than Eurasia, but both continents had record cold and snow.

So, what to expect as the stratosphere-troposphere coupling event wraps up. For Europe, temperatures are already mild and with the AO predicted to remain positive and could potentially turn even more strongly positive if the cold PCHs couple all the way to the surface, it is hard for me to see a return to any kind of prolonged cold this month. Across North America it is more complicated. Cold temperatures are predicted to be expansive across the continent and even record cold is possible over the next week or so. In addition, snow cover is relatively extensive and, in many locations, unusually deep especially on either side of the US-Canadian border. I don’t expect the cold air across in North America to simply disappear anytime soon, but if the if the cold PCHs couple all the way to the surface, this would favor the cold temperatures being mostly confined to western North America. I also feel that circulation and temperature anomalies in the stratosphere suggest a relatively cold western North America and relatively mild eastern North America especially Eastern US. And despite the cold start to March in the Eastern US the models are predicting a return to mild conditions by the middle of March.


On Sea Ice Thickness

ice Charts from AARI showing ice extents by duration. Appearing in brown is Multi-year ice (surviving at least one melt season).

At the recent post Arctic Ice Surpasses 2018 Maximum, I was asked about measures of sea ice thickness and estimates of volume, combining extents (or concentrations) with thickness.  My response:

Agencies like DMI produce model-driven estimates of Arctic sea ice thickness. I limit my analysis to extents because they are observation-driven.

DMI says this:  “The figures are based on calculations using the DMI operational coupled ocean- and sea-ice model HYCOM-CICE. The total sea-ice volume is a product of the sea-ice concentration and its thickness.”

“Today, the sea-ice concentration is in general well estimated using satellite products, while the sea-ice thickness is poorly known. The model gives a realistic estimate of the total amount of sea-ice within the Arctic.” (concentration means extent). FWIW, DMI estimates of Arctic thickness have increased over the last decade.

It’s a complicated business to get remote signals of thickness, which varies with drifting and compaction from storms and currents.  Another way to get at the issue appears in the animation above with AARI ice charts.  They are derived from satellite imagery, configured so that the brown color represents multi-year ice that survived at least one melt season.   The animation shows the last 11 years had some low years, especially 2008, 2009 and 2013, with higher years since.  And obviously the locations of older ice are variable.

Of course there are other sea ice volume modelled products such PIOMAS.  For an insight into how complicated is estimating sea ice thickness from remote sensors see this article Estimating Arctic sea ice thickness and volume using CryoSat-2 radar altimeter data

Arctic Ice Surpasses 2018 Maximum

Atlan2019036to051
Sea Ice Extends on the Atlantic Side: 
The animation above shows the last two weeks on the Atlantic side, with Kara achieving its annual maximum and Barents growing ice up to 86% of its max last March. In the upper right the ice solidifies down to Svalbard and fast ice forms along the mainland.  On the left, Baffin ice thickens along the Labrador coast and  a large mass forms along Newfoundland. The Gulf of St. Lawrence is nearly iced over.  Below is the ice recovery on the Pacific side.

BerOk2019036to051

Bering on the right retreats and then recovers to stay at 95% of its 2018 maximum.  Meanwhile Okhotsk on the left shows a surge of sea ice, gaining almost 400k km2 over these two weeks.  Bering is well below the 12 year average, while Okhotsk has already passed its 2018 maximum and is 22% above the 12 year average.

The graph below shows February progress in ice extent recovery.
ArcticIce2019051

2019 ice extents declined slightly to start the month, then grew rapidly in the last two weeks to nearly match the 12-year average (2007 to 2018 inclusive).  SII lags MASIE by 100k km2 at this date. 2019 is presently matching 2017, and has nearly 500k km2 more ice than 2018.

Interestingly, 2019 extent has already surpassed 14.75 M km2, the 2018 maximum reached on day 74.  Note in the graph that 2017 peaks on day 53, the maximum extent that year.  The average maximum is 15.07 M km2 on day 62, so 2019 has 11 days more to reach that level.

The table below shows the distribution of ice in the various Arctic basins.

Region 2019051 Day 051 
Average
2019-Ave. 2018051 2019-2018
 (0) Northern_Hemisphere 14785938 14847524 -61587 14303929 482009
 (1) Beaufort_Sea 1070498 1070200 297 1070445 53
 (2) Chukchi_Sea 965972 964755 1217 955104 10868
 (3) East_Siberian_Sea 1087137 1087133 4 1087120 18
 (4) Laptev_Sea 897845 897842 3 897845 0
 (5) Kara_Sea 934970 920340 14629 917650 17319
 (6) Barents_Sea 685511 606250 79261 537870 147642
 (7) Greenland_Sea 564543 619655 -55112 440813 123730
 (8) Baffin_Bay_Gulf_of_St._Lawrence 1527391 1487134 40257 1731868 -204477
 (9) Canadian_Archipelago 853337 853036 302 853109 229
 (10) Hudson_Bay 1260903 1260717 186 1260838 66
 (11) Central_Arctic 3239858 3210652 29205 3154998 84860
 (12) Bering_Sea 428805 724586 -295781 211528 217277
 (13) Baltic_Sea 54788 107524 -52735 85965 -31177
 (14) Sea_of_Okhotsk 1194028 977205 216823 1059514 134514

The table shows how 2019 is matching the 12-year average almost everywhere.  Barents has edged 13% ahead of average, and is much higher than last year.  The slight overall deficit is mainly due to Bering ice down nearly 300k km2 to average, only partly offset by the surplus in Okhotsk and Central Arctic.

cg524a47d218458

Footnote:  At his AER blog  Arctic Oscillation and Polar Vortex Analysis and Forecasts Dr. Judah Cohen writes on February 18 regarding this cold winter in the Arctic and NH.  Excerpts in italics with my bolds.

screen-shot-2019-02-18-at-1.21.38-pm

Figure ii. Analysis of surface temperature anomalies ffrom 18 November 2018 until 15 February 2019. Taken from https://www.esrl.noaa.gov/psd/map/clim/glbcir_rnl.shtml.

This winter once again we had what I would refer to as a highly anomalous stratospheric PV split but not as extreme as 2009 and the temperature anomalies for the winter, or certainly post the PV split are probably not going to look that terribly different from 2009. The largest negative departures are likely to be in western North America and Siberia. I will show the winter temperature anomalies with the AER forecast posted in November and from the dynamical models but for today’s blog a quick and dirty surface temperature plot from NOAA will do (Figure ii). The most striking temperature anomalies are what I would consider as a couplet – strong positive temperature anomalies in the Barents-Kara Seas and strong negative temperature anomalies in Siberia. This temperature couplet has been the most consistent feature of Northern Hemisphere winters of probably the past 15-20 years. This gets to the heart of the debate does Arctic change influence mid-latitude weather. I think I have been as emphatic as anybody on the planet that the answer is yes, and this winter will only strengthen my conviction. The other continental region that is likely to have negative departures is Canada and since the PV spit the largest negative departures are centered in Western Canada.

figureiii_02182019

Since November, I have consistently stated that the largest sea ice anomalies and consequently the largest positive atmospheric temperature anomalies will be in the Barents-Kara Seas. I have also discussed how surprising I find it how cold the remainder of the Arctic has been this winter. As an example, I show in Figure iii the global temperature anomalies from yesterday February 17th the https://climatereanalyzer.org/. The Arctic positive temperature departure is 0.9°C equal to the NH and global temperature departure. This is a far cry from recent winters when the Arctic has warmed at a rate six times the rate of the remainder of the globe. Ironically the globe is currently experiencing Antarctic amplification and not Arctic amplification contrary to expectations.

My thoughts about March haven’t changed much since last week. The stratosphere has worked well as a predictor of North American temperature anomalies and for the most part they seem to support a continuation of cold temperatures focused in western North America. Despite this it is my own experience that cold air focused in western North America tends to shift east with time especially in the late winter. Therefore, based on this empirical observation I was expecting possibly a return to more sustained cold in the eastern US as winter winds down. This is now being predicted by both the GFS and ECMWF models. It is my experience that models may be too quick to predict a pattern change but they are often correct in anticipating the pattern change. But even assuming the eastern US turns colder, will it persist for more than just a few days? My confidence in such an outcome would increase if the Arctic finally warms something that has not really happened so far this winter.


Icy Arctic January 2019

eur2019016to028
Kara and Barents Seas Chilling Out: 
The animation above shows the last two weeks on the Atlantic side, with Kara achieving its annual maximum and Barents growing ice up to 75% of its max last March. Those two regions are the last to cool down this year. In the upper right the ice solidifies next to Svalbard and fast ice forms along the mainland. Icing begins in the Baltic.  In the center Greenland Sea ice reaches out toward Iceland.  On the left, Baffin ice thickens along the Labrador coast and is filling the Gulf of St. Lawrence.  Below is the ice recovery on the Pacific side.
alsk2019016to028

As we will see in the numbers below, Bering on the right has 100k km2 more ice now than  a year ago, though still lagging the 12-year average.  Okhotsk on the left is almost average and is reaching well south in its basin.

The graph below shows January progress in ice extent recovery.
arcticice2019028

2019 ice extents are tracking slightly lower than the 12-year average (2007 to 2018 inclusive).  SII lags MASIE by 157k km2 at this date. 2019 presently has 300k km2 more ice than 2017, and 500k km2 more ice than 2018

The table below shows the distribution of ice in the various Arctic basins.

Region 2019028 Day 029 
Average
2019-Ave. 2018028 2019-2018
 (0) Northern_Hemisphere 14216967 14304896 -87929 13720485 496482
 (1) Beaufort_Sea 1070498 1070200 297 1070445 53
 (2) Chukchi_Sea 966006 965999 7 965971 35
 (3) East_Siberian_Sea 1087137 1087133 4 1087120 18
 (4) Laptev_Sea 897845 897842 3 897845 0
 (5) Kara_Sea 935023 904103 30921 864752 70271
 (6) Barents_Sea 594754 552640 42114 448388 146366
 (7) Greenland_Sea 559919 588686 -28767 502182 57738
 (8) Baffin_Bay_Gulf_of_St._Lawrence 1355417 1335964 19453 1357109 -1693
 (9) Canadian_Archipelago 853337 853036 302 853109 229
 (10) Hudson_Bay 1260903 1259599 1305 1260838 66
 (11) Central_Arctic 3206769 3208914 -2145 3176440 30330
 (12) Bering_Sea 557702 657897 -100194 414234 143468
 (13) Baltic_Sea 84454 79993 4462 37674 46780
 (14) Sea_of_Okhotsk 765952 777348 -11397 718922 47030

The table shows how 2019 is matching the 12-year average almost everywhere.  Barents and Kara Seas have caught up and edged ahead of average, and are much higher than last year.  The slight overall deficit is due to Bering ice down 100k km2 to average, while being 143k km2 more than last year.

cg524a47d218458

Footnote:  At his AER blog  Arctic Oscillation and Polar Vortex Analysis and Forecasts Dr. Judah Cohen writes yesterday on this cold winter in the Arctic. Excerpts in italics with my bolds.

The Arctic has warmed at least as twice as fast as any other region of the globe and the accelerating warming of the Arctic relative to the rest of the globe but especially the Northern Hemisphere (NH) mid-latitudes is known as Arctic amplification. The cause of Arctic amplification is surprisingly complex and not well understood but the cause is at least partially related to Arctic sea ice and snow cover melt. Certainly, heading into this winter, I was very confident that we would observe an anomalously warm Arctic this winter especially coming off of last winter where the Arctic was record warm (see Figure i) and sea ice was record low extent.

But the Arctic was surprisingly cold last summer that prevented a new record low minimum for sea ice extent in September. Since then it has been at least strategically cold in regions across the Arctic this fall and winter that allowed sea ice to grow more extensive this winter in the Arctic basin compared to recent winters except in the Barents-Kara Seas. But even more surprising to me has been how cold the Arctic has consistently been this winter, especially when compared to recent winters. The only region in the Arctic Ocean basin that has been consistently warm is the Barents-Kara Seas.


Arctic Icing on All Sides Now


2019 with bears
With the usual fits and starts, the Arctic has now frozen solid in the central and Russian basins, and ice extents are recovering on all sides, Pacific, European and Canadian.  The laggards have been Kara and Barents Seas, but progress there is shown below.
barents2019001to018

Kara on the left is virtually iced over, while Barents ice has reached out to claim the eastern coast of Svalbard in the center.  On the right Greenland Sea ice is extending toward Iceland. Compared to 2018 March maximums, Kara is 99%, Greenland Sea is 98% and Barents is 60% of maximum. The image below shows 2019 ice recovery on the Canadian side.
baffin2019001to018

Upper left is Greenland sea ice reaching toward Iceland.  In the center Baffin Bay is growing ice southward down the Greenland coast.  On the right, ice extent has grown along Labrador to touch Newfoundland, and start filling in the Gulf of St. Lawrence. Baffin Bay/Gulf St. Lawrence is now 70% of 2018 March max, which was one of the higher extent years for that basin. Finally we return below to the Pacific ice recovery.
berok2019001to018

As reported previously, ice extent has rebounded here coinciding with the dissipating warm water Blob in North Pacific.  Bering Sea on the right started first and is now 17% greater than maximum last March.  Okhotsk sea ice has picked up the pace and is now 58% of March max.

arcticice2019018

In January, 2018 ice extents tracked the 12 year average (2007 to 2018 inclusive), at times pausing and then surging.  SII 2019 is showing slightly less ice, averaging 100k km2 lower.  As of yesterday, this year has gained about 500k km2 more ice than either 2017 or 2018.

algore_ice_gone_by_2013


Pacific Ice See Saw Returns

b&o2019001to013

As we have seen in past winters, ice in the Pacific Arctic tends to grow in fits and spurts, often alternating between Bering and Okhotsk Seas.  This see saw began late December with Bering adding ice to surpass 2018 maximum in that basin, while Okhotsk paused.  The above image of the first two weeks of 2019 shows Okhotsk on the left growing ice while Bering pulled back a bit.  Then in the last two days both basins added extents to set new highs for the season.  Combined the two seas ice extents are slightly above the 12 year average at this time. With the disappearance of the Blob of warm water in the North Pacific, both basins appear to be in ice recovery mode.

cg524a47d218458

seesawSee Also:Snowing and Freezing in the Arctic


Pacific Arctic Ice Recovering

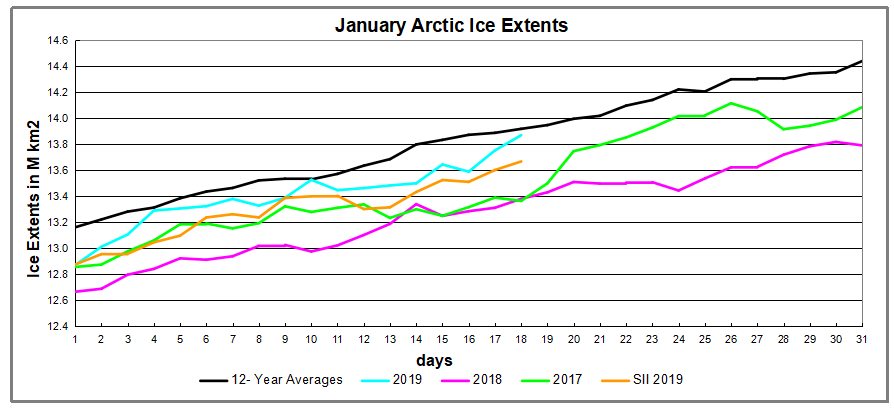
Open image in new tab to enlarge.

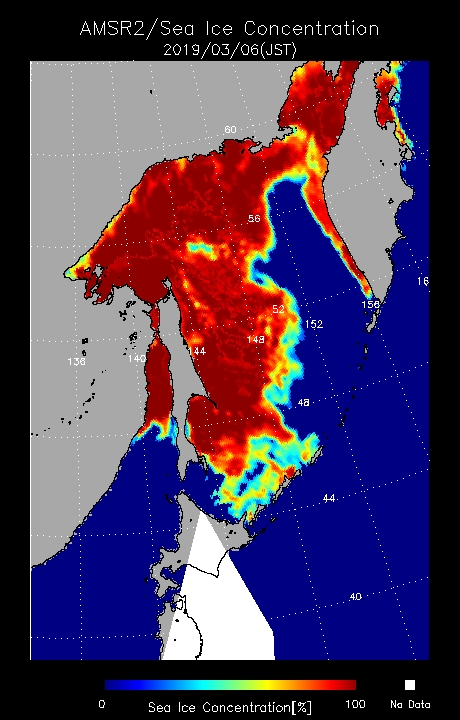
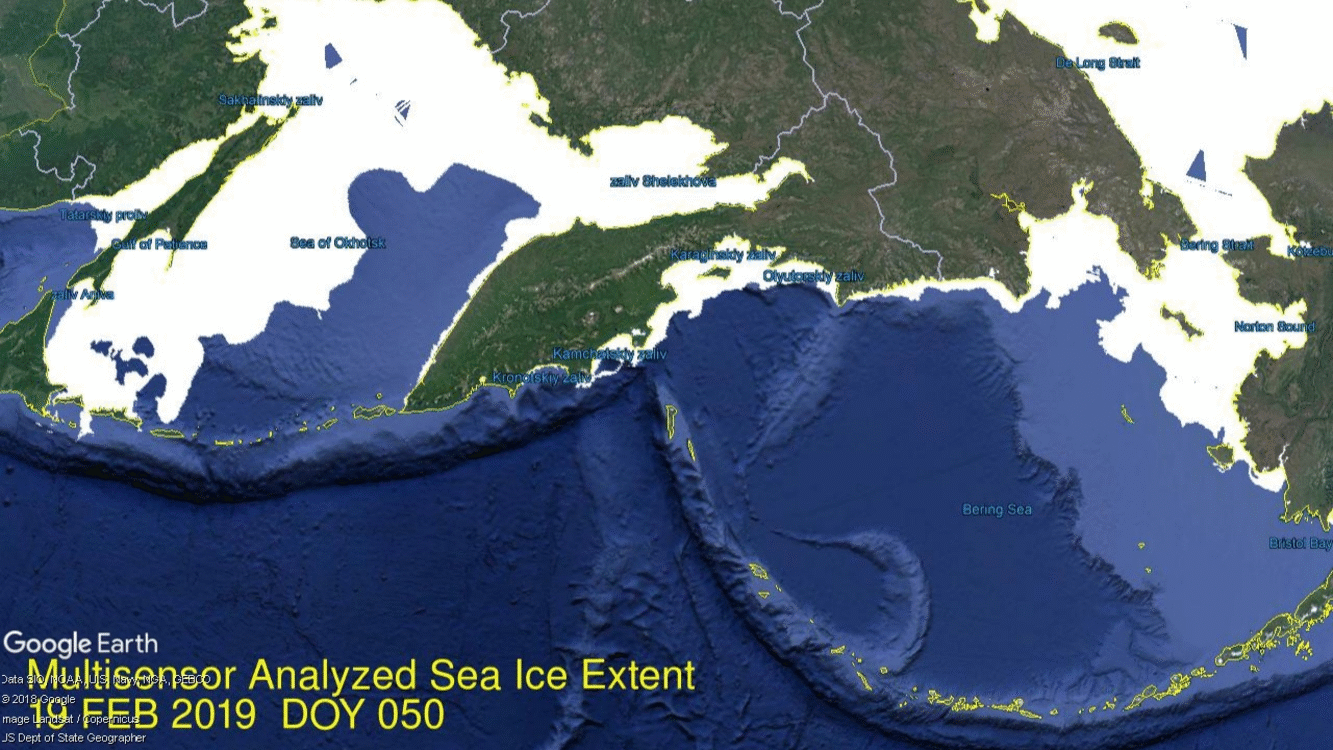
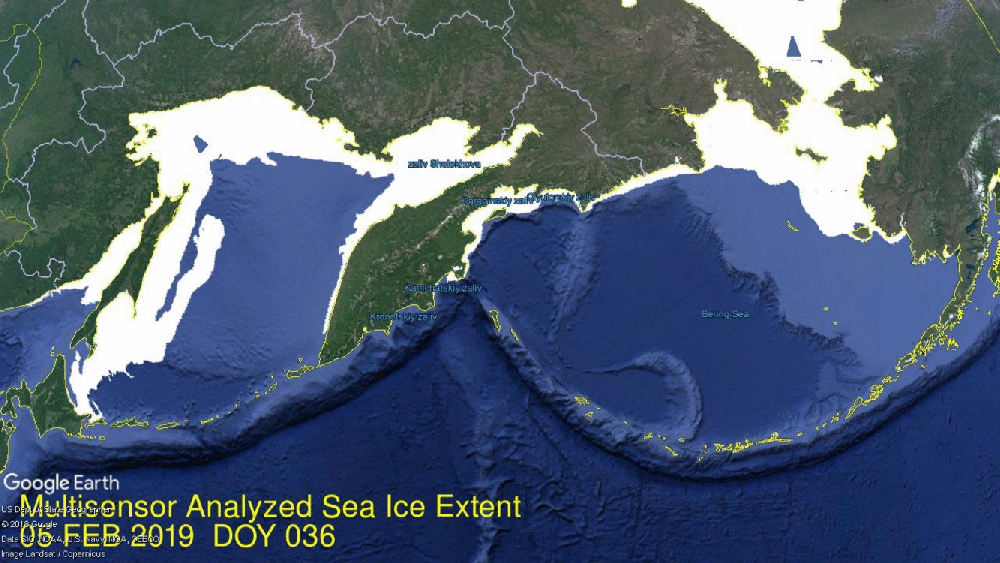
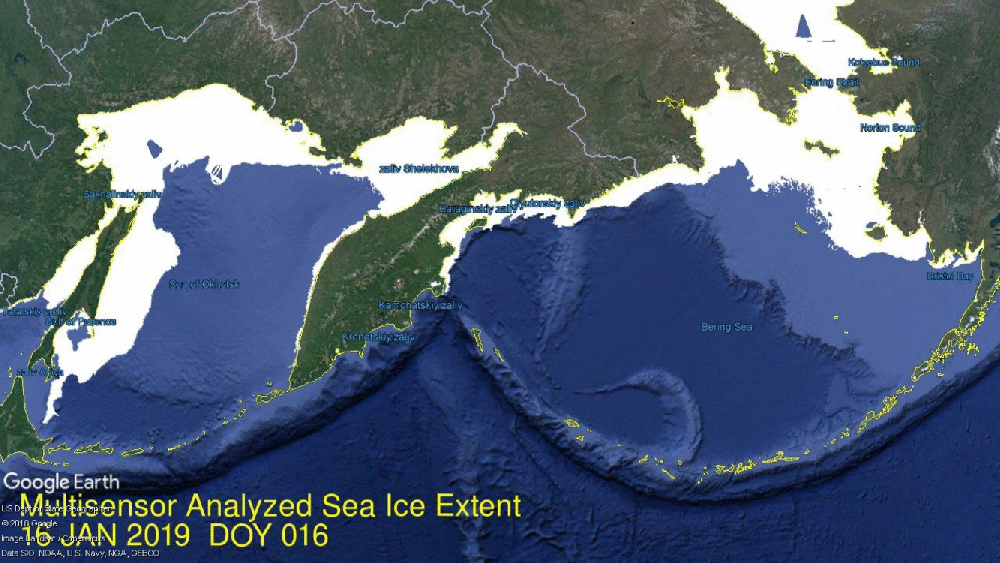
The image shows ice extents on January 7 for the last three years.  The two Pacific basins are Bering Sea on the right and Okhotsk on the left.  In recent years they had less ice coinciding with the warm Blob in the North Pacific, but it is obvious how strongly Bering is freezing this year. Together they are tracking the combined 12 year average, and Okhotsk is growing ice strongly along the Kamchatka peninsula dividing the two seas.

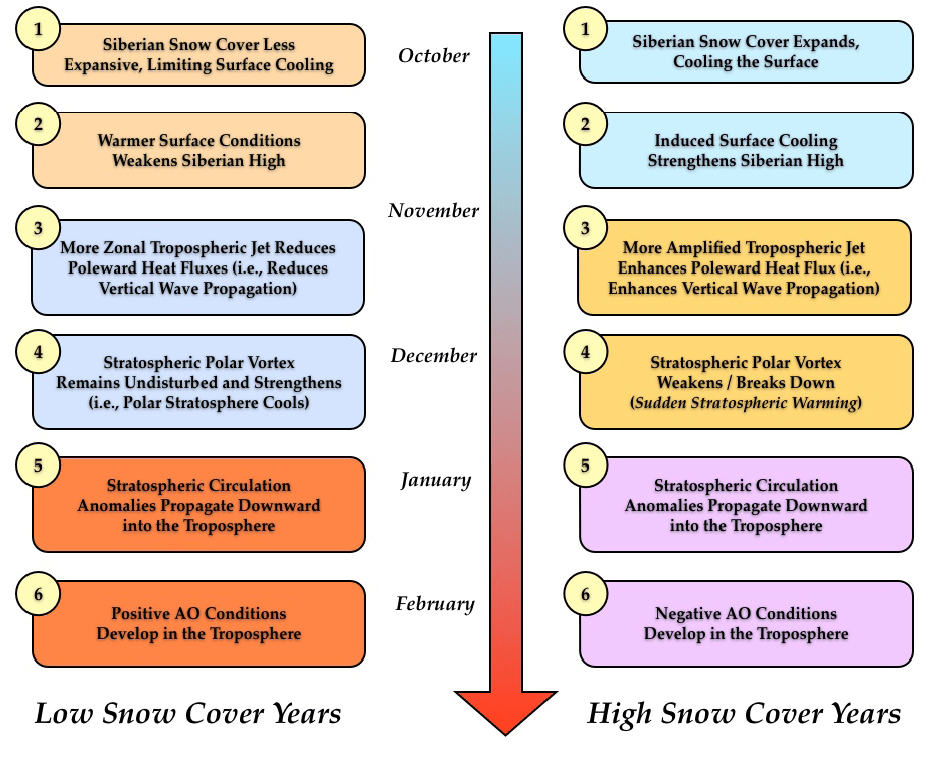
An updated outlook for the NH winter comes on January 7, 2019 from Dr. Judah Cohen of AER Arctic Oscillation and Polar Vortex Analysis and Forecasts  Excerpts with my bolds.

I have once again received some attention for a forecast of a PV (Polar Vortex) disruption to be followed by widespread severe winter weather. After the winter of 2005/06, I know that I cannot guarantee an outcome no matter how tantalizing close it seems to the finish line. That winter, all six steps in our model verified and yet the forecast busted, at least for the Eastern US. And I think the lessons from that winter are applicable to this winter. There has been a lot of discussion, at least on Twitter, will the stratospheric PV split couple to the surface. I don’t think the question is whether the stratosphere and troposphere will couple, there is already strong evidence that they are coupling. The stratospheric and troposphere PVs are vertically stacked as I showed in a tweet earlier today and can be seen from plots below. Furthermore, the most anomalous cold and snowfall across the NH are currently co-located with those PVs.

Looking forward it looks like the coupling will strengthen over time. The GFS is predicting the first “drip” of warm polar cap geopotential height anomalies from the stratosphere to the troposphere at the end of the week and this weekend which is reflected in a short term drop in the AO. The GFS is predicting more “dripping” for the following weekend though more uncertainty exists with any event beyond a week. But regardless how robust the stratosphere-troposphere coupling currently looks, the magnitude and duration on the NH weather is still highly uncertain. And in an attempt to troll me, Mother Nature has delivered a PV split that is very much reminiscent of the PV split in winter 2006 (see Figure iii).

Figure iii. a) Observed 10 mb geopotential heights (contours) and geopotential height anomalies (m; shading) for 1 – 3 February 2006 and b) Observed 500 mb geopotential heights (contours) and geopotential height anomalies (shading) for 1 – 28 February 2006.

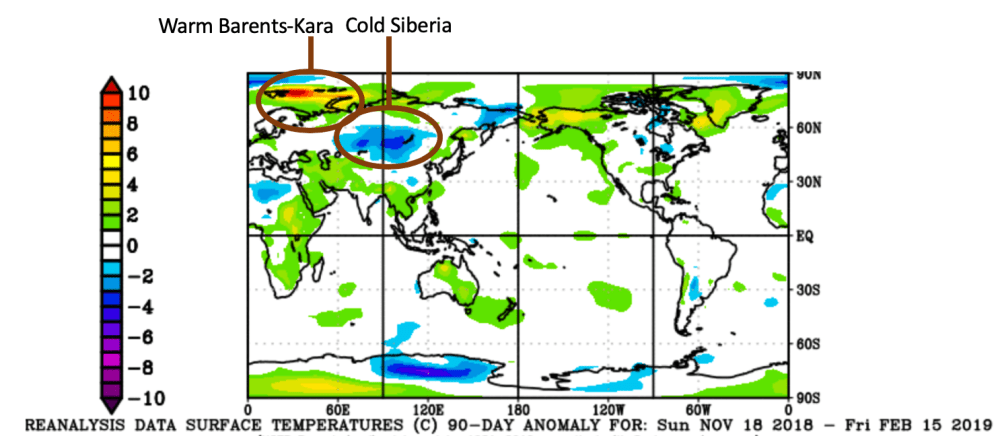
I believe that for a robust tropospheric and weather response to the stratospheric PV split a warm Arctic in the lower to mid-troposphere is critical. If I were to make a winter forecast for winter 2005/06, I would still make the same forecast and I still don’t understand what went wrong with the forecast that winter. In Figure iii I also include the 500 mb geopotential height pattern from that winter and in contrast to the stratosphere the mid-troposphere remained cold in the Central Arctic with low pressure right over the North Pole. Surprisingly, to me at least, the Arctic in the low to mid-troposphere has been relatively cold this winter and for the most part, the forecasts are for that to continue. I think the warmer the Arctic relative to normal over the coming weeks the more likely severe winter weather including cold and snow to be widespread across the NH.

Troughing/negative geopotential height anomalies previously centered near Alaska and the Gulf of Alaska are predicted to continue to drift towards the Dateline supporting ridging/positive geopotential height anomalies downstream over western North America centered over Western Canada with more troughing/negative geopotential height anomalies across eastern North America (Figure 5b). This will favor normal to above normal temperatures across Western Canada and the Western US with normal to below normal temperatures for the Eastern US and especially Eastern Canada (Figure 8). The ECMWF model is predicting less amplified ridging in western North America with milder temperatures in the Eastern US.

Currently the stratospheric PV has broken into several pieces or daughter vortices. The major daughter vortex is centered near Scandinavia and a minor daughter vortex is centered over Quebec and New England with a possible third daughter vortex over the North Pacific with ridging and accompanying warming centered in the Beaufort Sea (Figure 12). The daughter vortex over Scandinavia is predicted to drift west and further split into two with one vortex over Northwest Russia and another over Western Europe with the other vortex over Quebec and New England drifting west into Central Canada.

Figure 12. (a) Analyzed 10 mb geopotential heights (dam; contours) and temperature anomalies (°C; shading) across the Northern Hemisphere for 7 January 2019. (b) Same as (a) except forecasted averaged from 13 – 17 January 2019. The forecasts are from the 00Z 7 January 2019 GFS operational model.

The predicted details of the stratospheric PV disruption are showing better consistency among the weather models. An MMW (Major Mid-winter Warming) has occurred as well as a PV split. Instead there still remains much uncertainty with the impacts of the stratospheric warming on the weather. Following the peak of the stratospheric warming, I would expect the warm/positive PCHS to “drip” down into the troposphere, which is now predicted by at least the GFS. A sudden stratospheric warming not only leads to a warm Arctic in the stratosphere but also at the surface as well. And a warmer Arctic favors more severe winter weather in the NH midlatitudes including the Eastern US. I do think there is uncertainty how warm much the Arctic warms in the lower troposphere and surface and could play a major role in the duration and magnitude of the weather impacts of the PV split.

Figure 9. Forecasted snowfall anomalies (mm/day; shading) from 18 – 22 January 2019. The forecasts are from the 00Z 7 January 2019 GFS ensemble.

Once again additional snowfall is possible across much of northern Eurasia including Siberia, Western Asia, Scandinavia, Central and even possibly Western Europe (Figure 9). Seasonable to cold temperatures across Eastern Canada and even the Northeastern US will also support potentially new snowfall (Figure 9). Mild temperatures could result in snowmelt across Southeastern Europe, Turkey, Alaska, Western Canada and the Western US (Figure 9).

See Also:Snowing and Freezing in the Arctic

Happy Arctic New Year 2019


2019 with bears
With the end of December, Arctic ice is rebuilding in the dark up to its annual maximum before the beginning of dawn in March.  Since many of the seas are already at their maximum extents, the coming months will only add about 2M km2 to the approximately 13M km2 of ice in place.

BandO2018340to365

The map above shows the remarkable growth of Bering Sea ice in December.  The Bering ice extent grew from 57k km2 to 459k km2 yesterday, exceeding the March Bering maximum of 451k km2.  Okhotsk has grown ice more slowly, now at 347k km2 slightly below average.  Note Chukchi Sea north of Bering froze completely as of day 350.

The regrowth of Arctic ice extent was slower than usual until recently. After showing resilience in September, ending higher than 2007, ice growth lagged in October, then recovered in November and kept pace with average through most of December.

Arctic2018365

In December, 2018 ice extent has grown by close to 11 year average until the last 10 days.  As of Dec. 31, 2018 ice extent is ~300k km2  (2%) less than average (2007 to 2017).  The chart also shows the variability of ice extent over the years during this month.  2007 ramped up to match average, while 2017 was almost 200k km2 lower than 2018 at year end.  SII is showing 2018 lower than MASIE 2018, closely matching MASIE 2017.

The table below shows this year compared to average and to 2017 for day 365.  Since several years in the dataset were missing day 365, I am making the comparison a day later.

Region 2018365 Day 365 
Average
2018-Ave. 2017365 2018-2017
 (0) Northern_Hemisphere 12805066 13107229 -302163 12628187 176880
 (1) Beaufort_Sea 1070498 1070245 253 1070445 53
 (2) Chukchi_Sea 966006 963990 2016 943883 22124
 (3) East_Siberian_Sea 1087137 1087133 5 1087120 18
 (4) Laptev_Sea 897845 897842 3 897845 0
 (5) Kara_Sea 773183 889865 -116682 892689 -119507
 (6) Barents_Sea 261190 437725 -176534 331819 -70629
 (7) Greenland_Sea 522009 582349 -60340 555757 -33748
 (8) Baffin_Bay_Gulf_of_St._Lawrence 1069626 1023935 45691 978074 91552
 (9) Canadian_Archipelago 853337 853059 279 853109 229
 (10) Hudson_Bay 1260903 1230818 30086 1260838 66
 (11) Central_Arctic 3194383 3206157 -11774 3191526 2858
 (12) Bering_Sea 458758 422870 35888 194350 264408
 (13) Baltic_Sea 20842 35624 -14782 13345 7497
 (14) Sea_of_Okhotsk 347016 375834 -28818 336595 10421

The main deficit to average is in Barents and Kara Seas on the Atlantic side, partly offset by surpluses in Hudson and Baffin Bays and in Bering Sea on the Pacific side.  Note the huge increase in Bering ice this year compared to 2017.  This coincides with the disappearing warm water Blob in the North Pacific, as reported by Cliff Mass.

No one knows what will happen to Arctic ice.

Except maybe the polar bears.

And they are not talking.

Except, of course, to the admen from Coca-Cola

Summary

There is no need to panic over Arctic ice this year, or any year.  It fluctuates according to its own ocean-ice-atmospheric processes and we can only watch and be surprised since we know so little about how it all works.  Judah Cohen at AER thinks much greater snowfall in October and since will make for a very cold winter.  We shall see.  It is already adding more mass to the Greenland ice sheet than in previous years.

cohen-schematic

See Natural Climate Factors: Snow

In any case, the early and extensive ice in the Canadian Arctic regions was well received by our polar bears.


Bering Ice is Back!

Remarkable growth of ice in Bering Sea has been observed over the last three weeks as shown above.  The extent went from 57k km2 to 424k km2 during that period, and is presently 94% of the maximum Bering ice extent in March 2018.  To put this event in context, note that Bering 2018 maximum was low and pulled down the overall Arctic extent in March.  For example, 2017 Bering maximum was 725k km2 compared to 2018 max of 451k km2, or a difference of 48%.  We will be watching to see how much will be added in the coming 3 months.

Note also that Chukchi north of Bering completed freezing over on day 352,  December 18, 2018.  We can also see that Okhotsk on the left was freezing at the same rate as Bering, but added no new ice in the last week.

The Bering ice recovery coincides with the demise of the North Pacific “Warm Blob” as reported by Cliff Mass on Dec. 24 Sad News: No More BLOB Excerpts in italics with my bolds.

Starting the autumn, the BLOB was relatively weak.  To illustrate, here is the sea surface temperature anomaly (difference from normal) for the end of October–as much as 2-3C warmer than normal!  This was associated with an area of persistent high pressure over the northeast Pacific.

But compare that situation to two days ago.  The BLOB is essentially gone, with an area of cooler than normal water developing.  Only immediately along the coast is the water temperature slightly above normal.


What killed the BLOB?   Persistent storminess over the northeast Pacific, something that is no surprise to the storm-battered residents of the Pacific Northwest. 

Outlook from Dr. Judah Cohen Dec. 24, 2018 at Arctic Oscillation and Polar Vortex Analysis and Forecasts

In conclusion there is still much uncertainty with the predicted PV disruption and the longer it takes for the PV disruption to unfold the longer it will take for any impacts to reach the surface. And I would argue it makes very important differences on the sensible weather whether the PV splits, and if it splits the duration and the location of the sister vortices. But a robust PV split increases the likelihood of severe winter weather in the near term and more so long term for both the Eastern US and Europe. Also expect ongoing model forecast volatility until the circulation anomalies associated with the PV disruption reaches the tropopause as we argue in my most recent paper Cohen et al. 2018.

One last thing that I feel may play an important role on the NH circulation are sea ice anomalies. For months I have been anticipating that the greatest sea ice anomalies this winter will be in the Barents-Kara Seas. That is quite apparent in today’s Figure 15. Typically blocking is focused across Greenland following a PV disruption. But abundant sea ice near Greenland and the lack of sea ice in the Barents-Kara Seas may help focus future high latitude blocking closer to Europe this winter. Strong Scandinavian/Barents-Kara Seas blocking may favor an eastward shift of the cold air across Europe. Cold air may drain into Eastern Europe but be blocked from Western Europe.

Finally, today from nullschool we can see the North Pacific twin gyres at work:

https://earth.nullschool.net/#current/wind/surface/level/orthographic=-188.36,56.12,853/loc=141.408,61.951

Summary

Several Alaskan kids are in the group suing the US government over fears of Arctic warming.  It’s looking like they may get relief from nature before it can come from the courts.


Arctic Pacific Flash Freezing in December

BO2018338to349Eleven Days in Pacific Arctic are shown in the above animation.  In the upper center, Chukchi finally froze completely, adding 260k km2 of ice to reach 99.8% of maximum.  (Disregard the blue jagged arc as a sensor artifact.)  Meanwhile, serious freezing began in the two Pacific basins.  Bering to the south of Chukchi went from 57k km2 to 195k, now 43% of maximum.  Okhotsk to the left went from 58k km2 to 223k, now 19% of maximum.

The graph below shows December progress in ice extent recovery.

Arctic2018349From days 335 to 339, 2018 extents were flat and went below average.  Now freezing has resumed as shown in the animation above and tracking close to average again in the graph.  At day 349 (Dec. 15) MASIE shows 2018 1 day behind average (100k km2),  200k km2 greater than SII 2018,  140k km2 greater than 2007 and 358k km2 more than 2016.


The central Arctic and Eurasian shelf seas are completely frozen, typical for this time of year.  The Pacific was a little slower than usual to start, but is now coming on strong.  The Canadian side froze early and is of course locked in for the winter.  The only remaining deficit of note is Barents Sea which hasn’t added ice in the last two weeks.

cg524a47d218458