Icy Arctic January 2019
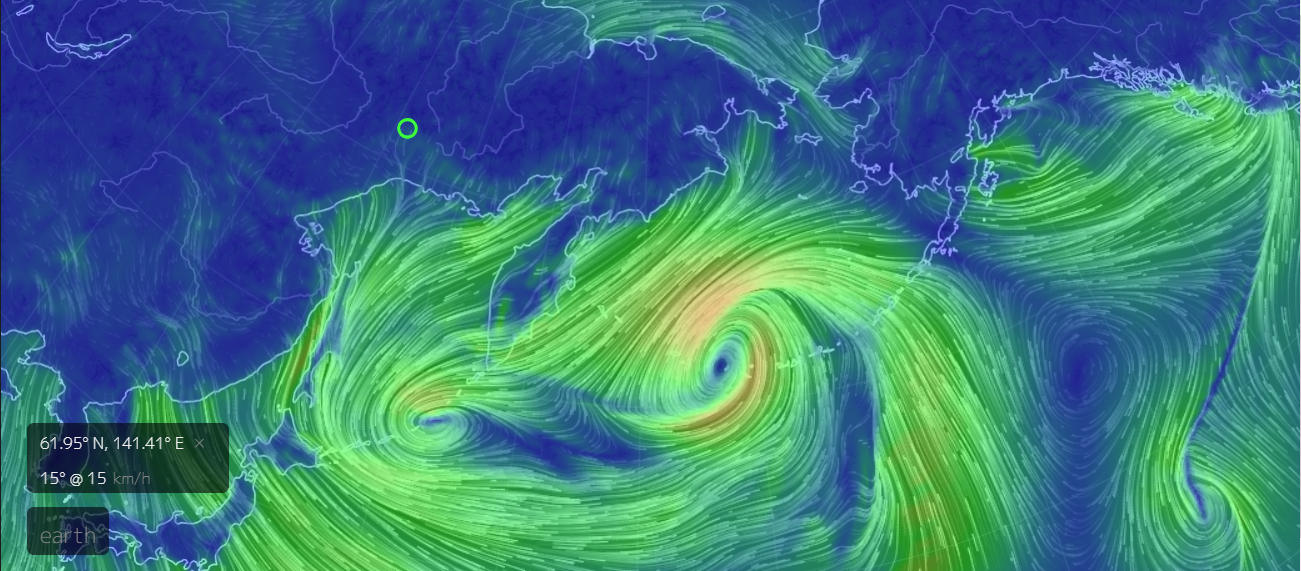
Kara and Barents Seas Chilling Out: The animation above shows the last two weeks on the Atlantic side, with Kara achieving its annual maximum and Barents growing ice up to 75% of its max last March. Those two regions are the last to cool down this year. In the upper right the ice solidifies next to Svalbard and fast ice forms along the mainland. Icing begins in the Baltic. In the center Greenland Sea ice reaches out toward Iceland. On the left, Baffin ice thickens along the Labrador coast and is filling the Gulf of St. Lawrence. Below is the ice recovery on the Pacific side.
As we will see in the numbers below, Bering on the right has 100k km2 more ice now than a year ago, though still lagging the 12-year average. Okhotsk on the left is almost average and is reaching well south in its basin.
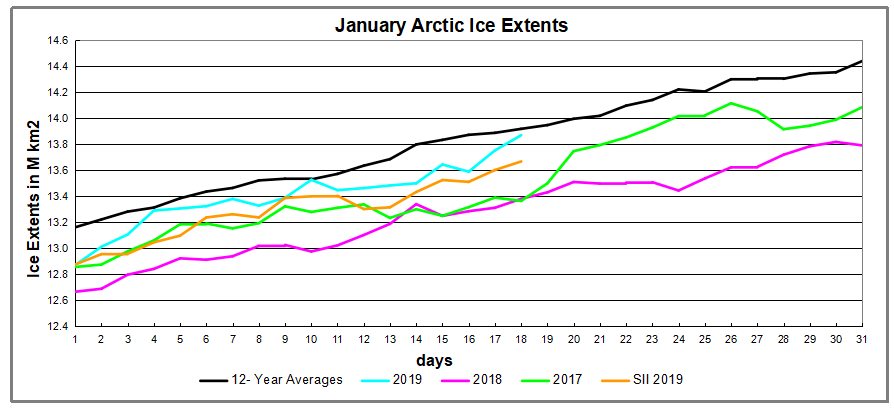
The graph below shows January progress in ice extent recovery.
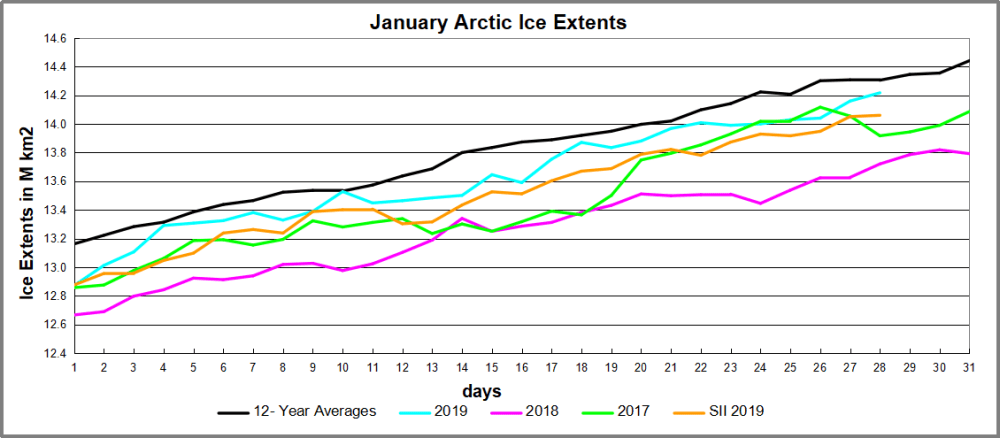
2019 ice extents are tracking slightly lower than the 12-year average (2007 to 2018 inclusive). SII lags MASIE by 157k km2 at this date. 2019 presently has 300k km2 more ice than 2017, and 500k km2 more ice than 2018

The table below shows the distribution of ice in the various Arctic basins.
| Region | 2019028 | Day 029 Average |
2019-Ave. | 2018028 | 2019-2018 |
| (0) Northern_Hemisphere | 14216967 | 14304896 | -87929 | 13720485 | 496482 |
| (1) Beaufort_Sea | 1070498 | 1070200 | 297 | 1070445 | 53 |
| (2) Chukchi_Sea | 966006 | 965999 | 7 | 965971 | 35 |
| (3) East_Siberian_Sea | 1087137 | 1087133 | 4 | 1087120 | 18 |
| (4) Laptev_Sea | 897845 | 897842 | 3 | 897845 | 0 |
| (5) Kara_Sea | 935023 | 904103 | 30921 | 864752 | 70271 |
| (6) Barents_Sea | 594754 | 552640 | 42114 | 448388 | 146366 |
| (7) Greenland_Sea | 559919 | 588686 | -28767 | 502182 | 57738 |
| (8) Baffin_Bay_Gulf_of_St._Lawrence | 1355417 | 1335964 | 19453 | 1357109 | -1693 |
| (9) Canadian_Archipelago | 853337 | 853036 | 302 | 853109 | 229 |
| (10) Hudson_Bay | 1260903 | 1259599 | 1305 | 1260838 | 66 |
| (11) Central_Arctic | 3206769 | 3208914 | -2145 | 3176440 | 30330 |
| (12) Bering_Sea | 557702 | 657897 | -100194 | 414234 | 143468 |
| (13) Baltic_Sea | 84454 | 79993 | 4462 | 37674 | 46780 |
| (14) Sea_of_Okhotsk | 765952 | 777348 | -11397 | 718922 | 47030 |
The table shows how 2019 is matching the 12-year average almost everywhere. Barents and Kara Seas have caught up and edged ahead of average, and are much higher than last year. The slight overall deficit is due to Bering ice down 100k km2 to average, while being 143k km2 more than last year.
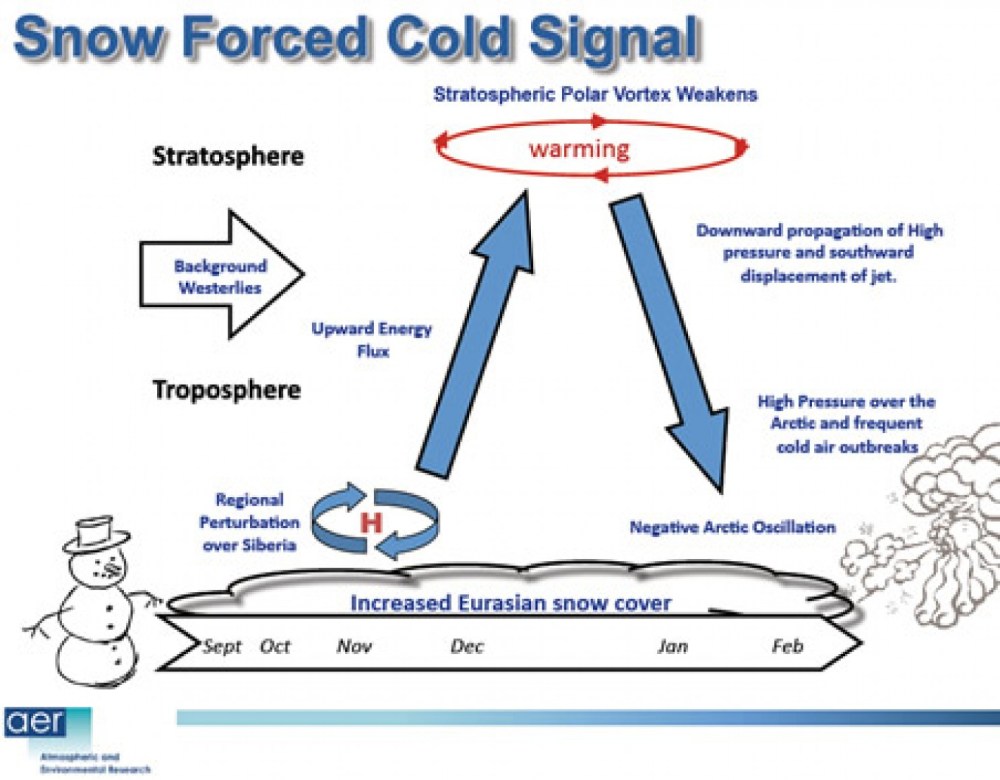
Footnote: At his AER blog Arctic Oscillation and Polar Vortex Analysis and Forecasts Dr. Judah Cohen writes yesterday on this cold winter in the Arctic. Excerpts in italics with my bolds.
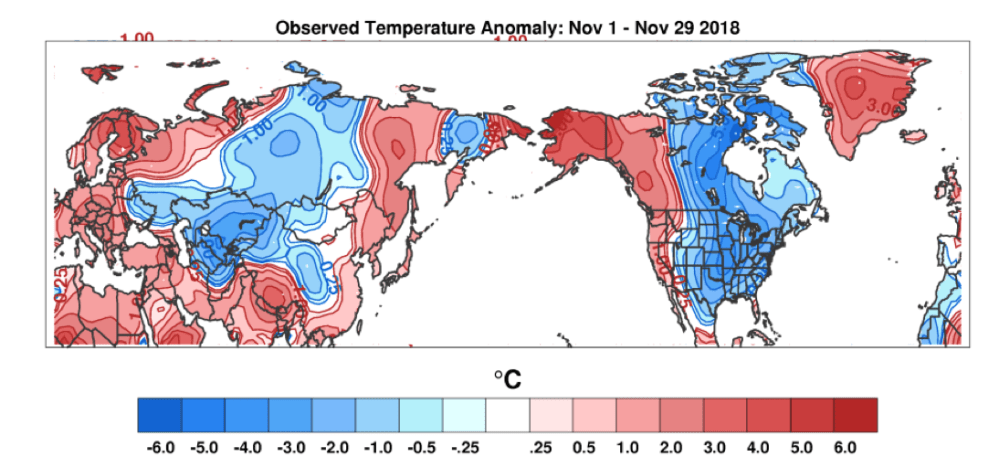
The Arctic has warmed at least as twice as fast as any other region of the globe and the accelerating warming of the Arctic relative to the rest of the globe but especially the Northern Hemisphere (NH) mid-latitudes is known as Arctic amplification. The cause of Arctic amplification is surprisingly complex and not well understood but the cause is at least partially related to Arctic sea ice and snow cover melt. Certainly, heading into this winter, I was very confident that we would observe an anomalously warm Arctic this winter especially coming off of last winter where the Arctic was record warm (see Figure i) and sea ice was record low extent.
But the Arctic was surprisingly cold last summer that prevented a new record low minimum for sea ice extent in September. Since then it has been at least strategically cold in regions across the Arctic this fall and winter that allowed sea ice to grow more extensive this winter in the Arctic basin compared to recent winters except in the Barents-Kara Seas. But even more surprising to me has been how cold the Arctic has consistently been this winter, especially when compared to recent winters. The only region in the Arctic Ocean basin that has been consistently warm is the Barents-Kara Seas.


 See
See


 Figure 9. Forecasted snowfall anomalies (mm/day; shading) from 18 – 22 January 2019. The forecasts are from the 00Z 7 January 2019 GFS ensemble.


 Eleven Days in Pacific Arctic are shown in the above animation. In the upper center, Chukchi finally froze completely, adding 260k km2 of ice to reach 99.8% of maximum. (Disregard the blue jagged arc as a sensor artifact.) Meanwhile, serious freezing began in the two Pacific basins. Bering to the south of Chukchi went from 57k km2 to 195k, now 43% of maximum. Okhotsk to the left went from 58k km2 to 223k, now 19% of maximum.
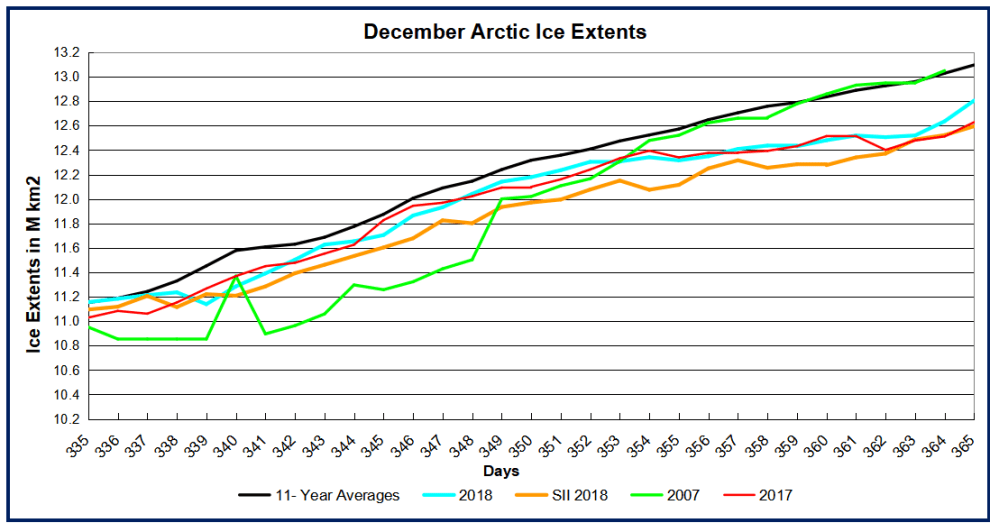
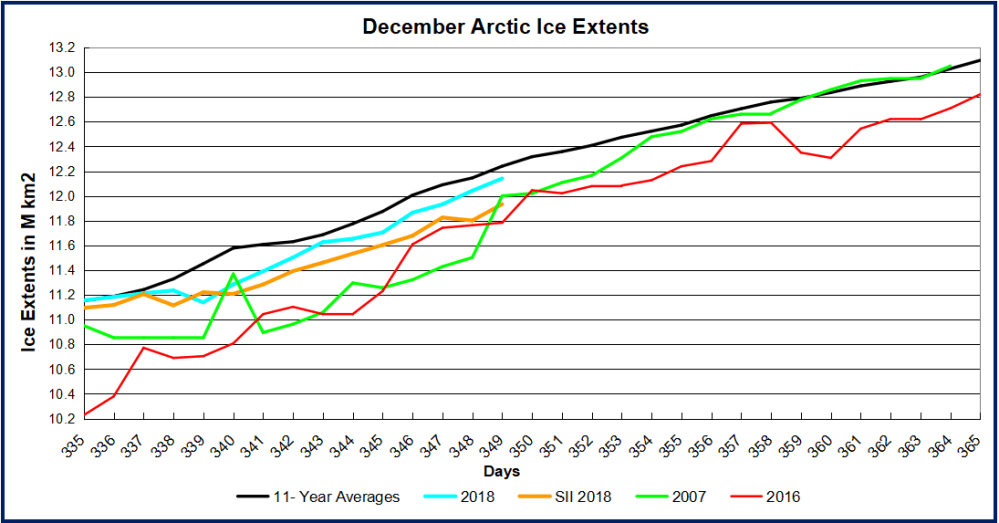 From days 335 to 339, 2018 extents were flat and went below average. Now freezing has resumed as shown in the animation above and tracking close to average again in the graph. At day 349 (Dec. 15) MASIE shows 2018 1 day behind average (100k km2), 200k km2 greater than SII 2018, 140k km2 greater than 2007 and 358k km2 more than 2016.
 Seventeen Days in Hudson Bay are shown in the above animation. In the lower center, Hudson Bay pushed its ice extent up to 1.24M km2, 98% of maximum. Just to the northeast, Hudson Strait and Ungava Bay are completely frozen over, with Baffin Bay reaching down. At the top left you can see Chukchi Sea growing ice toward Bering Strait.
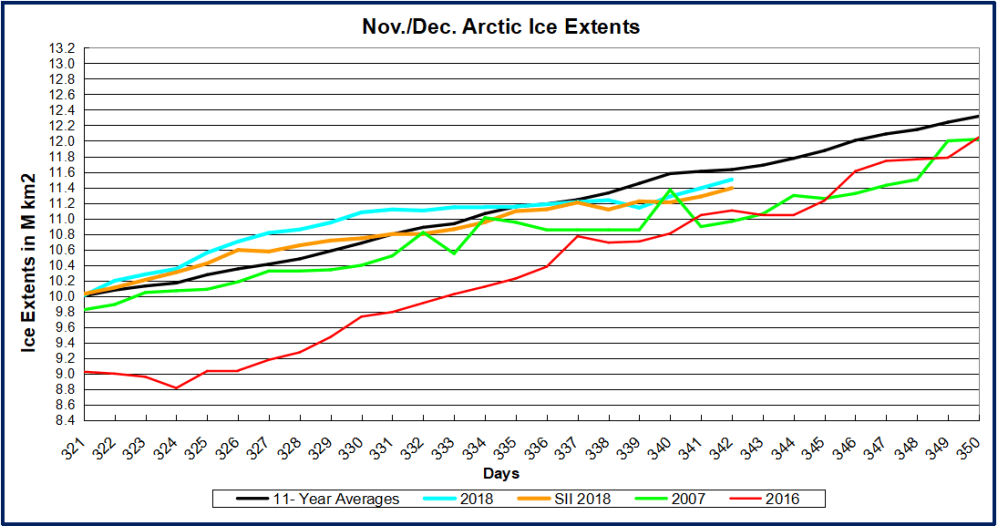 From days 330 to 339, 2018 extents were flat and went below average. Now freezing has resumed as shown in the animation above and nearing average again in the graph. At day 342 (Dec. 8) 2018 is 540k km2 greater than 2007 and 400k km2 more than 2016.
 Eighteen Days in Hudson Bay are shown in the above animation. In the lower center, Hudson Bay more than doubled its ice extent up to 1.07M km2, 85% of maximum. Just to the northeast, Hudson Strait and Ungava Bay are almost frozen over, with Baffin Bay reaching down. At the top right you can see Greenland Sea ice reaching out toward Iceland.