Arctic Update: Hell Freezing Over

The title of this post is over the top, but was provoked by the repeated claims last summer earth was going to hell right now. For example,
The world’s summer of hell. Hot, hot, hot: Summer of extremes setting heat records around the world, July 2018, CBC
Summer 2018: On the highway to hell? August 2018, Beyond Ratings
Earth at risk of becoming ‘hothouse’ if tipping point reached, if we can’t stop it we’re in a hell of a mess..August 2018, CNN
The Summer of Hell. Climate change is here and we are living in its embers. August 2018 The Week (US)
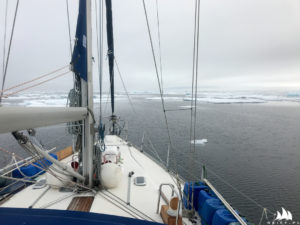
Meanwhile, back in reality, Arctic ice is spreading everywhere. The image below shows the European side in the last two weeks:

Laptev and East Siberian in the middle are frozen solid. On the right Kara has added 400k km2 ice extent up to 700k km2, 75% of March maximum. Below is the freezing proceeding on the Canadian side.

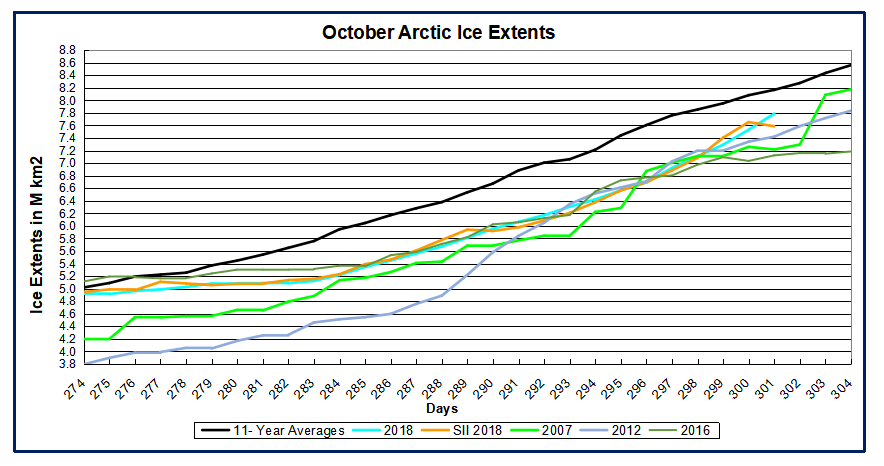
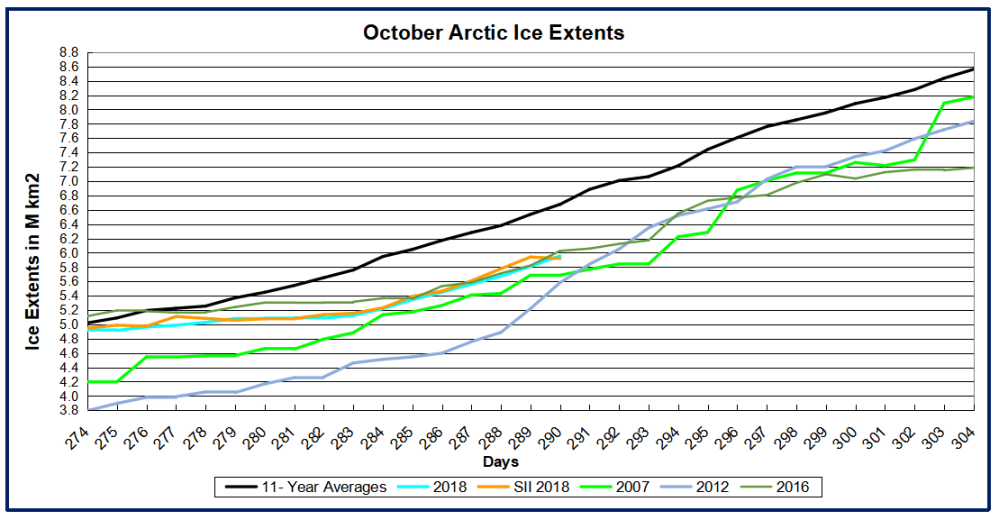
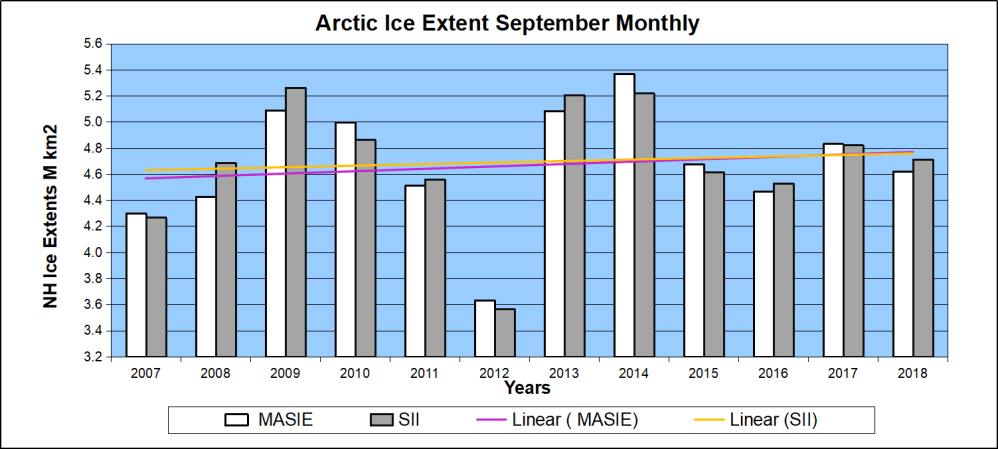
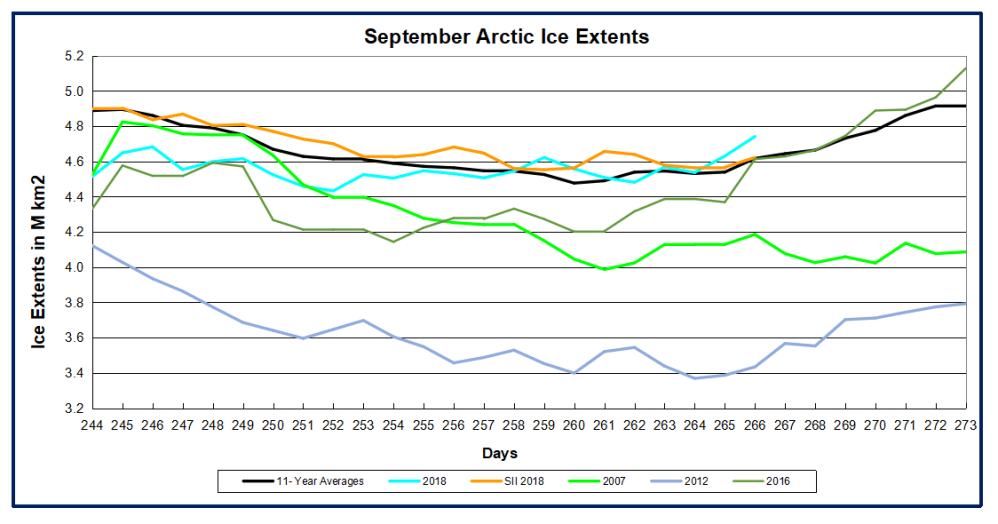
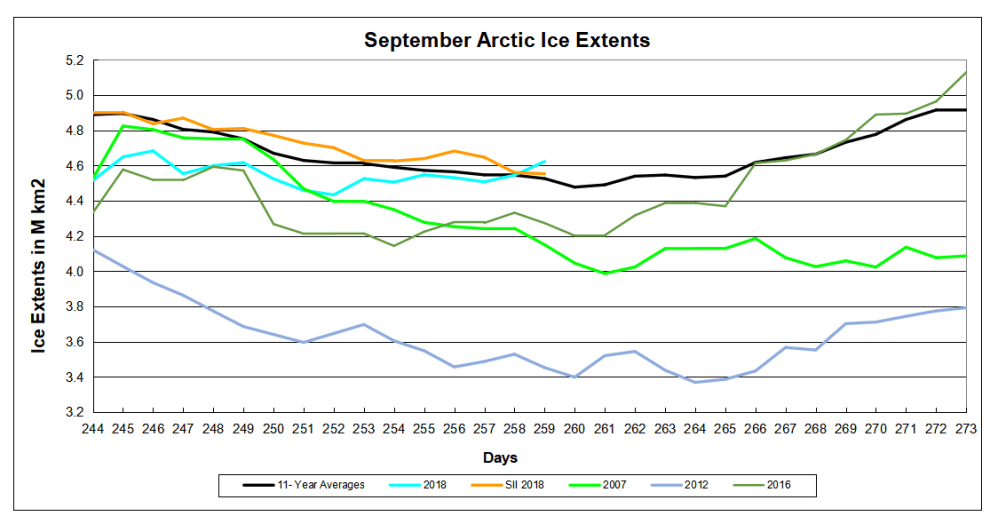
Baffin Bay in the center next to Greenland is extending south and added 300k km2. Hudson Bay on the left added 400k km2, with the western coastline freezing all the way down into James Bay. The graph below shows 2018 is matching the 11-year average after being down in October.
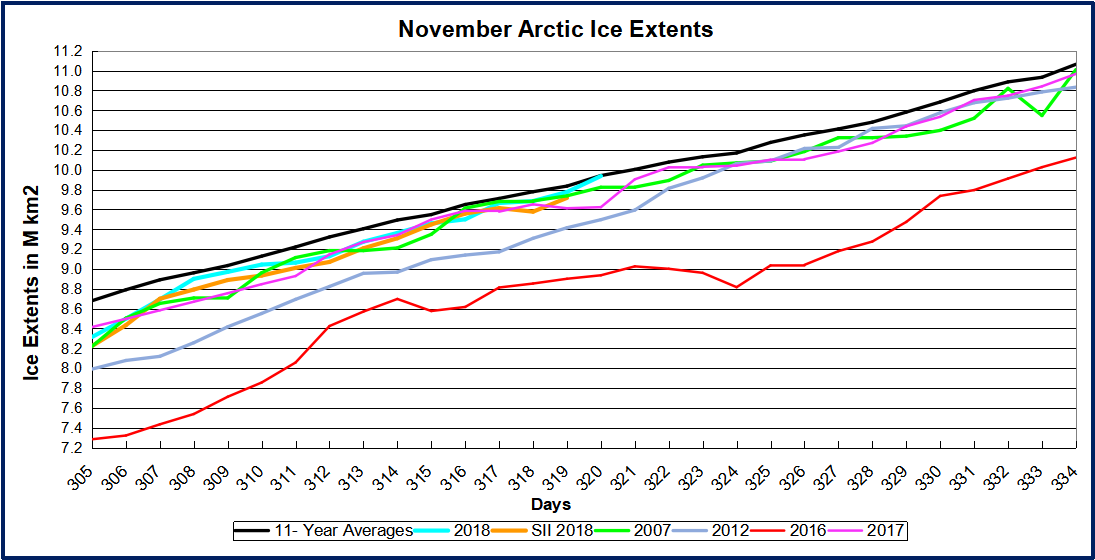
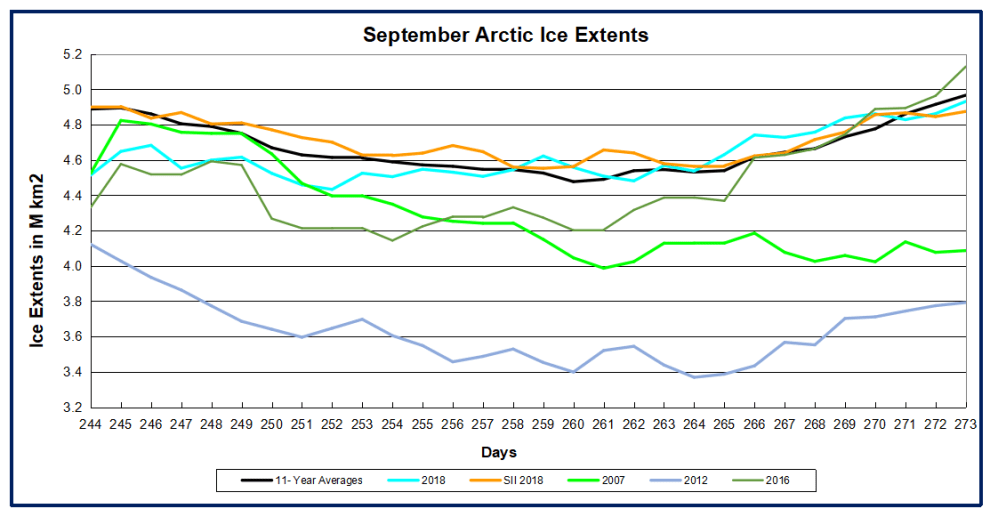
Both MASIE and SII have 9.9M km2 ice extents matching the average for day 320, Nov. 16. 2007, 2012 and 2017 all recovered from their September lows, while 2016 was much slower to refreeze.

| Region | 2018320 | Day 320 Average |
2018-Ave. | 2007320 | 2018-2007 |
| (0) Northern_Hemisphere | 9937017 | 9942096 | -5078 | 9824193 | 112824 |
| (1) Beaufort_Sea | 1069588 | 1064590 | 4999 | 1059182 | 10406 |
| (2) Chukchi_Sea | 615028 | 667249 | -52222 | 519486 | 95541 |
| (3) East_Siberian_Sea | 1085198 | 1077597 | 7601 | 1055581 | 29617 |
| (4) Laptev_Sea | 897845 | 897648 | 197 | 897845 | 0 |
| (5) Kara_Sea | 701192 | 655668 | 45524 | 774297 | -73105 |
| (6) Barents_Sea | 65798 | 167138 | -101340 | 149482 | -83684 |
| (7) Greenland_Sea | 378273 | 482289 | -104016 | 533946 | -155672 |
| (8) Baffin_Bay_Gulf_of_St._Lawrence | 711715 | 555346 | 156369 | 545899 | 165816 |
| (9) Canadian_Archipelago | 853337 | 851902 | 1435 | 852539 | 798 |
| (10) Hudson_Bay | 426092 | 261863 | 164228 | 244531 | 181560 |
| (11) Central_Arctic | 3107467 | 3186378 | -78911 | 3163043 | -55576 |
Deficits in Chukchi, Greenland and Barents Seas are offset by surpluses in Kara Sea, Baffin and Hudson Bays.

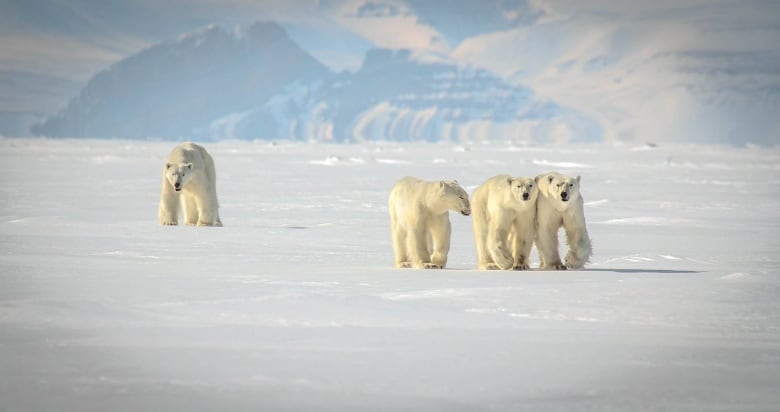
Meanwhile, in Nunavut, it is a great time to be a polar bear, even more of them than people want.
When Hell Freezes Over (Eagles Reunion Tour)


 Big Chill in last Two Weeks
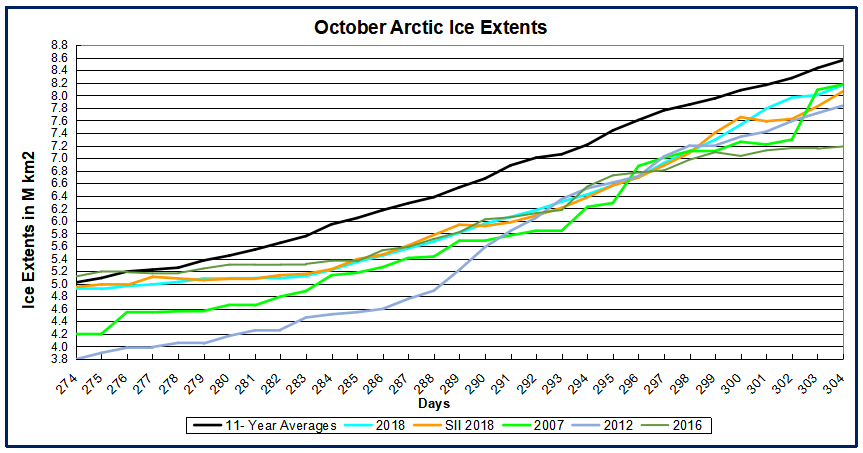

 Siberian Big Chill in last Ten days