Facets of Ice and Climate

gallopingcamel commented recently on Flap over Arctic Ice Rebound

“Short term variations to Arctic ice were not a big deal for me, but you piqued my interest so your blog has been added to my favorites.

To date, my interest has been the long term record based on ice cores:
https://diggingintheclay.wordpress.com/2013/05/04/the-dog-that-did-not-bark/

Do you have any comments to share?”

His linked post is a tightly reasoned analysis regarding CO2, temperatures and ice cores. I appreciate greatly his summary showing that present warming is much too low if CO2 has been causing warming all along. I’d not seen the contradiction put so succinctly.

His comment causes me to reflect on several facets of ice in relation to climate, and this is the point of this post.

The immediate facet: What do Sea Ice Extents tell us about climate change?

As Peter says, my blogging on Arctic Ice extents is quite immediate and is motivated mainly by my concern to get some factual perspectives out there as a possible antidote to feverish claims the media will promote. In that sense, this facet of ice is an immediate and socio-political one. The issue: should Arctic ice extent cause us to be alarmed about the climate? My blogs on Arctic Ice Rebound provide my conclusions, but this battle for public opinion has not yet been joined in earnest. In my post on sea ice factors I make the point that among many things affecting ice extents, CO2 is the least likely. And Antarctic ice extent is another story which I have left to others.

The Longer View: The Ice Core Story of CO2 and Surface Temperatures

I am convinced as Peter is that in the ice core record, changes in CO2 follow temperature changes and are more effect than cause. The natural CO2 sources and sinks are estimated with large error bands and their behavior is likely to be dynamic, that is, changing with changing climate conditions.

This blog is like a personal journal where I try to articulate realizations that form from my engagement in climate topics. It is idiosyncratic in that I often have a new discovery, quite exciting to me, but long understood by others unknown to me. For example, John Holtquist just linked to a webpage by John Daly where he said years ago most of everything I’ve learned about Arctic ice and more.

My journey this year was marked by discovering we live on planet water, not planet earth, and it led me to read much more oceanographic material which is categorized here as Oceans Make Climate. That led me to ice, and to some theories regarding longer-term Arctic cycles summarized here.

The Big Picture: The Sun and the Earth, From Hot House to Ice House

Peter’s post has a comment thread that gets into the larger arena of climate shifts involving ice-covered ages (most of earth’s history) and the more hospitable inter-glacial periods such as we have enjoyed for the last 11,500 years. I wrote a post on how I believe the ocean’s thermal flywheel is responsible for keeping our climate so stable most of the time, until it is overwhelmed by external forces, primarily astronomical in nature.

I have not wandered far into the sun-climate controversy, and my present understanding is probably best expressed here:
https://rclutz.wordpress.com/2015/09/16/the-climates-they-are-a-changing/

Arctic Ice September Final


Meltponds and leads in the Arctic ice cap show evidence of refreezing

The daily ice extent minimums are behind us, and now the story is how fast will be this year’s recovery of ice compared to other years.

First the daily situation at the end of September:

September 30 day 273 results from MASIE. 2015 has overcome 2/3 of 2014 ice extent lead.

Since the annual minimum on day 262, 2015 recovery rate was 60k m2 per day compared to 41k per day in 2014.

2015 ice extent now trails 2014 by 6.1%, which is about 337k km2 difference.

Extent in BCE region is building ice now at 81% of last year. Largest recent increases were in Laptev 43k, Kara 33k, Beaufort 15k, CAA 23k, and most importantly, the Central Arctic is now 220k above its minimum 29 days ago.

masie day 273


The graph shows that a gap opened when 2015 ice dropped at the time of an Arctic cyclone late August.  The differential of almost 1M km2 has now been cut to 337k km2. and closing. 2015 ice extent was lower than 5M km2 for only 28 days.

2015 Recap:

The 30 days of September 2015 are in the books, so we now have the melt season conclusion beyond the daily minimums.

Sept. results for recent years from MASIE Plots   h/t to Andres Valencia

https://nsidc.org/data/masie/masie_plots.html

For most of the season, 2015 Arctic sea ice extent was tracking 2014. In fact the July average extent was slightly higher than 2014. Then weather intervened in the last week of August. A large and strong cyclone centered over Chukchi Sea began breaking up ice in the BCE Region and affecting CAA (Canadian Archipelago) and the Central Arctic.  In addition, most of the summer the Arctic Oscillation (AO) was in negative phase, meaning fewer clouds, more direct insolation and ice melting.  More discussion of these two factors is at the end of this post.

The effects of this storm are seen in the rapid increase in water extent ( 482k km2 in one week) so that August 31 2015 had less ice than did 2014 at minimum September 19. Water extent continued to grow, and then stabilized once the storm abated and the AO went from negative to neutral.  Now the ice is growing beyond the daily minimum.

Comparing MASIE and NOAA Ice Extents.

Month 2015 2015 2015 2014 2014 2014
Ave. MASIE NOAA MASIE-NOAA MASIE NOAA MASIE-NOAA
Feb 15.032 14.498 0.534
March 15.170 14.758 0.413
April 13.650 13.954 -0.304 14.318 14.088 0.230
May 12.646 12.485 0.161 12.916 12.701 0.215
June 10.841 10.889 -0.049 11.324 11.033 0.292
July 8.713 8.411 0.302 8.482 8.108 0.374
August 5.961 5.658 0.303 6.353 6.078 0.275
Sept 4.677 4.595 0.082 5.364 5.220 0.144
Oct 7.697 7.232 0.464

The table shows July 2015 was above 2014 but late August weather caused a drop in monthly averages.  The August average shows ice extent dropped ~2.7M km2 from July, compared to a 2014 loss of ~2.0M. That difference persisted until the minimum was reached. NOAA typically reports a lower extent than MASIE, a difference that averaged ~300k km2.  Then in one week MASIE dropped while NOAA plateaued, and until recently NOAA September extents were quite close to MASIE, some days showing a higher number.

With the September daily ice starting out lower than 2014 the monthly average ended up smaller.  The SIPN median forecasts for September (dated July and August) were 4.8M km2 and NOAA came in a 4.6M.

In any case, I am not alarmed over open water in the Arctic. Steadily increasing and above average September ice extents signify the coming of the next ice age, a genuine threat to human life and prosperity.  Fortunately, that is not the indication this year.

Current and Recent Weather in the Arctic

In addition to the storm, the negative AO has been conducive to accelerating ice melting by increased insolation.

September 30 Arctic Oscillation Forecast from AER:

Currently, the AO is neutral but is predicted in the short term to trend positive and peak at moderate to strong positive values this weekend (Figure 2). The positive AO trend is reflective of the below normal geopotential heights dominating the Arctic basin while positive geopotential heights dominate the mid-latitudes, especially the North Atlantic sector.   The AO value for this past July and August was the second lowest observed since 1950.


“The positive trend in the AO and the setting sun may have brought an early end to the Arctic sea ice melt season but not before sea ice extent achieved its fourth lowest value since observations began.  It is likely that the extremely low AO values observed in July and August are reflective of atmospheric conditions (sunny and warm) that were conducive to rapid sea ice melt.”

https://www.aer.com/science-research/climate-weather/arctic-oscillation

The Alaska Dispatch News reported August 27 on the storm effects at Barrow, Alaska:

“The service has issued a coastal flood warning for Barrow until Friday morning, along with a high surf advisory for the western part of the North Slope and a gale warning for much of the Beaufort and Chukchi Seas. Seas up to 14 feet were forecast for Thursday in the Chukchi. . .Thursday’s high waves and flooding are products of a large storm that’s being felt as far as Southcentral Alaska, where high winds are forecast, Metzger said. “It’s a pretty big low-pressure system that’s over the Arctic Ocean,” he said. ”

https://www.adn.com/article/20150827/high-winds-causing-big-waves-flooding-barrow

a quarter million square KM of arctic ice in the CAB, adjacent to the Beaufort and Chukchi. 20150829

This storm is reminiscent of the 2012 event that resulted in the lowest ice, greatest water extent this century. The high winds, waves and swells have several effects: Gales push ice floes, opening water between them and pushing them toward warmer waters; Ice pieces are churned and fractured increasing the melt rate; Wave action can flood ice packs or can cause compacting, further reducing extent.

Flap Over Arctic Ice Rebound

Update October 4

Fooling Around

Dosbat has commented on my Arctic Ice posts: http://dosbat.blogspot.co.uk/2015/10/a-fool-by-any-other-name.html

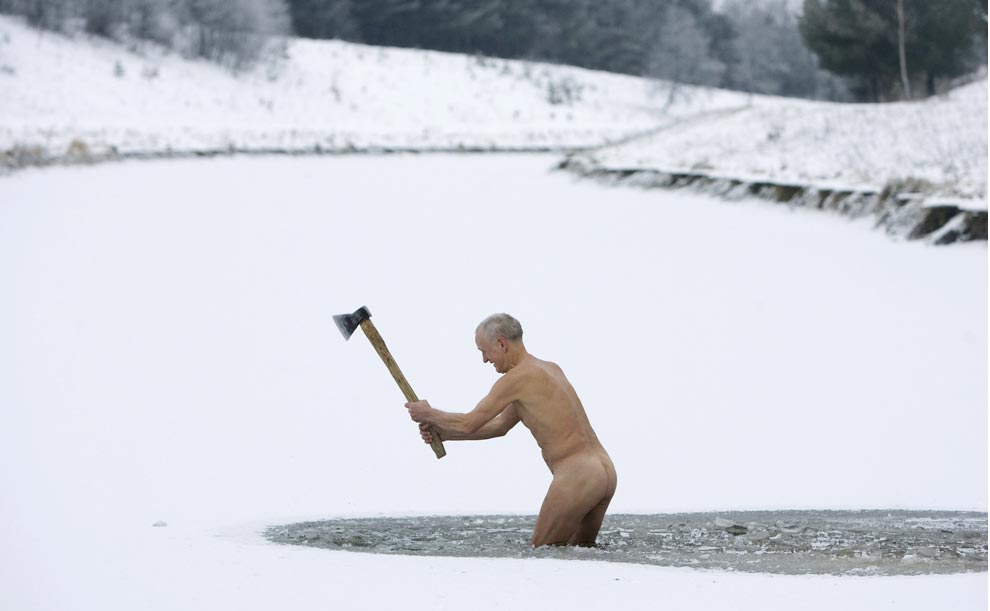
He sees clearly and correctly that I am “playing the fool.” That is, I am not taking the conventional view of Arctic Sea Ice. We call someone “foolish” for not saying and seeing things the same as the rest of us.

It’s a long, respected tradition. Monarchs valued highly their fools because they would speak to the king of things contrary to what everyone, including the king believed to be true. King Canute himself played the fool to show his court the truth. And it was an innocent child who broke the silence over a king’s nakedness.

It’s a risky business, because you could be right or wrong.  Who’s fooling whom?

More foolery coming soon.

And from the “Open Mind”

Tamino (Grant Foster) recently posted a hit piece against my Arctic Ice Rebound article.
https://tamino.wordpress.com/2015/09/28/epidemic-of-denial/

I went there, to the  “Open Mind”  blog to clarify some misunderstandings, but for my few comments I was ridiculed and insulted.  So I disengaged.

Some commentators thought I should be ashamed of my last name.  So let me introduce them to my extended family:

That’s right, we had a starring role in the Oscar-winning movie, The Grand Budapest Hotel.

Meet the Lutzes:


They take very seriously insults against the family name, and as the movie shows, they can be quite determined and extreme in their retaliations.  Just saying.

But Seriously, What is the Problem?

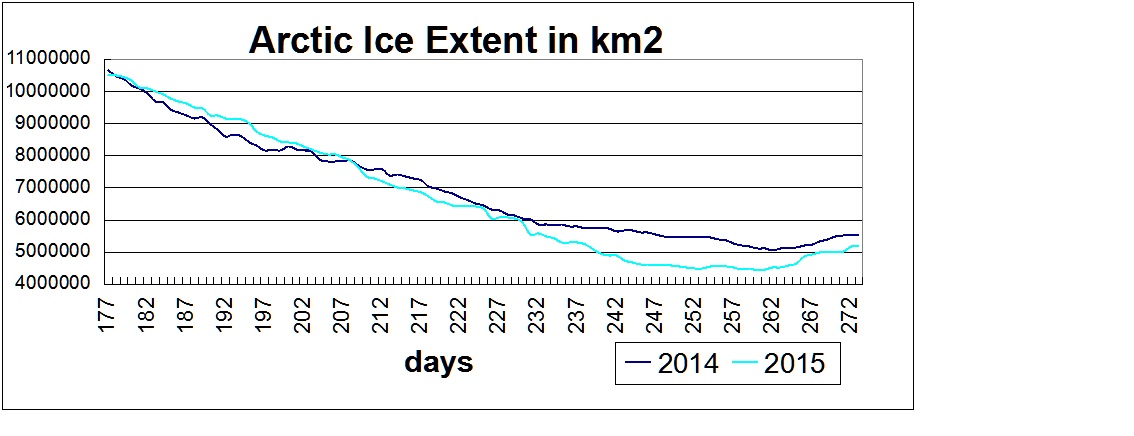
Grant Foster and friends are committed to a warmer future and expect Arctic Ice extent to decline.  They are unhappy with me pointing out the lack of decline recently. So my post is off-message, and they are attacking the messenger.  Same old, same old.

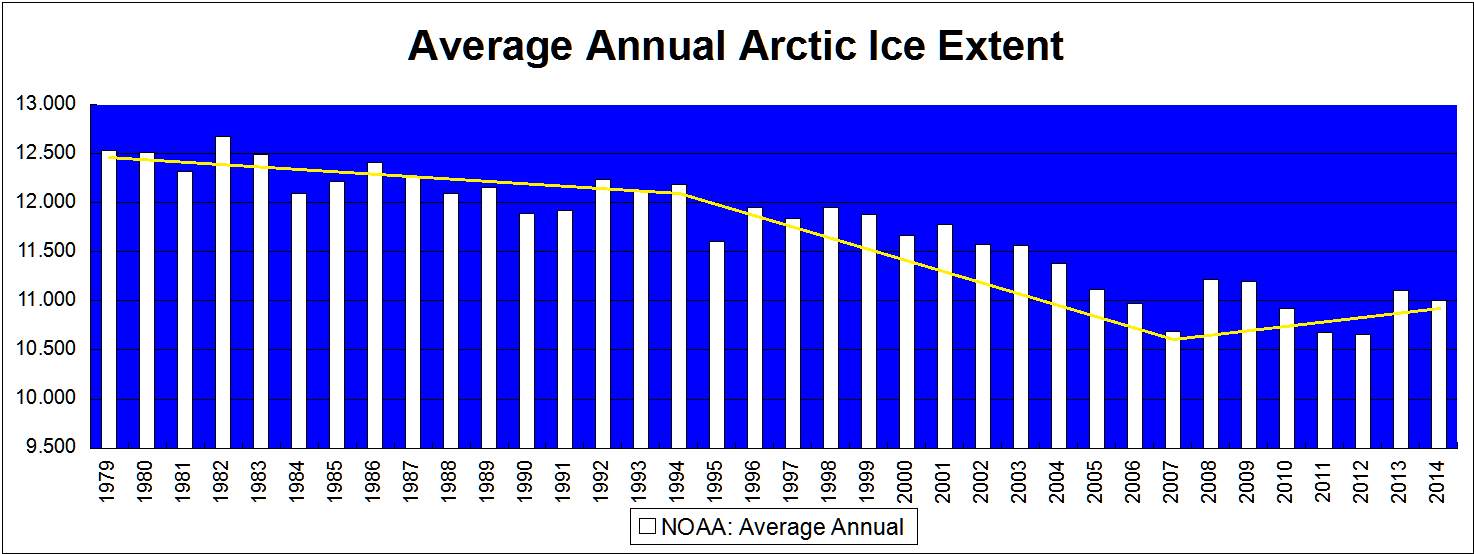
Foster was considerate to write a longish post against my work, and he included a number of graphs that confirm one of my main points: not much is happening with the Arctic ice cap, despite the seasonal fluctuations.  Tamino found an issue as an excuse to dismiss my entire analysis (and me and my blog along with it). I had included an annual average for 2015 which covers only the first 3/4 of this year.  I mentioned this figure would not be known for certain until year end.  Foster cleverly figured out that in the days (and weeks) ahead the figure will go down.  But come November and December it will rise again.  Not even Tamino knows what it will be until December 31.  It depends on the future rate of seasonal ice recovery.

My graph included only historical observations from MASIE, not projections or estimations.  The proper scientific thing would be to wait for the year to end.  But climate science, as we all know, is not only science, it is a movement and a media blitz ahead of a major (last ditch?) conference in Paris.  The story of Arctic ice will be written and sold to the public long before the year’s observations are complete.

Another Way to Get Perspective

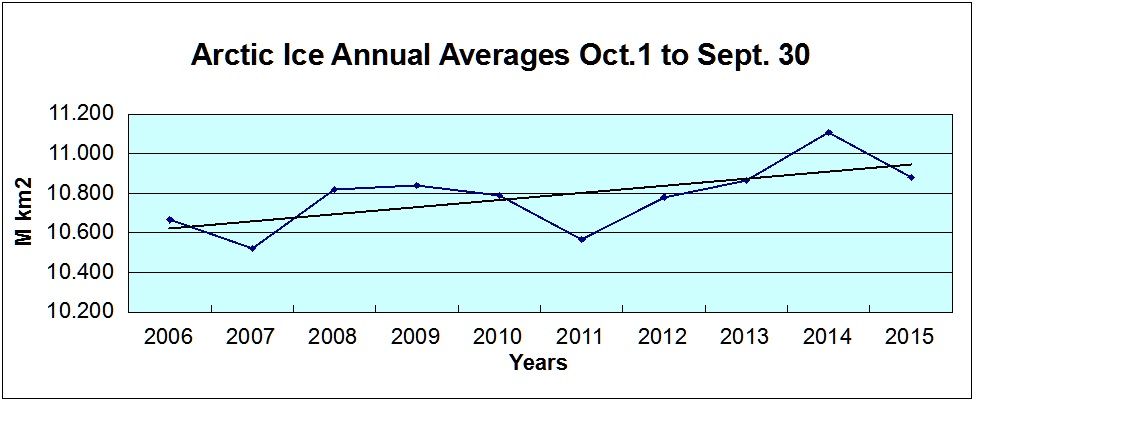
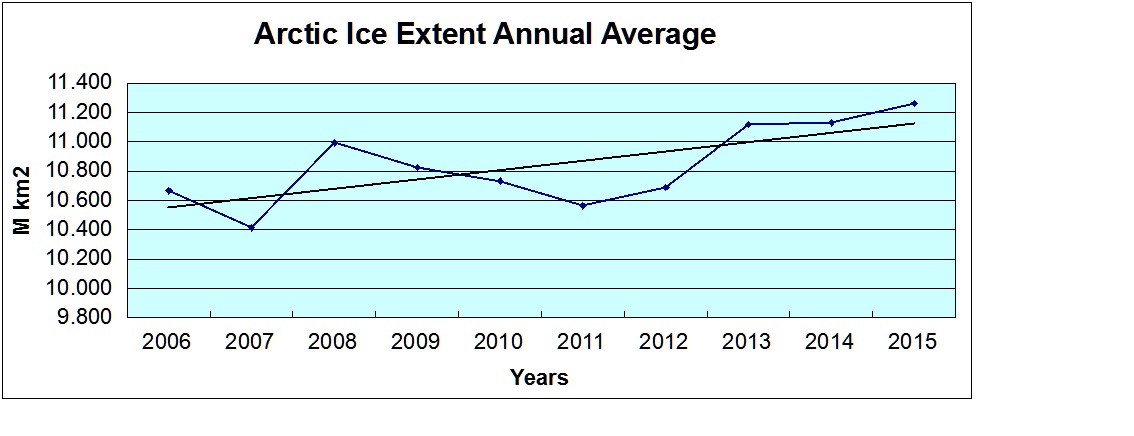
I prefer a calendar year frame for Arctic Ice not only for ease of understanding, but also because the break point in annual cycle is neutral, occurring mid-way between minimum and maximum.  In order to avoid using a provisional value, but still incorporate all the data, I have done an analysis taking 12 month averages from the end of September backwards; in effect combining the last quarter of the previous year with 3/4 of the current year, and so forth for preceding years.  For the first year, 2006, I present the average as reported; that is, rather than estimating the last quarter of 2005, I have included the actual 2006 data.

masie annuallarge273

The graph shows the annual averages Oct 1 through Sept. 30.  On this basis, the variability of ice extent is reduced, and  2014 has the highest extent, with 2015 in second place.  The decadal  trend is still an increasing one, though at a lower rate than when the calendar year is used.  The basic findings are the same.  This analysis substitutes the 2014 last quarter recovery rate for the actual  next 3 months yet to be observed.  Since the 2015 maximum was unusually low, the actual next quarter results may go higher.  We shall have to wait and see.

Note: I use the term “trend” in its dictionary definition: “the general direction of changes or developments” (Cambridge Dictionary).  In any time series, there is an overall trend or direction, and within are usually periods identifiable by change points where short-term trends deviate from the overall.  Evidence is mounting that 2007 may be such a change point.

Some say that trend can only be mentioned with the meaning of expected values, and the dataset is not long enough to say this surely. This is the same gambit made when surface temperatures stopped rising.  Whether it is the temperature or the ice plateau, the advice is the same: “You should ignore what is happening before your eyes because it is not real, statistically speaking, unless it continues for another decade or so.  Meanwhile let’s wrap up the emissions treaty.”

Summary

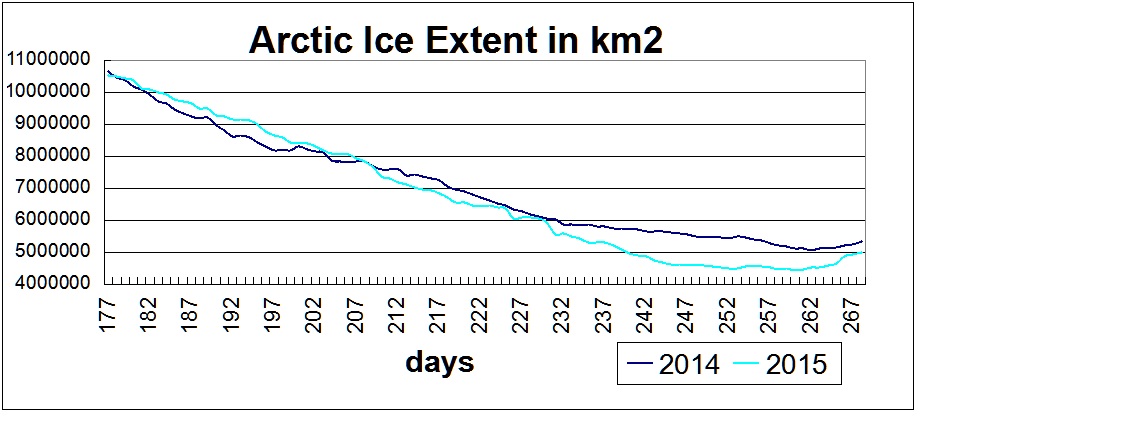
Those hoping for an Arctic ice collapse this year are disappointed.  Everything was in their favor: a low March maximum, the Blob melting out Bering Sea early, a negative AO (Arctic Oscillation) with higher insolation most of the summer, and a major cyclone last August when ice edges are most fragile. Despite all that working against the ice, the extent was lower than 5M km2 ( 2014 minimum) for a period of only 28 days. Furthermore, the 12 month averages show extent slightly rising over the last 10 years, with 2015 second only to 2014.

Note on datasets

MASIE is not the only dataset to show this lull in Arctic ice decline. It is also obvious in Foster’s final graph.  Some were upset that I used the MASIE data, despite NSIDC cautions against it.  For the record, the NSIDC Background cites as support a study by Partington et al (2003).  Reading that study, one finds that the authors preferred the MASIE data and said this:
“This analysis has been based on ice chart data rather than the more commonly analyzed passive microwave derived ice concentrations. Differences between the NIC ice chart sea ice record and the passive microwave sea ice record are highly significant despite the fact that the NIC charts are semi-dependent on the passive microwave data, and it is worth noting these differences. . .In summer, the difference between the two sources of data rises to a maximum of 23% peaking in early August, equivalent to ice coverage the size of Greenland.” (my bold)  For clarity: the ice chart data show higher extents than passive microwave data.

http://digitalcommons.unl.edu/cgi/viewcontent.cgi?article=1058&context=usdeptcommercepub

In any case, NSIDC’s last word was this:  “In June 2014, we decided to make the MASIE product available back to 2006. This was done in response to user requests, and because the IMS product output, upon which MASIE is based, appeared to be reasonably consistent.”  And thus, the data appeared this September.

Conclusion

Arctic ice extent is no longer declining and a slight increase was observed in the last decade.  People have a right to know about this as a context to evaluate claims that are coming.

Nothing alarming is happening to Arctic ice.

Arctic Ice Rebound

Update October 14, 2014 at the end of the post.

MASIE Proves Yearly Arctic Ice Recovering

You will be hearing a lot about 2015 having the fourth lowest minimum Arctic ice extent ever recorded.

Here is what they are not telling you:

masie annuallarge

MASIE has very helpfully provided their records for the last ten years.  Since stormy weather can affect both maximum and minimum ice extents, emphasis on March and September averages can be misleading. From a climate change perspective, a better metric is the average ice extent over the entire year. By that measure we gain a realistic perspective on the last ten years of Arctic ice fluctuation.

While Arctic ice varies a lot seasonally, the graph shows that it is not that variable annually during this decade. Fluctuating about +/- 4%, there was a slightly increasing trend, particularly in the last five years.  Here are the ice extents in M km2:

Year Annual  Average March Average Sept Average Sept Minimum March Max
2006 10.667 14.260 5.831 5.641 14.663
2007 10.414 14.543 4.298 3.987 14.907
2008 10.995 15.372 4.427 4.223 15.662
2009 10.825 15.005 5.091 4.871 15.326
2010 10.732 15.221 4.997 4.717 15.397
2011 10.564 14.832 4.511 4.303 15.110
2012 10.688 15.533 3.633 3.369 15.822
2013 11.119 15.230 5.083 4.677 15.505
2014 11.130 15.133 5.368 5.066 15.523
2015 11.263 14.625 4.564 4.442 14.910

The value for 2015 is for the record so far; the final number will be known at year end.  As for minimum extents, 2015 September average will likely be the fifth lowest in the last ten years, so ranked in the middle of the years in this period. For it to be the fourth lowest ever would require ignoring earlier history, especially the 1930’s and the age of the Vikings.

MASIE dataset is here:
https://nsidc.org/data/masie/

Background on MASIE and NOAA:
https://rclutz.wordpress.com/2015/03/30/everything-you-wanted-to-know-about-measuring-arctic-ice-but-were-afraid-to-ask/

And Arctic Ice is Rebounding As We Speak

Now let’s put this year’s minimum in perspective.  2014 daily ice extent minimum was ~5M km2 on day 262.  2015 extent went below 5M on day 240 and has now regained back to 5M on day 268.  So the reduced ice extent this year lasted for exactly 28 days.  Why is this fact not mentioned in articles talking about the 4th lowest extent recorded?  How can a 28-day event (produced by a major storm) be called “climate change” when it is so temporary and natural?

masie day 268

For the current 2015 ice watch report see:

https://rclutz.wordpress.com/2015/09/25/arctic-ice-recovery-race/

Update October 14, 2015

There was some criticism of this article following publication.  I addressed the issues in subsequent posts:

Flap Over Arctic Ice Rebound

Ice House of Mirrors

Arctic Ice Made Simple

Arctic Ice Recovery Race Sept. 26

Update September 26:  2015 ice extent goes over 5M km2.

The daily ice extent minimums are behind us, and now the story is how fast is this year’s recovery of ice compared to last year.

In the MASIE estimates, the daily minimums were quite close in time: 2014 day 262 and 2015 day 260. NOAA showed 2015 minimum extent on day 251 with gains sufficient for NOAA to nearly synchronize with MASIE extent by day 262.

From last year’s MASIE records we know that ice recovered in 2014 at a rate of 41k km2 per day to the end of September, for a total addition of ice extent of 451k km2. NOAA showed a comparable gain in 2014 ice over the same period: 39k daily for a total gain of 429k km2.

As of day 268, Sept. 25, ice extent is recovering much faster this year than last, about twice the rate, and MASIE is again showing higher extent than NOAA.

First the daily situation:

September 25 day 268 results from MASIE. 2015 is back over 5M km2. Both years gain back considerable ice. 

While 2014 gained 105k of ice, 2015 gained 64k recovering back up to 34% of the spring maximum..

2015 ice extent now trails 2014 by 6.4%, which is about 344k km2 difference.

Extent in BCE region is building ice now at 75% of last year, with Chukchi and East Siberian seas adding 47k. Most seas increased ice and most importantly, the Central Arctic is now 193k above its minimum 24 days ago.

masie day 268

The graph shows that a gap opened when 2015 ice dropped at the time of an Arctic cyclone late August.  The differential of almost 1M km2 has now been cut to 350k km2. and closing. 2015 ice extent was lower than 5M km2 for only 27 days.

2015 Recap:

The first 25 days of September 2015 are in the books, so with 5 days to go this is an outlook on the melt season conclusion beyond the daily minimums.

For most of the season, 2015 Arctic sea ice extent was tracking 2014. In fact the July average extent was slightly higher than 2014. Then weather intervened in the last week of August. A large and strong cyclone centered over Chukchi Sea began breaking up ice in the BCE Region and affecting CAA (Canadian Archipelago) and the Central Arctic.  In addition, most of the summer the Arctic Oscillation (AO) was in negative phase, meaning fewer clouds, more direct insolation and ice melting.  More discussion of these two factors is at the end of this post.

The effects of this storm are seen in the rapid increase in water extent ( 482k km2 in one week) so that August 31 2015 had less ice than did 2014 at minimum September 19. Water extent continued to grow, and then stabilized once the storm abated and the AO went from negative to neutral.  Now the ice is growing beyond the daily minimum.

Comparing MASIE and NOAA Ice Extents.

Month 2015 2015 2015 2014 2014 2014
Ave. MASIE NOAA MASIE-NOAA MASIE NOAA MASIE-NOAA
Feb 15.032 14.498 0.534
March 15.170 14.758 0.413
April 13.650 13.954 -0.304 14.318 14.088 0.230
May 12.646 12.485 0.161 12.916 12.701 0.215
June 10.841 10.889 -0.049 11.324 11.033 0.292
July 8.713 8.411 0.302 8.482 8.108 0.374
August 5.961 5.658 0.303 6.353 6.078 0.275
Sept 4.596 4.521 0.075 5.364 5.220 0.144
Oct 7.697 7.232 0.464

The table shows July 2015 was above 2014 but late August weather caused a drop in monthly averages.  The August average shows ice extent dropped ~2.7M km2 from July, compared to a 2014 loss of ~2.0M. That difference persisted until the minimum was reached. NOAA typically reports a lower extent than MASIE, a difference that averaged ~300k km2.  Then in one week MASIE dropped while NOAA plateaued, and until recently NOAA September extents were quite close to MASIE, some days showing a higher number.

With the September daily ice starting out lower than 2014 the monthly average will end up smaller.  The September first 25 days average is shown, a figure that should rise and end the month over 4.6M km2. It is now evident the minimum has occurred, and the recovery is under way.

In any case, I am not alarmed over open water in the Arctic. Steadily increasing and above average September ice extents signify the coming of the next ice age, a genuine threat to human life and prosperity.  Fortunately, that is not the indication this year.

Current and Recent Weather in the Arctic

In addition to the storm, the negative AO has been conducive to accelerating ice melting by increased insolation.

September 16 Arctic Oscillation Forecast from AER:

The AO, which has remained almost consistently in negative territory since late June, has resulted in near record low AO values for July and August. The AO is predicted to first trend positive through the weekend and pop into positive territory early next week. However by midweek the AO is predicted to return back into negative territory and remain negative through early October.

“The positive trend in the AO and the setting sun may have brought an early end to the Arctic sea ice melt season but not before sea ice extent achieved its fourth lowest value since observations began.  It is likely that the extremely low AO values observed in July and August are reflective of atmospheric conditions (sunny and warm) that were conducive to rapid sea ice melt.”

https://www.aer.com/science-research/climate-weather/arctic-oscillation

The Alaska Dispatch News reported August 27 on the storm effects at Barrow, Alaska:

“The service has issued a coastal flood warning for Barrow until Friday morning, along with a high surf advisory for the western part of the North Slope and a gale warning for much of the Beaufort and Chukchi Seas. Seas up to 14 feet were forecast for Thursday in the Chukchi. . .Thursday’s high waves and flooding are products of a large storm that’s being felt as far as Southcentral Alaska, where high winds are forecast, Metzger said. “It’s a pretty big low-pressure system that’s over the Arctic Ocean,” he said. ”

https://www.adn.com/article/20150827/high-winds-causing-big-waves-flooding-barrow

a quarter million square KM of arctic ice in the CAB, adjacent to the Beaufort and Chukchi. 20150829

This storm is reminiscent of the 2012 event that resulted in the lowest ice, greatest water extent this century. The high winds, waves and swells have several effects: Gales push ice floes, opening water between them and pushing them toward warmer waters; Ice pieces are churned and fractured increasing the melt rate; Wave action can flood ice packs or can cause compacting, further reducing extent.

Arctic Ice Minimums Compared

Update Sept. 20, 2015: 2014 and 2015 Minimums Established, 11 days ago in NOAA, 2 days ago in MASIE

In the annual match of the ocean vs. Arctic ice, Mother Nature has blown the whistle. Results are little confusing, since NOAA shows the lowest extent 11 days ago, and MASIE only 2 days ago. Moreover, MASIE dropped a lot of ice in the recent period and is now showing less ice than NOAA.  Usually, MASIE is higher by 2-300k km2.

Still, for the climate record it will be the September average that counts, and the platform is firmed up for that result.

First the daily situation:


September 19 day 262 results from MASIE. 2014 loses a lot while 2015 gains a lot of ice extent.

While 2014 lost 46k of ice, 2015 gained 70k recovering well above the previous annual daily ice minimum..

2015 ice extent now trails 2014 by 10.6%, which is about 538k km2 difference. Day 262 is the 2014 daily ice extent minimum. Day 260 was 2015 minimum, according to MASIE.

masie day 262

Comparing 2014 and 2015 at Annual Minimums

Ice Extents Day 2014262 Day 2015260 Ice Extent
Region Ann Min Ann Min km2 Diff.
 (0) Northern_Hemisphere 5066134 4442258 -623876
 (1) Beaufort_Sea 655536 484880 -170656
 (2) Chukchi_Sea 235122 187420 -47701
 (3) East_Siberian_Sea 455832 219274 -236559
 (4) Laptev_Sea 1212 44701 43489
 (5) Kara_Sea 64255 1778 -62478
 (6) Barents_Sea 132741 18 -132723
 (7) Greenland_Sea 210190 236707 26517
 (8) Baffin_Bay_Gulf_of_St._Lawrence 18245 57136 38891
 (9) Canadian_Archipelago 341623 228074 -113549
 (10) Hudson_Bay 862 47674 46811
 (11) Central_Arctic 2949375 2933456 -15919

The table shows the effects of weather in the western Arctic.  In August 2015 lost 700k km2 more than 2014, a differential that persisted to the minimum.  The reductions occurred in the BCE region and in the near by CAA (Canadian Archipelago).  In addition in the east, Barents melted out early and entirely, and nearby Kara become mostly open water.

Elsewhere, on the Canadian side, Hudson and Baffin Bay along with the Greenland Sea had more ice, and the Central Arctic was nearly the same as in 2014.

2015 Recap:

The first 19 days of September 2015 is in the books, so here is an outlook on the melt season conclusion beyond the daily minimums.

For most of the season, 2015 Arctic sea ice extent was tracking 2014. In fact the July average extent was slightly higher than 2014. Then weather intervened in the last week of August. A large and strong cyclone centered over Chukchi Sea began breaking up ice in the BCE Region and affecting CAA (Canadian Archipelago) and the Central Arctic.  In addition, most of the summer the Arctic Oscillation (AO) was in negative phase, meaning fewer clouds, more direct insolation and ice melting.  More discussion of these two factors is at the end of this post.

The effects of this storm are seen in the rapid increase in water extent ( 482k km2 in one week) so that August 31 2015 had less ice than did 2014 at minimum September 19. Water extent continued to grow, and then stabilized once the storm abated and the AO went from negative to neutral.  Now the ice is growing beyond the daily minimum.

Comparing MASIE and NOAA Ice Extents.

Month 2015 2015 2015 2014 2014 2014
Ave. MASIE NOAA MASIE-NOAA MASIE NOAA MASIE-NOAA
Feb 15.032 14.498 0.534
March 15.170 14.758 0.413
April 13.650 13.954 -0.304 14.318 14.088 0.230
May 12.646 12.485 0.161 12.916 12.701 0.215
June 10.841 10.889 -0.049 11.324 11.033 0.292
July 8.713 8.411 0.302 8.482 8.108 0.374
August 5.961 5.658 0.303 6.353 6.078 0.275
Sept 4.545 4.463 0.082 5.364 5.220 0.144
Oct 7.697 7.232 0.464

The table shows July 2015 was above 2014 but late August weather caused a drop in monthly averages.  The August average is now complete and shows ice extent dropped ~2.7M km2 from July, compared to a 2014 loss of ~2.0M. That difference has persisted up to today. NOAA typically reports a lower extent than MASIE, a difference that averaged ~300k km2.  Then in one week MASIE dropped while NOAA plateaued, and now NOAA September extents are quite close to MASIE, some days showing a higher number.

With the September daily ice starting out lower than 2014 the monthly average should end up much smaller.  The September first 19 days average is shown, a figure that should rise and end the month near 4.6M km2. This presumes the minimum has definitely occurred, and the recovery is in effect.

In any case, I am not alarmed over open water in the Arctic. Steadily increasing and above average September ice extents signify the coming of the next ice age, a genuine threat to human life and prosperity.  Fortunately, that is not the indication this year.

Current and Recent Weather in the Arctic

In addition to the storm, the negative AO has been conducive to accelerating ice melting by increased insolation.

September 16 Arctic Oscillation Forecast from AER:

The AO, which has remained almost consistently in negative territory since late June, has resulted in near record low AO values for July and August. The AO is predicted to first trend positive through the weekend and pop into positive territory early next week. However by midweek the AO is predicted to return back into negative territory and remain negative through early October.

“The positive trend in the AO and the setting sun may have brought an early end to the Arctic sea ice melt season but not before sea ice extent achieved its fourth lowest value since observations began.  It is likely that the extremely low AO values observed in July and August are reflective of atmospheric conditions (sunny and warm) that were conducive to rapid sea ice melt.”

https://www.aer.com/science-research/climate-weather/arctic-oscillation

The Alaska Dispatch News reported August 27 on the storm effects at Barrow, Alaska:

“The service has issued a coastal flood warning for Barrow until Friday morning, along with a high surf advisory for the western part of the North Slope and a gale warning for much of the Beaufort and Chukchi Seas. Seas up to 14 feet were forecast for Thursday in the Chukchi. . .Thursday’s high waves and flooding are products of a large storm that’s being felt as far as Southcentral Alaska, where high winds are forecast, Metzger said. “It’s a pretty big low-pressure system that’s over the Arctic Ocean,” he said. ”

https://www.adn.com/article/20150827/high-winds-causing-big-waves-flooding-barrow

a quarter million square KM of arctic ice in the CAB, adjacent to the Beaufort and Chukchi. 20150829

This storm is reminiscent of the 2012 event that resulted in the lowest ice, greatest water extent this century. The high winds, waves and swells have several effects: Gales push ice floes, opening water between them and pushing them toward warmer waters; Ice pieces are churned and fractured increasing the melt rate; Wave action can flood ice packs or can cause compacting, further reducing extent.

Seeing the Arctic Melt without Warmist Glasses

In my Arctic Ice Watch reports I have been tracking progress toward September minimum with graphs like these (data from MASIE):

masie day 230

Doing this after a 3-week break, I was struck by the chart looking a lot like the scoring summary of a tight basketball game, only upside down.

Then AndyG55 commented on my recent summary by linking to this chart from Ed Hoskins:

As the above diagram shows, the temperature balance was pretty close for 7000 years, until the cooling accelerated over the last 3000 years.

My light bulb was in seeing that the summer melt is actually the enormous effort by the ocean to recover water trapped as sea ice in the Arctic. The ice extent varies greatly over the centuries and we know from artifacts that it has been both greater and smaller than presently.  In this time of global warming alarmism, some of us watching the melt season find ourselves hoping for the ice to gain extent, simply to take away that basis for claiming the end is nigh.

Let’s be clear. In this contest between the ice and ocean, we humans should be rooting for the ocean, and so would plants and animals if they knew what was going on. None of us want another ice age, so it is a good thing that the ocean has been gaining on the sea ice extent in the last 150 years.

Once again warmists have got it backwards. The Arctic is a canary all right: The more ice there is in September, the closer we are to the next ice age. Open water in the Arctic is a good thing for the ocean and for the planet.

So taking off the warmist glasses, we should be cheering as the water extent grows and the ice retreats. We don’t wish for a record low because that would drive the alarmists into a frenzy.  Anything around 5M km2 for September would signify nothing unusual is happening, so scary things must be found elsewhere.

Maybe the chart should look like this to emphasize the positives of more water, less ice.

Arctic Water Recovery day 230

Conclusion:
I am not so naive to think that this perspective has much chance against the warmist PR juggernaut. Already the lessening of Antarctic sea ice this year is trumpeted as proof of CO2 warming, and not a celebration of fresh water added to the ocean.

The largest ice cap in the Eurasian Arctic – Austfonna in Svalbard – is 150 miles long with a thousand waterfalls in the summer.

But as Erasmus (1466-1536) said:
In the kingdom of the blind, the one-eyed man is king.

And this one also applies:

Men, it has been well said, think in herds; it will be seen that they go mad in herds, while they only recover their senses slowly, and one by one.
Charles Mackay. Extraordinary Popular Delusions and the Madness of Crowds (1841)

Iceland vs. Greenland, and all that

Why is it that Greenland is mostly ice and Iceland is mostly green?

Many explanations have been offered, usually along the lines of deception: Iceland was so called to discourage others from emigrating, and OTOH Greenland was named to attract others to resettle from Iceland. It seems that after a Viking internal power struggle, the loser and his followers could be banished to leave on a ship to find another land, or die at sea. Thus did Leif Ericsson venture from Iceland to Greenland to found a colony, and later to reach Vinland in today’s Newfoundland.

OLYMPUS DIGITAL CAMERA

Leif Ericsson memorial in front of Reykjavik cathedral.

But it may not be deception at all. When you are off the southeastern coast of Iceland, where the Vikings probably approached, and the sun breaks through for a time, you may be treated to this sight:

Iceland Glacier

Iceland Glacier August 5, 2015 sailing southeast of Iceland.

It happens that the Icelandic glacier sits prominently there, and so, it is land alright, but covered with ice. Of course, later on, they discovered the much more liveable western and southern parts and settled there, but maybe the original name stuck.

Meanwhile in Greenland, I was looking for the icecap and was told by our Inuit guide at Paamiut that you have to sail far up the right fjords to see the ice. Even though 90% of Greenland is ice-covered, that is not what you see from the shore.

Near Nuuk Greenland August 31, 2015

Near Nuuk Greenland August 31, 2015

Brought to you by:

OLYMPUS DIGITAL CAMERA

Follow the Water–Arctic Ocean Flywheels

The motto of oceanography should be: “It’s not that simple.”

Dallas Murphy wrote that in a book containing his reflections from numerous voyages with ocean scientists, entitled Follow the Water: Exploring the Sea to Discover Climate. The author goes on to say:

“One reason why the ocean has been left out of the climate-change discussion is that its internal mechanisms and its interactions with the atmosphere are stunningly complex. That the ocean has been left out has helped pitch the discussion toward unproductive, distracting extremes–either global warming is bunk or sea levels are about to rise twenty feet–and to frame the issue as a matter of opinion, like the place of prayer in public schools.”

He also quotes respected Oceanographer Carl Wunsch: “One of the reasons oceanography has a flavor all it’s own lies in the brute difficulty of observing the Ocean.”

A previous post on the Climate Water Wheel referred to the metaphor of the ocean serving as a thermal flywheel in our planetary climate due to the massive storage of solar energy in bodies of water.  Another post provided some basics on the dynamics of sea ice.

Now, in keeping with the motto above, we shall see that indeed, it is not that simple when we look more closely inside the Arctic Ocean. For example, consider this map from Woods Hole Oceanographic Institution (WHOI):

“Follow the water: Cold, relatively fresh water from the Pacific Ocean enters the Arctic Ocean through the Bering Strait. It is swept into the Beaufort Gyre and exits into the North Atlantic Ocean through three gateways (Fram, Davis, and Hudson Straits). Warmer, denser waters from the Atlantic penetrate the Arctic Ocean beneath colder water layers, which lie atop the warmer waters and act as a barrier preventing them from melting sea ice.

Once in the Arctic Ocean basin, the water is swept into a mammoth circular current—driven by strong winds—called the Beaufort Gyre (BG). Mighty Siberian and Canadian rivers also drain into the gyre to create a great reservoir of relatively fresh water. Winds trap this water in a clockwise flow, but periodically, the winds shift and the gyre weakens, allowing large volumes of fresh water to leak out. This is “the flywheel,” said WHOI physical oceanographer Andrey Proshutinksy, and when it turns off, fresh water flows toward the North Atlantic.

The water exits the Arctic Ocean via several “gateways.” It can flow through the Fram Strait, between northeast Greenland and Svalbard Island, and then branch around either side of Iceland. It can flow around the west side of Greenland through Baffin Bay and out Davis Strait. It may also flow through a maze of Canadian islands and out Hudson Strait.
These gateways are two-way: They also let in the warmer Atlantic waters that—if not for the halocline—could melt Arctic sea ice.”

http://www.whoi.edu/oceanus/feature/is-global-warming-changing-the-arctic

The BG Flywheel System

The research indicates that the complexity can be imagined as a series of flywheels, interacting and combining to moderate the short term effects of weather and changes in circulations of water and winds. Note that this conception shows the ocean flywheel as having four components or layers that operate in their own patterns while being interconnected.

And, as the flywheel system depicts, the ocean components are stratified by both temperature and salinity (saltiness). When sea ice forms, it releases salt into surface waters. These waters become denser and sink to form the Arctic halocline, a layer of cold water that acts as barrier between sea ice and deeper warmer water that could melt the ice. (Illustration by Jayne Doucette, WHOI)

More from WHOI:

Summarizing several hypotheses introduced recently in the publications mentioned above we conclude that the oceanic BG is a major part of the Arctic climate system and is responsible for:

a) Stabilization of the anticyclonic circulation of sea ice and upper ocean layers
b) Accumulation and release of liquid fresh water and sea ice from the BG
c) Ventilation of the ocean in coastal polynyas and openings along shelf-break
d) Regulation of the circulation and fractional redistribution of the summer and winter Pacific waters in the Arctic Ocean
e) Regulation of pathways of the freshwater from the Arctic to the North Atlantic

The sea ice flywheel is an intermediate link between the atmosphere and ocean. Also, sea ice is a product of the atmosphere and ocean interactions. It transfers momentum from the atmosphere to the ocean modifying it depending on sea ice concentration, thickness and its surface and bottom roughness and regulates heat and mass exchange between the atmosphere and ocean. Sea ice flywheel of the system is responsible for:

a) Regulation of momentum and heat transfer between the atmosphere and ocean
b) Accumulation and release of fresh water or salt during melting-freezing cycle
c) Redistribution of fresh water sources through involvement of the first year ice from the marginal seas into the BG circulation and keeping it there for years and transforming it into highly ridged and thick multi-year ice under converging conditions of the BG ice motion.
d) Memorizing of the previous years conditions and slowing down variations in order to avoid abrupt changes
e) Protection of ocean from overcooling or overheating (the latter is extremely important for polar biology)

http://www.whoi.edu/page.do?pid=66596

Conclusion:

Our planet’s climate has changed so little over thousands of years that alarms have been sounded over less than 1 degree celsius of estimated average warming since the Little Ice Age ended 150 years ago. But actually, our Modern Warming period was preceded by the Medieval Warm period, the Roman, and the Minoan Warm periods. Each of them was slightly cooler than the previous, and all of them warmer than now.

If you are looking for explanations why our moderate climate persists over millennia and varies only within a tight range of temperatures, give a thought to the role of the Arctic flywheel system.

Postscript:

Of course, even this is far from the whole story. As the map above shows, there’s lots more than the Beaufort Gyre going on. For example, the Transpolar Current drives flows of ice and water on the European side, in addition to the Beaufort Gyre acting on the North American side.

And despite the emphasis above on the Pacific water, the Atlantic Gulf stream supplies most of the water entering the Arctic.

“The Arctic Ocean is permanently supplied with new water from the Gulf Current, which enters the sea close at the surface near Spitsbergen. This current is called the West Spitsbergen current. The arriving water is relatively warm (6 to 8°C) and salty (35.1 to 35.3%) and has a mean speed of ca. 30 cm/sec-1. The warm Atlantic water represents almost 90% of all water masses the Arctic receives. The other ~10% comes via the Bering Strait or rivers. Due to the fact that the warm Atlantic water reaches usually the edge of the Arctic Ocean at Spitsbergen in open water, the cooling process starts well before entering the Polar Sea.”

Arctic Sea Ice Uncertainties

The largest ice cap in the Eurasian Arctic – Austfonna in Svalbard – is 150 miles long with a thousand waterfalls in the summer.

About NOAA and MASIE Ice Extent Statistics

As we approach the serious Arctic melting season toward the September minimum, it is important to have a context to interpret various upcoming media reports.

Two factors are paramount: 1) The Sea Ice Prediction Network (SIPN) uses the September Monthly Average as reported by NOAA; and 2) This year NOAA adjusted its measurement system, resulting in a difference in extent statistics.

NOAA says this:

March 2015
The Sea Ice Index processing was updated to use the smaller SSMIS pole hole instead of the SMM/I pole hole, and the erroneous use of the SMMR pole hole in SSM/I and SSMIS data was also corrected. In addition, a new residual weather climatology mask was applied to the Northern Hemisphere that better represents where ice will and will not be, and the extent values in the daily extent data files have been rounded to three decimal places instead of six because that is the precision of the data. The entire time series was reprocessed and now reflects these changes.

http://nsidc.org/data/docs/noaa/g02135_seaice_index/#mar-2015

As many are aware, NOAA numbers come entirely from passive microwave sensors on satellites, while MASIE ice charts are prepared by the National Ice Center based on multiple sources, including the microwave results, but also satellite imagery and field reports. More of the difference in methodologies and historical results is described here:
https://rclutz.wordpress.com/2015/03/31/comparing-noaa-and-masie-arctic-ice-extent/

Something Different This Year

At the moment we are seeing that NOAA is now reporting ice extent figures that are much closer to MASIE than previously. The following table shows the comparison.

Monthly 2015 2015 2015 2014 2014 2014
Averages MASIE NOAA MASIE-NOAA MASIE NOAA MASIE-NOAA
February 15.032 14.498 0.534
March 15.170 14.758 0.413
April 13.650 13.954 -0.304 14.318 14.088 0.230
May 12.646 12.485 0.161 12.916 12.701 0.215
June 10.841 10.889 -0.049 11.324 11.033 0.292
July 9.573 9.473 0.100 8.482 8.108 0.374
August 6.353 6.078 0.275
September 5.364 5.220 0.144
October 7.697 7.232 0.464

All figures are in M km2. MASIE results stopped last year after October and did not resume until April 2015. The July 2015 average includes only the first 12 days, so it can not be compared to July 2014 30-day average.

Note that last year MASIE showed higher extents in all months, ranging higher by 200-500k km2, except for the September minimum. However, in 2015 NOAA changes show results much closer to MASIE, at times even larger extents. June was almost the same, something that didn’t happen in the past.

Summary

In some charts showing Arctic daily ice extent from several years, NOAA 2015 results exceed 2014 partly because of an adjusted system. The newer numbers are more in synch with MASIE results.

So far 2015 monthly averages are running slightly below last year when comparing MASIE to itself, or NOAA to itself. And SIPN median prediction is for a slightly lower minimum.

However, in the last 2 weeks 2015 is showing higher extent than the same period last year, presently an increase of ~ 500k km2.  Will that trend continue?

What will NOAA show in September? In addition to natural uncertainty, some differences may arise from system changes. At least this time, the adjustments are not in an alarming direction.

NOAA data is here:

ftp://sidads.colorado.edu/DATASETS/NOAA/G02135/north/daily/data/

MASIE Update July 13, 2015

2015 retains 2% lead over 2014 in BCE Region

Some Arctic ice watchers are focused on the BCE region: Beaufort, Chukchi and East Siberian Seas. It seems that when multi-year ice collects in this region, the Arctic Sea ice margin is protected, and the melting is reduced, resulting in a higher September minimum. Thus an early melting in BCE region can signal a lower summer minimum for NH ice extent, and vice-versa.

To monitor this, I have added a BCE index, being the total 2015 ice extent in BCE as a % of total 2014 extent in the same region. All figures from MASIE.

Note that the BCE maximum ice extent is comparable in size to Arctic Sea max. Historically BCE melts much more than the Arctic Sea; for example, in 2014 BCE lost 58% of its max compared to only 10% for Arctic Sea.

BCE Index recent results:

Day BCE 2015 % of 2014
187 2597170 100.2%
188 2594289 99.8%
189 2593287 99.2%
190 2538316 99.1%
191 2540197 100.6%
192 2534781 102.8%
193 2529403 102.6%

Part of the interest in BCE this year comes from the warm water blob in the N. Pacific, that may add melting to this region located on the Asian side. The two years were virtually identical with little melting prior to day 130. Daily losses since then have been similar and the 2 years were tied on day 146. For 3 days 2015 took some losses while 2014 held on to gains. Since day 150 the gap has been ~3-4%, until recently.

The Blob may have melted out Bering Sea early, and that may now be causing Chukchi to have lower extent than last year.  Yet the BCE region had more ice than 2014 for 13 days until slipping behind for 3 days, then recovering to again lead by 2%.

For more on the Blob:  https://rclutz.wordpress.com/2015/06/13/how-about-that-blob-june-13-update/

July 13, 2015

Day 193, July 12 results from MASIE. Arctic ice extent lead over 2014 dips to 471k km2: A day when 2014 regains ice while 2015 has a small loss. .

2014 gained 58k on this day while 2015 lost 21k, reaching a new seasonal minimum of 9.13M km2. The loss is now 37.2% from NH max on day 93.

2014 extent now trails 2015 by 5.4%, which is about 471k km2 difference.

2015 losses were spread, the largest being 10k in Chukchi.

The seas that have lost ice are: (% lost from each sea’s max)

Baltic 100%
Bering 100%
Okhotsk 99.2%
Barents 87.8%
Baffin Bay 73.7%
Kara 71.1%
Hudson Bay 49.6%
Chukchi 39.2%
Greenland 27.8%
Laptev 19.2%
Beaufort 13.3%
Can Archipelago 12.4%
East Siberian 6.7%

The other seas have lost less than 5% from their maximums.

The seas contributing most to the total NH ice extent loss:

(5) Kara_Sea 12.0%
(6) Barents_Sea 9.6%
(8) Baffin_Bay_Gulf_of_St._L 23.4%
(10) Hudson_Bay 11.3%
(12) Bering_Sea 12.2%
(14) Sea_of_Okhotsk 11.4%

2015 melt still trails 2014 by 5 days.

masie day 193

Outlook:

At this point, the median outlook for NH ice extent average for September 2015 is about 5M km2, slightly below last year. That seems reasonable to me, given the lower March max, but also considering the higher ice thickness. Of course, there is no predicting what weather events will affect the ice melting and compacting between now and October.

What’s at stake this year? If September average is higher than last year, then it supports the recovery narrative. Slightly lower than 2014 (the consensus prediction) and the generally declining trend is supported. A major fall off in ice extent would be followed by mass media alarm bells.