Comparing NOAA to MASIE Arctic Ice Extent 

Some might be interested to compare MASIE results with NOAA Sea Ice Index, since NOAA is a typical reference for Arctic Ice news. NOAA uses only passive microwave readings, while MASIE includes other sources, such as satellite images and field observations.

For comparison, MASIE shows about 700,000 Km2 more ice extent than NOAA both at maximum and minimum. This is usually explained by microwave sensors seeing melt water on top of ice the same as open water.

For the years 2007 to 2014 inclusive, each year MASIE shows higher maximums than NOAA, on average 5% higher. In each of those same years MASIE shows higher minimums than NOAA, on average 15% higher. The melt extent is more comparable: NOAA shows an average annual loss of 70.5 %, while MASIE shows an average loss of 67.5%.

NIC Ice Charts


Climatologists say the NIC estimates are “conservative.” By this they mean NIC’s priority is shipping safety, and so, when in doubt, under mixed ice and water conditions, ice charts show ice. NIC people do not make predictions about sea ice, they only report what is there, according to their multiple sources.

On the other hand, principals at both NASA and NOAA have said on the record that the Arctic will soon be ice-free, and it will be the fault of CO2. Could it be when in doubt, under mixed conditions, they report water in places where NIC shows ice? That would explain the discrepancies in estimates of ice extent

Note: NOAA has bureaucratic authority over NIC and advises against using NIC records for climate analysis. Last year, NIC results became available only on a rolling 30-day basis, so that estimates older than the current period are no longer available. Noticing this policy change, I began building a spreadsheet to capture the history for my own analysis. Since mid November, 2014, NIC ice extent reports have been unavailable at the MASIE webpage.

Update on April 2: NSIDC now says MASIE will be back after April.

Update November  2015: MASIE dataset is now available from January 1, 2006 to the present.


Everything You Wanted to Know about Measuring Arctic Ice (But Were Afraid to Ask)

There are several research centers that monitor Arctic ice extent, especially NSIDC (USA), DMI (Denmark), JAXA (Japan), and NANSEN (Norway). All start with the same data from passive microwave sensors on NASA satellites. Slight differences arise from different algorithms used to process the inputs into ice extent estimates.

Operational ice charts are an alternative measure of Arctic sea ice extent. These are prepared daily by Canada, Russia and US maritime authorities to assist ships navigating in Arctic waters. For example, the US National Ice Center (NIC) provides an index called MASIE (Multisensor Analyzed Sea Ice Extent). NIC charts are based upon not only passive microwave numbers, but also satellite imagery and reports from planes and ships operating in the regions. Operational ice charts are the most detailed pre-satellite records, with the Russian archives being the oldest.

What’s the Issue?

On another blog, a climate person put it to me this way:

“Based on what I’ve read if I had no other source, or were heading out in a boat, I would most certainly use the operational indices such as NIC. For climate change trends, I’d go with NSIDC, JAXA … Do you know of any climate scientists that prefer NIC?”

Measuring anything in the Arctic is problematic due to the conditions. And any technology has limitations and uncertainties. Thus it is useful to have more than one estimate of ice extent. Comparisons of the two types of data show the passive microwave results underestimate ice extent, especially during the late summer minimum. The difficulty is mistaking surface melt water for open water, failing to discern the ice underneath.

“Passive microwave sensors from the U.S. Defense Meteorological Satellite Program have long provided a key source of information on Arctic-wide sea ice conditions, but suffer from some known deficiencies, notably a tendency to underestimate ice concentrations in summer. With the recent release of digital and quality controlled ice charts extending back to 1972 from the U.S. National Ice Center (NIC), there is now an alternative record of late twentieth century Northern Hemisphere sea ice conditions to compare with the valuable, but imperfect, passive microwave sea ice record.”

“This analysis has been based on ice chart data rather than the more commonly analyzed passive microwave derived ice concentrations. Differences between the NIC ice chart sea ice record and the passive microwave sea ice record are highly significant despite the fact that the NIC charts are semi-dependent on the passive microwave data, and it is worth noting these differences. We compare the ice chart data to ice concentrations from the NASA Team algorithm which, along with the Bootstrap algorithm [Comiso, 1995], has proved to be perhaps the most popular used for generating ice concentrations [Cavalieri et al.,1997]. We find a baseline difference in integrated ice concentration coverage north of 45N of 3.85% ± 0.73% during November to May (ice chart concentrations are larger). In summer, the difference between the two sources of data rises to a maximum of 23% peaking in early August, equivalent to ice coverage the size of Greenland.“ ( My Bold) Source: Late twentieth century Northern Hemisphere sea-ice record from U.S. National Ice Center ice charts. 

The differences are even greater for Canadian regions.

“More than 1380 regional Canadian weekly sea-ice charts for four Canadian regions and 839 hemispheric U.S. weekly sea-ice charts from 1979 to 1996 are compared with passive microwave sea-ice concentration estimates using the National Aeronautics and Space Administration (NASA) Team algorithm. Compared with the Canadian regional ice charts, the NASA Team algorithm underestimates the total ice-covered area by 20.4% to 33.5% during ice melt in the summer and by 7.6% to 43.5% during ice growth in the late fall.”

From: The Use of Operational Ice Charts for Evaluating Passive Microwave Ice Concentration Data, Agnew and Howell

Or, if you don’t like what the US or Canada puts in their ice charts, you can get a third, independent perspective from Russia. The AARI has been studying and mapping the polar regions for a very long time, currently one of them chairs the ETSI and they maintain a global sea ice database (the other one is at NSIDC). Their ice charts can be accessed here.

A warning note: The Russians are not alarmed by what they see in the Arctic.

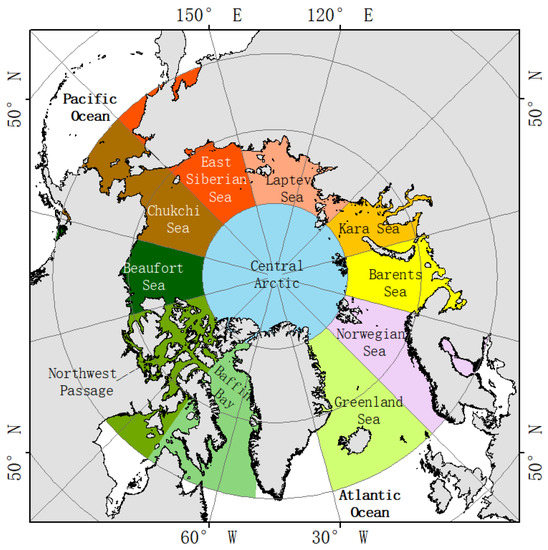
“In winter, the newly formed ice actively grows up to a 1.2 meter thick layer, while the coastal ice grows up to 2.0 meters. Consequently, the Arctic sea ice layer does not change significantly. Moreover, according to Genrikh Alekseev, in the summer, ice melts in various seas unequally. This year, the seas through which the Northern Shipping Route passes are covered with an unusually thicker ice layer. The Barents Sea is covered by a thin ice layer, but the amount of ice in the Kara, Laptev, East-Siberian and Chukotskiy seas exceeds the level of 2007. The conditions in the Arctic in the warm summer can be considered abnormal, but the Northern Shipping Route has not been completely freed from ice yet. This means icebreakers will be needed in the future, says the scientist.”

The extreme melting of ice in the summer 2012 is most likely the last gesture that the warming is ending. In fact, ice is a product of climate, and when comparing the graphs of the air temperature and melting ice, one can see that they coincide, Genrikh Alekseev said.

Conclusion:

Operational ice charts are more variable due to human error in their production.

Climatologists prefer passive microwave indices of ice extent because they are consistently wrong.

One wonders about their preference if satellites were overestimating ice. For myself I am glad for two mostly independent measures, one done by people who only want to get it right that day.

Note: As of March 2015, NSIDC has been showing MASIE off-line since mid November 2014. They say NIC results will be back in April.

Update on April 2: NSIDC now says MASIE will be back after April.

Arctic Sea Ice Factors

An early-spring sunset over the icy Chukchi Sea near Barrow (Utqiaġvik), Alaska, documented during the OASIS field project (Ocean_Atmosphere_Sea Ice_Snowpack) on March 22, 2009. Image credit: UCAR, photo by Carlye Calvin.

Alarmists are always claiming the Arctic Sea Ice is the “canary in the coal mine.” Wrong. Arctic ice extent varies a lot for a lot of reasons. Predictions of its disappearing because of rising CO2 are another attempt to use a natural process as proof that global warming is dangerous and linked to fossil fuel emissions.

The Long View of NH Sea Ice

First some historical context for how NH ice extent varies over decades and centuries.

Figure 16-3: Time series of April sea-ice extent in Nordic Sea (1864-1998) given by 2-year running mean and second-order polynomial curves. Top: Nordic Sea; middle: eastern area; bottom: western area (after Vinje, 2000). IPCC Third Assessment Report

“The extent of ice in the Nordic Seas measured in April has been subject to a reduction of ~33% over the past 135 yr. Nearly half of this reduction is observed over the period ~1860–1900, prior to the warming of the Arctic. Decadal variations with an average period of 12–14 yr are observed for the whole period. The observation series indicates that less than 3% of the variance with respect to time can be explained for a series shorter than 30 yr, less than 18% for a series shorter than 90 yr, and less than 42% for the whole 135-yr long series. While the mean annual reduction of the April ice extent is decelerating by a factor of 3 between 1880 and 1980, the mean annual reduction of the August ice extent is proceeding linearly.”

“The August ice extent in the Eastern area has been more than halved over the past 80 yr. A similar meltback has not been observed since the temperature optimum during the eighteenth century. This retrospective comparison indicates accordingly that the recent reduction of the ice extent in the Eastern area is still within the variation range observed over the past 300 yr.”

Anomalies and Trends of Sea-Ice Extent and Atmospheric Circulation in the Nordic Seas during the Period 1864–1998 by TORGNY VINJE, Norwegian Polar Institute, Oslo, Norway

http://journals.ametsoc.org/doi/pdf/10.1175/1520-0442(2001)014%3C0255%3AAATOSI%3E2.0.CO%3B2

Multiple Factors Affecting Sea Ice Extent

The references below, among many others, show that the factors causing Arctic Ice to lessen, when that was happening, have nothing to do with air temperatures which is the only way CO2 could have an effect (theoretically). The melting is much more the result of water circulations, especially when warm Atlantic water from the south is able, or not, to get into the Arctic Ocean.

“Regional Arctic sea ice variations result from atmospheric circulation changes and in particular from ENSO and North Atlantic Oscillation (NAO) events. Patterns of Arctic surface air temperature changes and trends are consistent with regional changes in sea ice extent. A dominant mode of Arctic variability is the Arctic Oscillation (AO), and its strong positive phase during the 1990s may account for much of the recent decrease in Arctic ice extent. The AO explains more than half of the surface air temperature trends over much of the Arctic.”
http://onlinelibrary.wiley.com/enhanced/doi/10.1029/2003GL018031/

“The variation in the ice extent caused by a 1C change in the ocean temperature since 1860 compares with about 90% of the concurrent total ice extent variation observed in the eastern area. The net effect of atmospheric temperatures seems accordingly to be relatively small over the same period of time. This concurs with the large difference in the individual heat capacity.”

http://journals.ametsoc.org/doi/pdf/10.1175/1520-0442(2001)014%3C0255%3AAATOSI%3E2.0.CO%3B2

“So why does circulation matter? Two reasons. First off, you can see warm water entering on the Pacific and Atlantic connections and cold water leaving via Canada and Greenland / Fram Strait. During a Glacial, that circulation stops. With a mile of ice over Canada, that exit is closed. With ocean levels 100 meters lower, folks can walk from Russia to Alaska. (Well, they do it sometimes now over the ice, but it will be easier and less seasonal during a Glacial).”

“So look again. No Bering Sea warm intrusion. No Canadian cold drain. No Beaufort Gyre when the ice is deep, since there will be no wind driven circulation under the ice. The Asian current toward the Bering Sea will end. The entire Asian warm river drain into the Arctic likely freezes up and doesn’t happen – which raises the interesting question of where does it go then? But that is for another day. Like asking where the Alaskan rivers drain then, or are they just glaciers at that point?”

“In short, what is left is just the North Atlantic Drift (aka Gulf Stream for Americans) warming a small patch near Europe and some cold water near Greenland. As Scotland was under ice in the last Glacial, even that North Atlantic Drift circulation likely didn’t get very far north.”
https://chiefio.wordpress.com/2014/05/04/arctic-flushing-and-interglacial-melt-pulses/

In addition to water circulation effects, sea ice extent is influenced by clouds and winds.

“Researchers have found that the high amounts of cloud in the early summer lead to low concentrations of sea ice in the late summer. This relationship between cloud cover and sea ice is so strong that it can explain up to 80 per cent of the variation in sea ice over as much as 60 per cent of the the sea ice area.”

http://www.reportingclimatescience.com/news-stories/article/high-cloud-levels-drive-low-arctic-sea-ice.html

“We have shown evidence that low level winds over the Arctic, play an important role in mediating the rate of retreat of sea ice during summer. Anomalous anticyclonic flow over the interior of the Arctic directed toward the Fram Strait favors rapid retreat and vice versa. We have argued that the relative rankings of the September SIE for the years 2007, 2010 and 2011 are largely attributable to the differing rates of decrease of SIE during these summers, which are a consequence of year-to-year differences in the seasonal evolution of summertime winds over the Arctic. . . It is not clear why anticyclonic wind anomalies have been prevalent in recent years. ”

Click to access 2012GL051330.pdf

Conclusion:

Like most things in the climate, Arctic sea ice extent is determined by many interacting factors.  Among those many influences, the weakest case is claiming CO2 as a driving force.