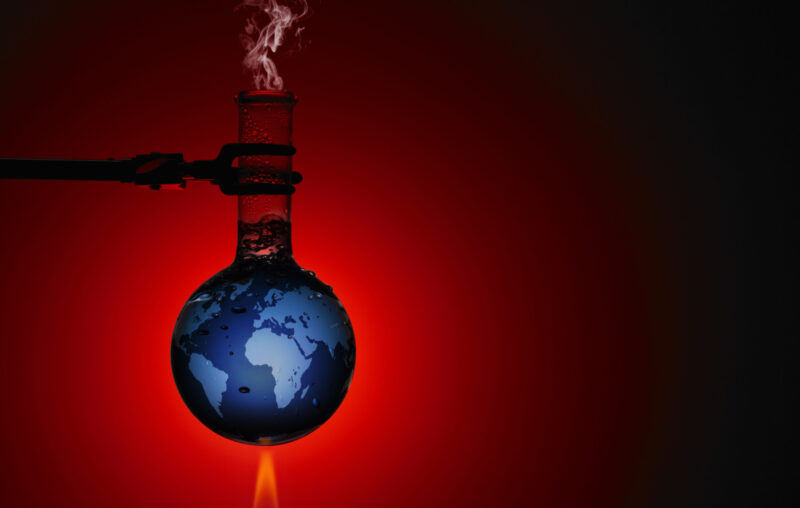
Why Climate Models Can’t Be Right

Vic Hughes explains in his American Thinker article The Blunt Truth about Global Warming Models. Excerpts in italics with my bolds and added images.
I may be one of the first scientists in the country to know that
predicting long-term temperatures is not possible.
Almost 50 years ago, while in grad school, I had a contract from an Army research lab to use a state-of-the-art models to predict long-term temperatures. I quickly realized that the goal of the project, to forecast accurately the temperature long-term, was impossible because small errors in data inputs could result in huge forecasts errors. Equally important was that errors compounded so quickly that it caused the error ranges to explode. The results were junk.
As an example, what good is a temperature forecast with an error range
of plus or minus one hundred degrees?
I give university speeches to scientists and tell them: if you ever see some data or forecasts, your first question has to be “what’s the error range?” If you don’t know the error range, the data are almost useless. It’s not coincidental that the Climate Mafia don’t highlight this problem
So what about modern technology solving these problems? These error problems are still true today. It’s not that the long-term temperature forecasts are wrong; it’s that they can’t be right. All global warming modelers know this, or they are incredibly stupid, or they just lie about it for money or power.
When the U.N. Intergovernmental Panel on Climate Change made even a pretense of being science-based, they used to admit it. From the 2001 IPCC Third Assessment Report:
“The climate system is a coupled non-linear chaotic system, and therefore
the long-term prediction of future climate states is not possible.”
The weather is a coupled, non-linear chaotic system. Chaos theory says very small changes in inputs can result in totally different outcomes. This concept is counterintuitive for most people. We intrinsically think that if you’re a little off at the beginning, you should be a little off at the end. Try that on a mountain trail next to a cliff.
The Climate Mafia know that this is true, but they still want money and power. They argue that even though you can’t make a real temperature forecast, they can create a completely bogus forecasting approach, where they take a bunch of different climate models that don’t agree (so much for settled science) and combine their outputs. They then say voilà: we have a correct prediction, and they use pseudo-statistics to get around the error problem. The way I visualize it is, if you take a bunch (an ensemble sounds more scientific) of wrong answers and then combine them, that is the right answer. Absurd.

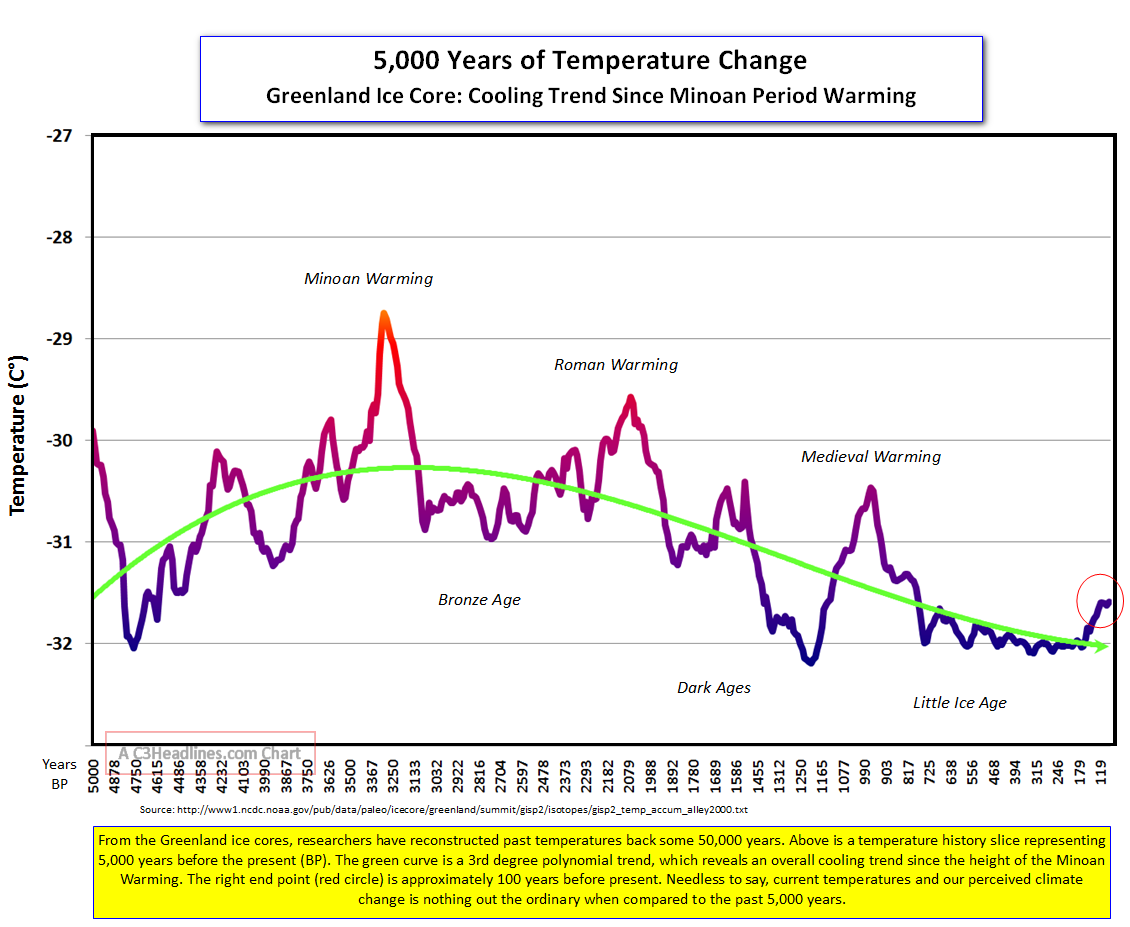
Since your input data are critical to forecasting the Chaotic Future, fully understanding past temperatures is also critical. The Climate Mafia create the entirely bogus concept of an “average Earth temperature” to create a bogus base data set for their bogus models. The Warming Scammers like to use a garbage temperature history that starts about 1850. The Scammers say that their temperatures increased since 1850, just coincidentally at the end of a three-hundred-year cooling cycle, represent the rise of the industrial pollution age. In 1850, and even in 1950, only a small percentage of world’s population could even be considered close to industrialized. Look at India, Africa, and China then: almost medieval energy use patterns until really recently. Humans have been around in their current form for many tens of thousands of years. To say the weather since the 1850s is representative of anything from a statistical perspective is a joke.
So what kind of temperature data do we have since 1850?
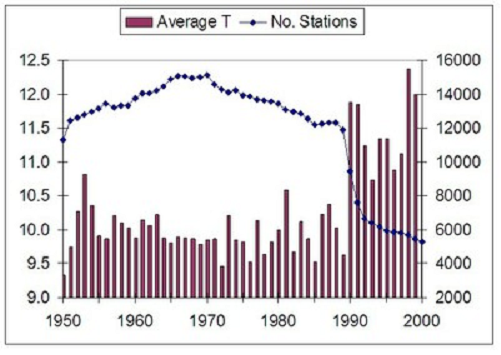
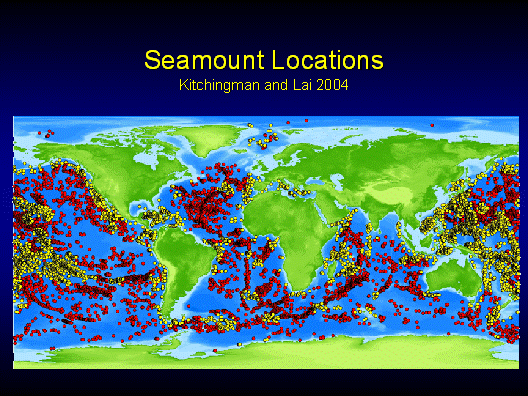
With oceans and ice caps covering over 80+% of the world’s surface, we have virtually no reliable long-term data on any of that, other than the last few decades. Even then, you are talking about a relatively small number of measuring devises in all those places. (Do you check the weather a few hundred miles away to know if you need an umbrella?) How about the temperature trends in deserts, on mountains, in the middle of Africa, South America, Siberia — at sea level, a hundred feet elevation, a thousand feet elevation? The data are so bad in all of the Southern Hemisphere — half the globe — that there are only a few datasets even close to reliable since the 1850s. There are almost no real, reliable, and complete long-term data globally, and particularly none reliable enough to create model of a chaotic system entirely dependent on very accurate input data.
The concept of “average Earth temperature” is critical to their bogus forecasting, but because we think “average” generally means something useful, it gets a mental pass. As an example, describe the “average” human.
Let me offer a thought experiment. What is the average temperature
of your house within one degree?
How many sensors, with what degree of accuracy reading the temperature, how often, would you need to know the average temperature within one degree? One sensor won’t do it. Would ten sensors (a hundred? a thousand?) be needed to cover the ceilings, floors, six feet up, each corner of every room, near every doors and window and heat source, measuring the temperature every hour, minute, second for a period of years, to get an average temperature within one degree? How do you weight a gauge in a big room versus a small one, or in the ceiling versus the floor?
If we can’t even figure out the long-term average temperature of one building, it is complete hubris to think we can create accurate enough global temperature inputs to predict 100 years out.

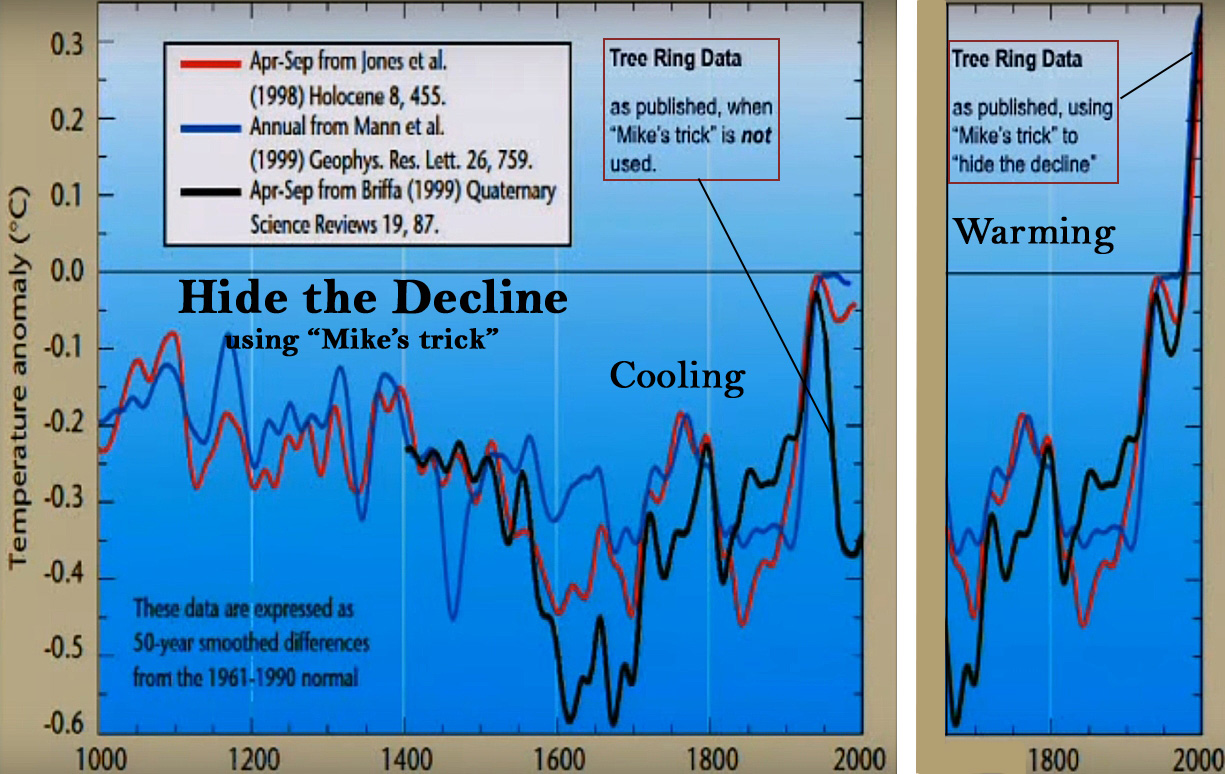
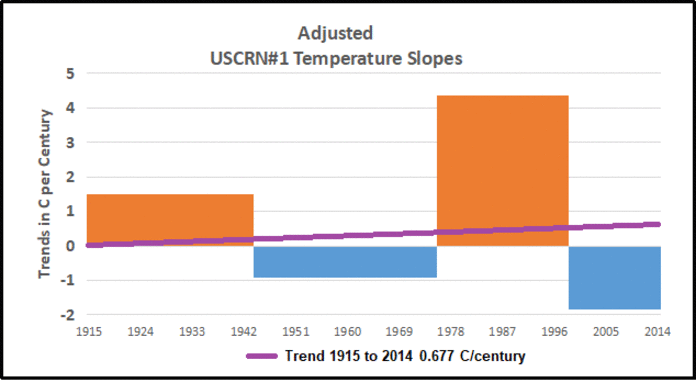
I won’t even get into outright data fraud, like lowering the hot 1930s or selectively changing input locations to make the current temperatures look hotter. The data are bad enough on their own. Using faulty data to predict the future creates faulty forecasts. Garbage in, garbage out.
Perhaps the greatest part of the Global Warming Scam is that it requires a complete disregard for common sense. We all know that weather forecasters can’t predict next week’s weather within 1 degree, but the Scammers push the lie that they can predict the temperature a hundred years from now within a degree or two. That literally defies credulity.
More importantly, say you had perfect data and a perfect model. How could we possibly know what impact that will have? Another thought experiment: How much will temperatures vary where you live today? Ten degrees? Twenty degrees? Thirty? How much does it vary in a year? For most of the U.S., that number might be 50 degrees, a 100 degrees. So plants and animals have adapted to 20-degree temperatures changes in a day or 100-degree temperature changes in a year.
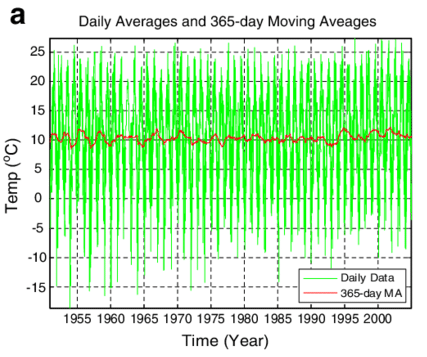
Daily average temperature variability of Bolu City, Turkey, and its 365-day moving average.
Somehow a 1- or 2-degree temperature change in a hundred years
is going to take them out? That’s ridiculous.
Finally, when somebody offers me a forecast, my first question is, how right have your other forecasts been? We are now in the third or fourth ten-year period of the last forty years when the world is going to end in ten years. That tells you all you need to know about global warming forecasting.

The fact that any counter-narratives have to be censored is also damning. A final fact to consider is one my mother taught me at a young age: when the other side starts calling you names (deniers, anti-vaxxers), you know they have lost the argument.
And yet we should totally restructure society based on those impossible models. This was probably the greatest scientific lie in history, and people believed it. After that, selling the lie that even though mRNA vaccines have never worked in thirty years and generally killed all their test subjects but are now safe and effective for humans, including babies, after two months of limited testing, is child’s play. Joseph Goebbels, a proponent of the “Big Lie,” would be proud about both lies.
Before we restructure the world based on models, we must realize they can’t be right.
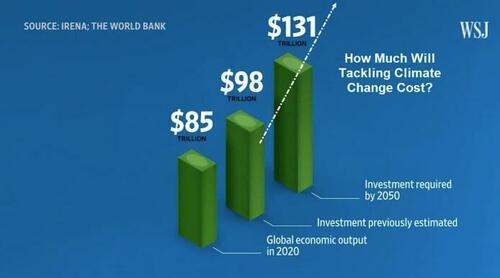
The blue background obscures these are estimates of TRILLIONS of Dollars.


 Christopher Lingle explains in his AIER article


:format(webp):no_upscale()/cdn.vox-cdn.com/uploads/chorus_asset/file/24784984/gfs_spole_sat_t2anom_d1_July12.png)