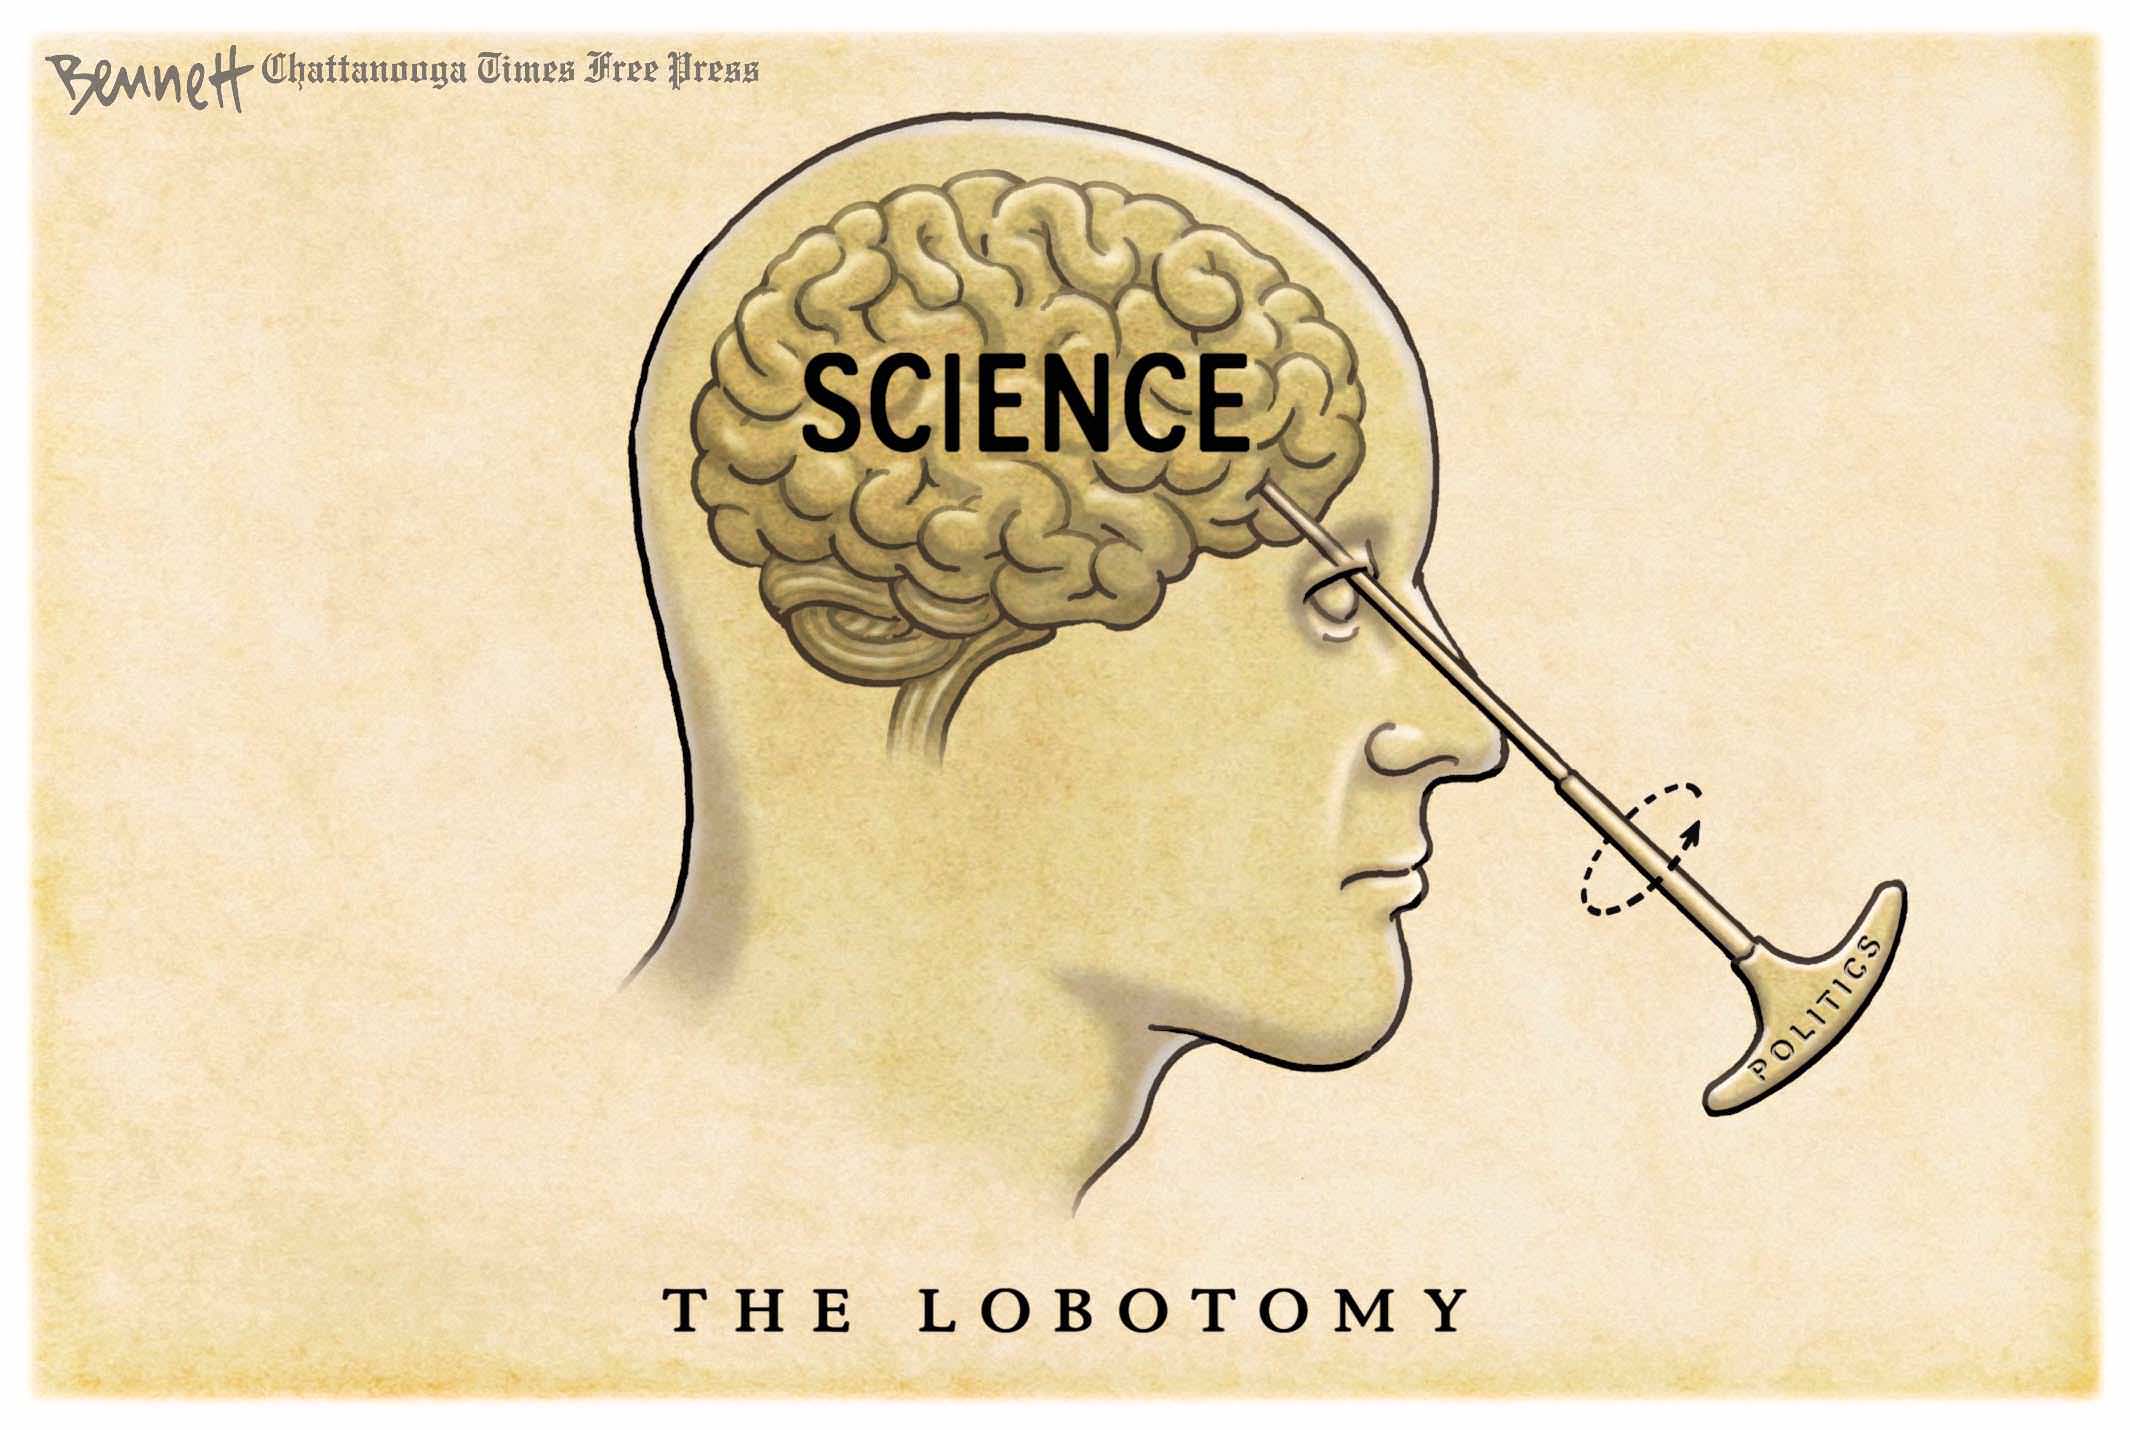
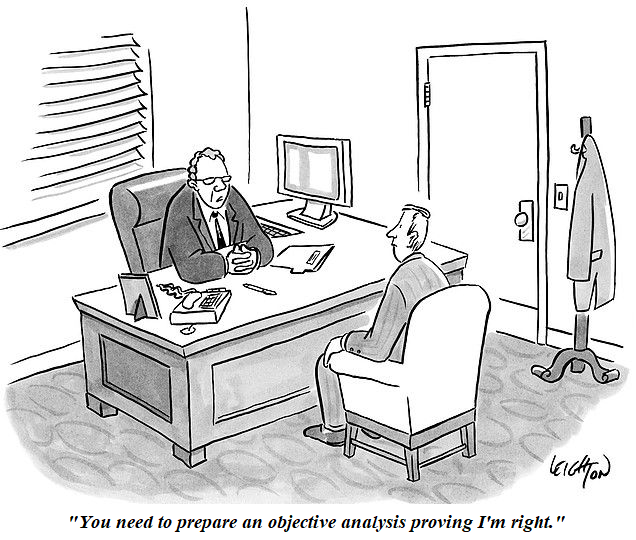
X-Weather is Climate Scoundrels’ Last Refuge

John Ray posted on his blog an update of climatists power play against scientific facts contrary to their beliefs. The saga is about the Alimonte et al. (2022) analysis of extreme weather events and the lack of evidence to attribute them to global warming.  In italics with my bolds Ray’s post is:

The “extreme events” issue

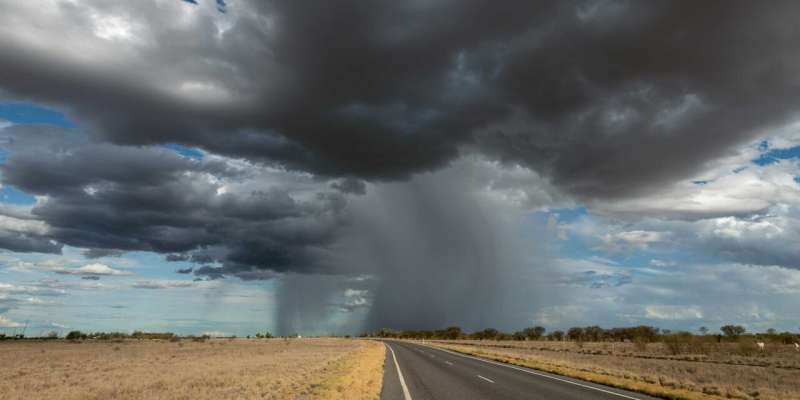
The very gradual process of global warming that we have seen so far has produced no direct ill-effects that we can see. Crops are more abundant than ever and some Pacific islands are growing rather than shrinking. So “extreme events” are the last refuge of the warmists. Bad weather generally is routinely branded as an extreme event and is attributed to global warming without any shred of evidence for the link.

Any causal statement requires controls.

You have to show that the “caused” event would not have happened without the “cause” specified. But that would require you to show what would have happened WITHOUT global warming — and that is impossible.

Single events might or might not be due to some influence or other but you have no way of showing what the influence was. It is known as the “attribution” problem and is in principle unsolvable where the event is a “one-off”, a hurricane, for instance. You have to have variations in the causal condition to correlate with the alleged caused condition. Would this hurricane have happened in the absence of global warming? We cannot know. We can only surmise. And a surmise is no proof.

So the attribution of individual extreme events to global warming is LOGICALLY false. It CANNOT be shown as be fact. But science is at ease with hypotheses so it remains a hypothesis that COULD be true even if proving it is currently impossible.

And an hypothesis can be tested in various ways. It is commonly tested by asking if it generates accurate predictions. And it could be held as preliminary support for an hypothesis that the incidence of extreme events has systematically increased as the globe has warmed. Is there a correlation? So has it? There are some claims to that effect but how well-founded are they? Have extreme events in fact become more frequent?

A recent study has addressed that hypothesis. They have looked at a big range of reports about extreme events and asked are such events becoming more frequent. For each of a range or event extremes they have gathered published information about whether such events are increasing in frequency over time. An abstract of the report concerned is given below.

It finds no evidence that any extreme event has become more frequent.
So the claimed connections are not only logically false
but they are empirically false too.

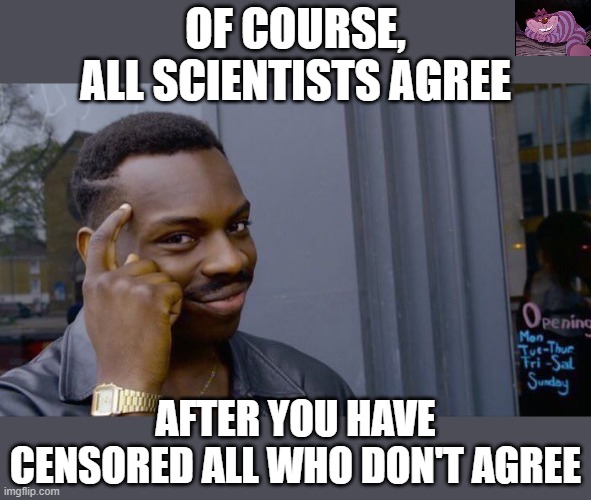
The study was published 18 months ago and various climate skeptics have quoted it approvingly. That approval has eventually got under the skin of the Warmists so they have tried to discredit the research concerned. And their antagonism to the paper has borne fruit. The paper was “withdrawn” by its publisher, which counts as evidence that it is faulty.

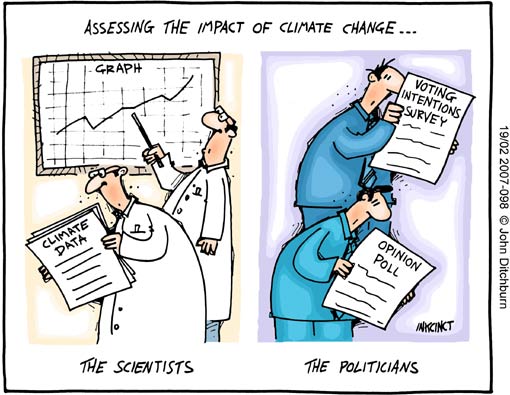
But is it faulty? A much quoted attack on the paper in “The Guardian” lists a whole array of orthododox Warmists who say it is faulty but detailed evidence of the faults is conspicuously missing. No detailed numbers are quoted and the issue is entirely a matter of numbers. The Guardian makes clear that orthodox scientists disagree with the paper but does not give chapter and verse why. Link to The Guardian below:

Note that some of the attacks from Warmists are of the most intellectually discreditable kind: “Ad hominem” attacks — attacking the motives of the authors rather than the evidence they put forward

And that none of the critics quote the detailed numbers is a major scientific fault.

If a scientist disagrees with the conclusions of a particular paper — as I have often done — he goes over the ground covered by the paper and shows where it went wrong. In this case the paper at issue is a meta-analysis so the data behind it is readily available. Its conclusions are readily tested by repeating the meta-analysis in some more cautious way. Nobody seems to have attempted that. “Do better” is the obvious retort to the Warmists but none seem even to have attempted that.

The next link takes you to an extensive discussion of whether the paper deserved withdrawal:

The abstract of the deplored paper follows:

A critical assessment of extreme events trends in times of global warming

Gianluca Alimonti et al.

Abstract

This article reviews recent bibliography on time series of some extreme weather events and related response indicators in order to understand whether an increase in intensity and/or frequency is detectable. The most robust global changes in climate extremes are found in yearly values of heatwaves (number of days, maximum duration and cumulated heat), while global trends in heatwave intensity are not significant. Daily precipitation intensity and extreme precipitation frequency are stationary in the main part of the weather stations. Trend analysis of the time series of tropical cyclones show a substantial temporal invariance and the same is true for tornadoes in the USA. At the same time, the impact of warming on surface wind speed remains unclear. The analysis is then extended to some global response indicators of extreme meteorological events, namely natural disasters, floods, droughts, ecosystem productivity and yields of the four main crops (maize, rice, soybean and wheat). None of these response indicators show a clear positive trend of extreme events. In conclusion on the basis of observational data, the climate crisis that, according to many sources, we are experiencing today, is not evident yet. It would be nevertheless extremely important to define mitigation and adaptation strategies that take into account current trends.

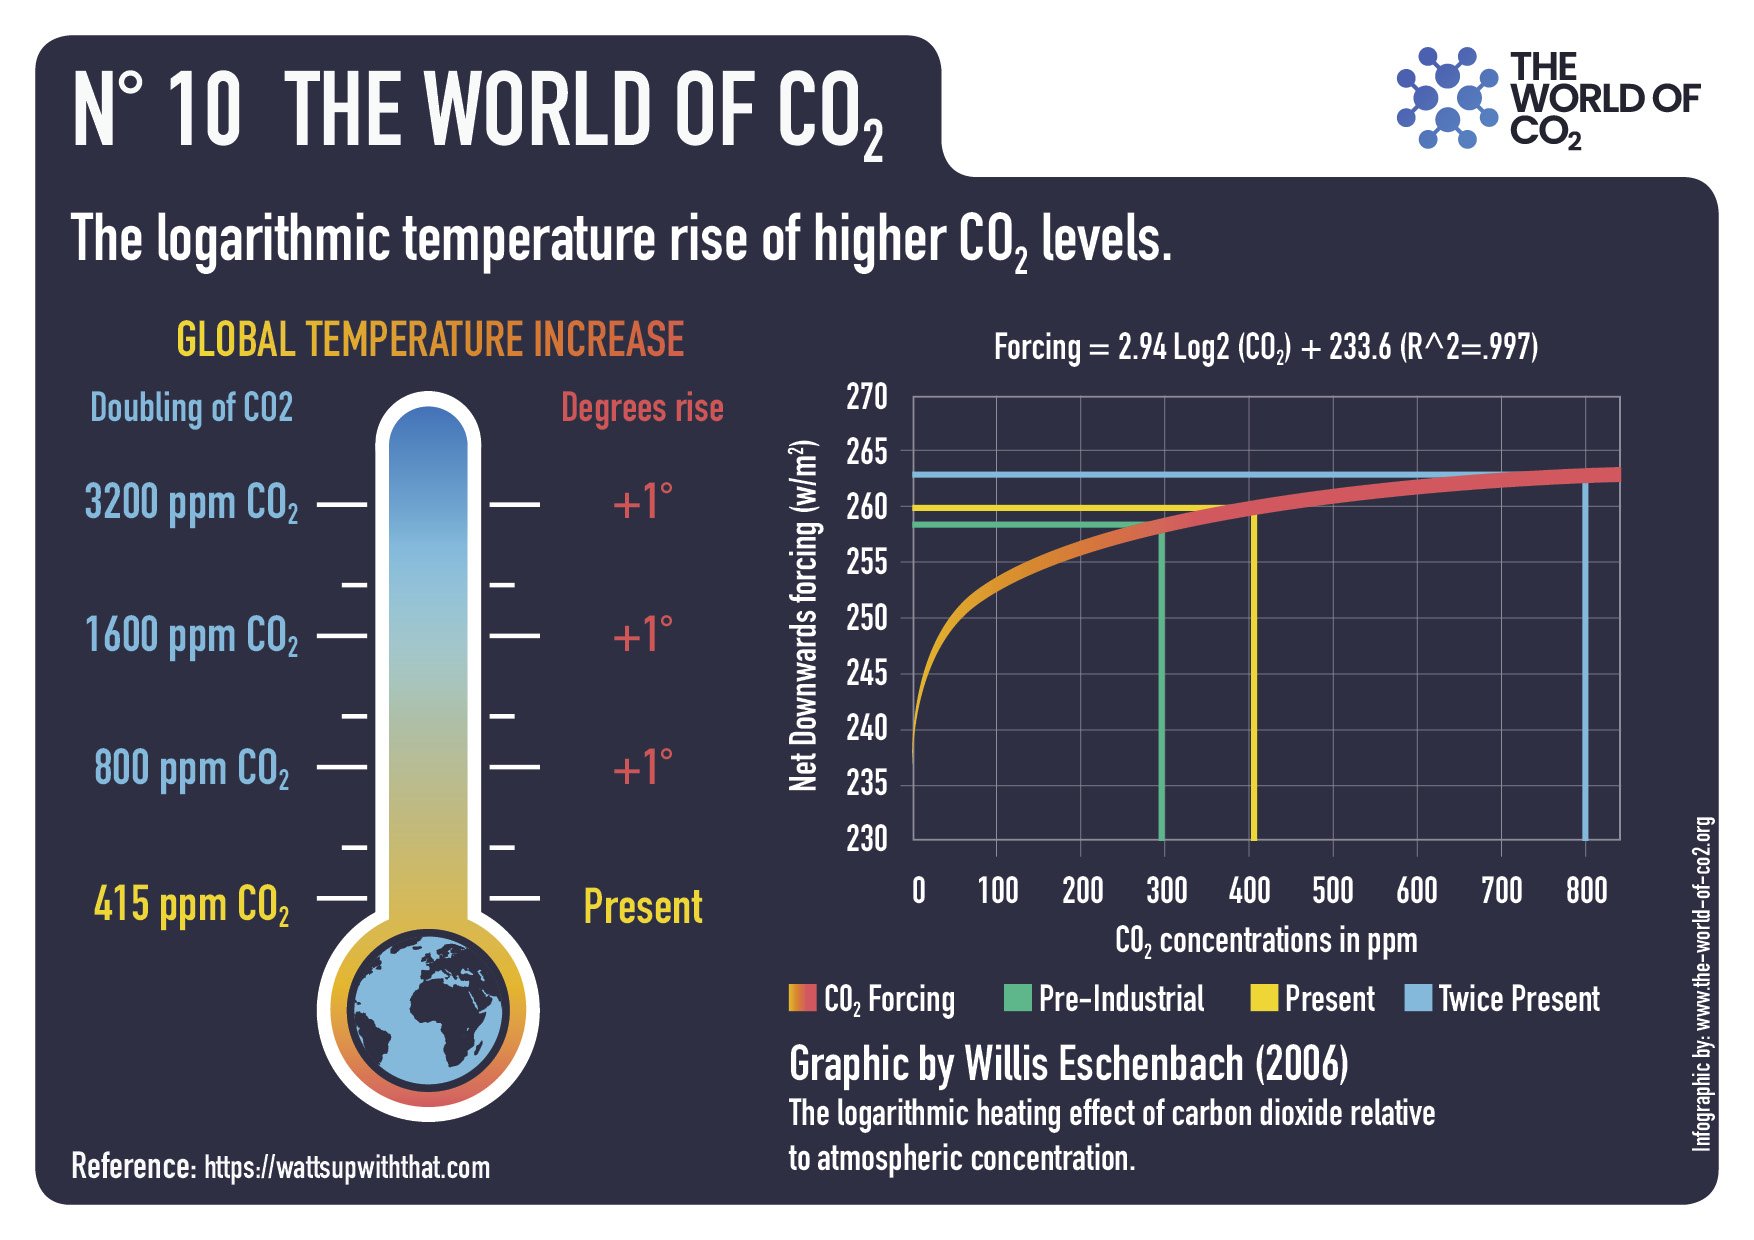
A 2015 study by 22 scientists from around the world found that cold kills over 17 times more people than heat. Thus the planet’s recent modest warming has been saving millions of lives.

Springer website reports the paper retracted August 23, 2023.  The article was revised by the authors and published at Environmental Hazards journal on August 3, 2023 as reported at Taylor & Francis online

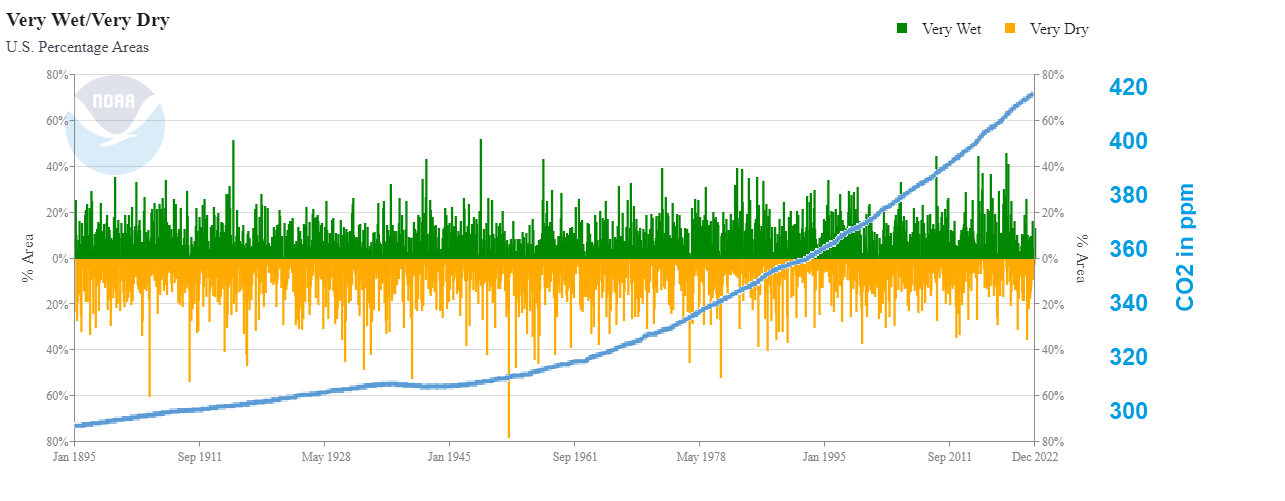
Is the number of global natural disasters increasing?

We analyze temporal trends in the number of natural disasters reported since 1900 in the Emergency Events Database (EM-DAT) from the Center for Research on the Epidemiology of Disasters (CRED). Visual inspection suggests three distinct phases: first, a linear upward trend to around mid-century followed by rapid growth to the turn of the new century, and thereafter a decreasing trend to 2022. These observations are supported by piecewise regression analyses that identify three breakpoints (1922, 1975, 2002), with the most recent subperiod 2002–2022 characterized by a significant decline in number of events. A similar pattern over time is exhibited by contemporaneous number of geophysical disasters – volcanoes, earthquakes, dry landslides – which, by their nature, are not significantly influenced by climate or anthropogenic factors. We conclude that the patterns observed are largely attributable to progressively better reporting of natural disaster events, with the EM-DAT dataset now regarded as relatively complete since ∼2000. The above result sits in marked contradiction to earlier analyses by two UN bodies (FAO andUNDRR), which predicts an increasing number of natural disasters and impacts in concert with global warming. Our analyses strongly refute this assertion as well as extrapolations published by UNDRR based on this claim.

Conclusion Alimonte et al.

Fearing a climate emergency without this being supported by data, means altering the framework of priorities with negative effects that could prove deleterious to our ability to face the challenges of the future, squandering natural and human resources in an economically difficult context, even more negative following the COVID emergency. This does not mean we should do nothing about climate change: we should work to minimize our impact on the planet and to minimize air and water pollution.

Whether or not we manage to drastically curtail our carbon dioxide emissions in the coming decades, we need to reduce our vulnerability to extreme weather and climate events. Leaving the baton to our children without burdening them with the anxiety of being in a climate emergency would allow them to face the various problems in place (energy,agricultural-food, health, etc.) with a more objective and constructive spirit, with the goal of arriving at a weighted assessment of the actions to be taken without wasting the limited resources at our disposal in costly and ineffective solutions.

How the climate of the twenty-first century will play out is a topic of deep uncertainty. We need to increase our resiliency to whatever the future climate will present us.We need to remind ourselves that addressing climate change is not an end in itself, and that climate change is not the only problem that the world is facing. The objective should be to improve human well-being in the twenty-first century, while protecting the environmentas much as we can.  And it would be a nonsense not to do so: it would be like not taking care of the house where we were born and raised.

Tony Thomas describes the climate scoundrels and their machinations at the Quadrant:  How Science is Done These Days

Footnote Add Another Scoundrel


Sun and Water Drive Climate, Not Us

One year time lapse of precipitable water (amount of water in the atmosphere)
from Jan 1, 2016 to Dec 31, 2016, as modeled by the GFS.The Pacific
ocean rotates into view just as the tropical cyclone season picks up steam.

Lately the media refers increasingly to how important is the water cycle in our climate system.  Unfortunately, as usual, the headlines confuse cause and effect.  For example, Climate change has a dramatic impact on the global water cycle, say researchers. from phys.org.  How perverse to position climate change as an agent rather than the effect from water fluxes in the ocean and atmosphere. The headline misleads entirely (written by scientists or journos?) as the beginning texts shows (in italics with my bolds).

For Christoph Schär, ETH Zurich’s Professor of Climate and Water Cycle, “global warming” is not quite accurate when it comes to describing the driver of climate change. “A better term would be ‘climate humidification,'” he explains. “Most of the solar energy that reaches the Earth serves to evaporate water and thereby drives the hydrological cycle.” Properly accounting for the implications of this is the most challenging task of all for climate modelers.

In order to build a global climate model, grid points spaced around 50 to 100 kilometers apart are used. This scale is too coarse to map small-scale, local thunderstorm cells. Yet it is precisely these thunderstorm cells—and where they occur—that drive atmospheric circulation, especially in the tropics, where solar radiation is highest.

The workaround, at present, is to add extra parameters to the model in order to map clouds. “But predicting future climate change is still pretty imprecise,” Schär says. “If we don’t know how many clouds are forming in the tropics, then we don’t know how much sunlight is hitting the earth’s surface—and hence we don’t know the actual size of the global energy balance.”

Even worse from NewScientist How we broke the water cycle and can no longer rely on rain to fall.  What hubris and how preposterous to claim our puny CO2 emissions have upset hydrology.  The lack of correlation is obvious to those who care to look:

The climatist paradigm is myopic and lopsided.  A previous post below provides a cure for those whose vision is impaired by the IPCC consensus view of climate reality.

Curing Radiation Myopia Regarding Climate

E.M. Smith provides an helpful critique of a recent incomplete theory of earth’s climate functioning in his Chiefio blog post So Close–Missing Convection and Homeostasis. Excerpts in italics with my bolds and added images.

It is Soooo easy to get things just a little bit off and miss reality. Especially in complex systems and even more so when folks raking in $Millions are interested in misleading for profit. Sigh.

Sabine Hosenfelder does a wonderful series of videos ‘explaining’ all sorts of interesting things in and about actual science and how the universe works. She is quite smart and generally “knows her stuff”. But… It looks like she has gotten trapped into the Radiative Model of Globull Warming.

The whole mythology of Global Warming depends on having you NOT think about anything but radiative processes and physics. To trap you into the Radiative Model. But the Earth is more complex than that. Much more complex. Then there’s the fact that you DO have some essential Radiative Physics to deal with, so the bait is there.   However…

It is absolutely essential to pay attention to convection in the lower atmosphere
and to the “feedback loops” or homeostasis in the system.

The system acts to restore its original state. There is NO “runaway greenhouse” or we would have never evolved into being since the early earth had astoundingly high levels of CO2 and we would have baked to death before getting out of our slime beds as microbes.

Figure 16. The geological history of CO2 level and temperature proxy for the past 400 million years. CO2 levels now are ~ 400ppm. Source: Davis, W. J. (2017).

OK, I’ll show you her video. It is quite good even with the “swing and a miss” at the end. She does 3 levels of The Greenhouse Gas Mythology so you can see the process evolving from grammar school to high school to college level of mythology. But then she doesn’t quite make it to Post-Doc Reality.

Where’s she wrong? (Well, not really wrong, but lacking…)

I see 2 major issues. First off, she talks about the “lower atmosphere warming”. Well, yes and no. It doesn’t “warm” in the sense of getting hotter, but it does speed up convection to move the added heat flow.

In English “heating” has 2 different meanings. Increasing temperature.
Increasing heat flow at a temperature.

We see this in “warm up the TV dinner in the microwave” meaning to heat it up from frozen to edible; and in the part where the frozen dinner is defrosting at a constant temperature as it absorbs heat but turns it into the heat of fusion of water. So you can “warm it up” by melting at a constant temperature of frozen water (but adding a LOT of thermal energy – “heat”) then later as increasing temperature once the ice is melted. It is very important to keep in mind that there are 2 kinds of “heating”. NOT just “increasing temperature”.

In the lower atmosphere, the CO2 window / Infrared Window is already firmly slammed shut. Sabine “gets that”. Yay! One BIG point for her! No amount of “greenhouse gas” is going to shut that IR window any more. As she points out, you get about 20 meters of transmission and then it is back to molecular vibrations (aka “heat”).

So what’s an atmosphere to do? It has heat to move! Well, it convects. It evaporates water.

Those 2 things dominate by orders of magnitude any sort of Radiative Model Physics. Yes, you have radiation of light bringing energy in, but then it goes into the ocean and into the dirt and the plants and even warms your skin on a sunny day. And it sits there. It does NOT re-radiate to any significant degree. Once “warmed” by absorption, heat trying to leave as IR hits a slammed shut window.

The hydrological cycle. Estimates of the observed main water reservoirs (black numbers in 10^3 km3 ) and the flow of moisture through the system (red numbers, in 10^3 km3 yr À1 ). Adjusted from Trenberth et al. [2007a] for the period 2002-2008 as in Trenberth et al. [2011].

So what does happen? Look around, what do you see? Clouds. Rain. Snow. (sleet hail fog etc. etc.)

Our planet is a Water Planet. It moves that energy (vibrations of atoms, NOT radiation) by having water evaporate into the atmosphere. (Yes, there are a few very dry deserts where you get some radiative effects and can get quite cold at night via radiation through very dry air, but our planet is 70% or so oceans, so those areas are minor side bars on the dominant processes). This water vapor makes the IR window even more closed (less distance to absorption). It isn’t CO2 that matters, it is the global water vapor.

What happens next?

Well, water holds a LOT of heat (vibration of atoms and NOT “temperature”) as the heat of vaporization. About 540 calories per gram (compared to 80 for melting “heat of fusion” and 1 for specific heat of a gram of water). Compare those numbers again. 1 for a gram of water. 80 for melting a gram of ice. 540 for evaporating a gram of water. It’s dramatically the case that evaporation of water matters a lot more than melting ice, and both of them make “warming water” look like an irrelevant thing.

Warming water is 1/80 as important as melting ice, and it is 1/540 th as important as evaporation of the surface of the water. Warming air is another order of magnitude less important to heat content.

So to have clue, one MUST look at the evaporation of water from the oceans as everything else is in the small change.

Look at any photo of the Earth from space. The Blue Marble covered in clouds. Water and clouds. The product of evaporation, convection, and condensation. Physical flows carrying all that heat (“vibration of atoms” and NOT temperature, remember). IF you add more heat energy, you can speed up the flows, but it will not cause a huge increase in temperature (and mostly none at all). It is mass flow that changes. The number of vibrating molecules at a temperature, not the temperature of each.

In the end, a lot of mass flow happens, lofting all that water vapor with all that heat of vaporization way up toward the Stratosphere. This is why we have a troposphere, a tropopause (where it runs out of steam… literally…) and a stratosphere.

What happens when it gets to the stratosphere boundary? Well, along the way that water vapor turns into water liquid very tiny drops (clouds) and eventually condenses to big drops of water (rain) and some of it even freezes (hail, snow, etc.). Now think about that for a minute. That’s 540 calories per gram of heat (molecular vibration NOT temperature, remember) being “dumped” way up high in the top of the troposphere as it condenses, and another 80 / gram if if freezes. 620 total. That’s just huge.

This is WHY we have a globe covered with rain, snow, hail, etc. etc. THAT is all that heat moving. NOT any IR Radiation from the surface. Let that sink in a minute. Fix it in your mind. WATER and ICE and Water Vapor are what moves the heat, not radiation. We ski on it, swim in it, have it water our crops and flood the land. That’s huge and it is ALL evidence of heat flows via heat of vaporization and fusion of water.

It is all those giga-tons of water cycling to snow, ice and rain, then falling back to be lofted again as evaporation in the next cycle. That’s what moves the heat to the stratosphere where CO2 then radiates it to space (after all, radiation toward the surface hits that closed IR window and stops.) At most, more CO2 can let the Stratosphere radiate (and “cool”) better. It can not make the Troposphere any less convective and non-radiative.

Then any more energy “trapped” at the surface would just run the mass transport water cycle faster. It would not increase the temperature.

More molecules would move, but at a limit on temperature. Homeostasis wins. We can see this already in the Sub-Tropics. As the seasons move to fall and winter, water flows slow dramatically. I have to water my Florida lawn and garden. As the seasons move to spring and summer, the mass flow picks up dramatically. Eventually reaching hurricane size. Dumping up to FEET of condensed water (that all started as warm water vapor evaporating from the ocean). It is presently headed for about 72 F today (and no rain). At the peak of hurricane season, we get to about 84 or 85 F ocean surface temperature as the water vapor cycle is running full blast and we get “frog strangler” levels of rain. That’s the difference. Slow water cycle or fast.

IF (and it is only an “if”, not a when) you could manage to increase the heat at the surface of the planet in, say, Alaska: At most you would get a bit more rain in summer, a bit more snow in winter, and MAYBE only a slight possible, of one or two days that are rain which could have been snow or sleet.

Then there’s the fact that natural cycles swamp all of that CO2 fantasy anyway. The Sun, as just one example, had a large change of IR / UV levels with both the Great Pacific Climate Shift (about 1975) and then back again in about 2000. Planetary tilt, wobble, eccentricity of the orbit and more put us in ice ages (as we ARE right now, but in an “interglacial” in this ice age… a nice period of warmth that WILL end) and pulls us out of them. Glacials and interglacials come and go on various cycles (100,000 years, 40,000 years, and 12,000 year interglacials – ours ending now, but slowly). The simple fact is that Nature Dominates, and we are just not relevant. To think we are is hubris of the highest order.

See Also  Bill Gray: H20 is Climate Control Knob, not CO2

Figure 9: Two contrasting views of the effects of how the continuous intensification of deep cumulus convection would act to alter radiation flux to space. The top (bottom) diagram represents a net increase (decrease) in radiation to space

Footnote

There are two main reasons why investigators are skeptical of AGW (anthropogenic global warming) alarm. This post intends to be an antidote to myopic and lop-sided understandings of our climate system.

  1. CO2 Alarm is Myopic: Claiming CO2 causes dangerous global warming is too simplistic. CO2 is but one factor among many other forces and processes interacting to make weather and climate.

Myopia is a failure of perception by focusing on one near thing to the exclusion of the other realities present, thus missing the big picture. For example: “Not seeing the forest for the trees.”  AKA “tunnel vision.”

2. CO2 Alarm is Lopsided: CO2 forcing is too small to have the overblown effect claimed for it. Other factors are orders of magnitude larger than the potential of CO2 to influence the climate system.

Lopsided

Lop-sided refers to a failure in judging values, whereby someone lacking in sense of proportion, places great weight on a factor which actually has a minor influence compared to other forces. For example: “Making a mountain out of a mole hill.”

Why Climate Models Can’t Be Right

Vic Hughes explains in his American Thinker article The Blunt Truth about Global Warming Models.  Excerpts in italics with my bolds and added images.

I may be one of the first scientists in the country to know that
predicting long-term temperatures is not possible.

Almost 50 years ago, while in grad school, I had a contract from an Army research lab to use a state-of-the-art models to predict long-term temperatures. I quickly realized that the goal of the project, to forecast accurately the temperature long-term, was impossible because small errors in data inputs could result in huge forecasts errors. Equally important was that errors compounded so quickly that it caused the error ranges to explode. The results were junk.

As an example, what good is a temperature forecast with an error range
of plus or minus one hundred degrees?

I give university speeches to scientists and tell them: if you ever see some data or forecasts, your first question has to be “what’s the error range?” If you don’t know the error range, the data are almost useless. It’s not coincidental that the Climate Mafia don’t highlight this problem

So what about modern technology solving these problems? These error problems are still true today. It’s not that the long-term temperature forecasts are wrong; it’s that they can’t be right. All global warming modelers know this, or they are incredibly stupid, or they just lie about it for money or power.

When the U.N. Intergovernmental Panel on Climate Change made even a pretense of being science-based, they used to admit it. From the 2001 IPCC Third Assessment Report:

“The climate system is a coupled non-linear chaotic system, and therefore
the long-term prediction of future climate states is not possible.”

The weather is a coupled, non-linear chaotic system. Chaos theory says very small changes in inputs can result in totally different outcomes. This concept is counterintuitive for most people. We intrinsically think that if you’re a little off at the beginning, you should be a little off at the end. Try that on a mountain trail next to a cliff.

The Climate Mafia know that this is true, but they still want money and power. They argue that even though you can’t make a real temperature forecast, they can create a completely bogus forecasting approach, where they take a bunch of different climate models that don’t agree (so much for settled science) and combine their outputs. They then say voilà: we have a correct prediction, and they use pseudo-statistics to get around the error problem. The way I visualize it is, if you take a bunch (an ensemble sounds more scientific) of wrong answers and then combine them, that is the right answer. Absurd.

Since your input data are critical to forecasting the Chaotic Future, fully understanding past temperatures is also critical. The Climate Mafia create the entirely bogus concept of an “average Earth temperature” to create a bogus base data set for their bogus models. The Warming Scammers like to use a garbage temperature history that starts about 1850. The Scammers say that their temperatures increased since 1850, just coincidentally at the end of a three-hundred-year cooling cycle, represent the rise of the industrial pollution age. In 1850, and even in 1950, only a small percentage of world’s population could even be considered close to industrialized. Look at India, Africa, and China then: almost medieval energy use patterns until really recently. Humans have been around in their current form for many tens of thousands of years. To say the weather since the 1850s is representative of anything from a statistical perspective is a joke.

So what kind of temperature data do we have since 1850?

With oceans and ice caps covering over 80+% of the world’s surface, we have virtually no reliable long-term data on any of that, other than the last few decades. Even then, you are talking about a relatively small number of measuring devises in all those places. (Do you check the weather a few hundred miles away to know if you need an umbrella?) How about the temperature trends in deserts, on mountains, in the middle of Africa, South America, Siberia — at sea level, a hundred feet elevation, a thousand feet elevation? The data are so bad in all of the Southern Hemisphere — half the globe — that there are only a few datasets even close to reliable since the 1850s. There are almost no real, reliable, and complete long-term data globally, and particularly none reliable enough to create model of a chaotic system entirely dependent on very accurate input data.


The concept of “average Earth temperature” is critical to their bogus forecasting, but because we think “average” generally means something useful, it gets a mental pass. As an example, describe the “average” human.

Let me offer a thought experiment. What is the average temperature
of your house within one degree?

How many sensors, with what degree of accuracy reading the temperature, how often, would you need to know the average temperature within one degree? One sensor won’t do it. Would ten sensors (a hundred? a thousand?) be needed to cover the ceilings, floors, six feet up, each corner of every room, near every doors and window and heat source, measuring the temperature every hour, minute, second for a period of years, to get an average temperature within one degree? How do you weight a gauge in a big room versus a small one, or in the ceiling versus the floor?

If we can’t even figure out the long-term average temperature of one building, it is complete hubris to think we can create accurate enough global temperature inputs to predict 100 years out.

I won’t even get into outright data fraud, like lowering the hot 1930s or selectively changing input locations to make the current temperatures look hotter. The data are bad enough on their own. Using faulty data to predict the future creates faulty forecasts. Garbage in, garbage out.

Perhaps the greatest part of the Global Warming Scam is that it requires a complete disregard for common sense. We all know that weather forecasters can’t predict next week’s weather within 1 degree, but the Scammers push the lie that they can predict the temperature a hundred years from now within a degree or two. That literally defies credulity.

More importantly, say you had perfect data and a perfect model. How could we possibly know what impact that will have? Another thought experiment: How much will temperatures vary where you live today? Ten degrees? Twenty degrees? Thirty? How much does it vary in a year? For most of the U.S., that number might be 50 degrees, a 100 degrees. So plants and animals have adapted to 20-degree temperatures changes in a day or 100-degree temperature changes in a year.

Daily average temperature variability of Bolu City, Turkey, and its 365-day moving average.

Somehow a 1- or 2-degree temperature change in a hundred years
is going to take them out? That’s ridiculous.

Finally, when somebody offers me a forecast, my first question is, how right have your other forecasts been? We are now in the third or fourth ten-year period of the last forty years when the world is going to end in ten years. That tells you all you need to know about global warming forecasting.

The fact that any counter-narratives have to be censored is also damning. A final fact to consider is one my mother taught me at a young age: when the other side starts calling you names (deniers, anti-vaxxers), you know they have lost the argument.

And yet we should totally restructure society based on those impossible models. This was probably the greatest scientific lie in history, and people believed it. After that, selling the lie that even though mRNA vaccines have never worked in thirty years and generally killed all their test subjects but are now safe and effective for humans, including babies, after two months of limited testing, is child’s play. Joseph Goebbels, a proponent of the “Big Lie,” would be proud about both lies.

Before we restructure the world based on models, we must realize they can’t be right.

The blue background obscures these are estimates of TRILLIONS of Dollars.


The Big Lie About Global Warming

The notion that CO2 from human activities causes global warming has multiple flaws, many of which have been dissected and rebutted here and elsewhere.  But The Big Lie is to fundamentally misrepresent how Earth’s climate system works. Richard Lindzen explains in the above interview with Jordan Peterson.  For those who prefer reading I provide a transcript from the closed captions in italics with my bolds and added images.

JP: When you started to object to the narrative, back say in ‘92, To what narrative were you objecting and on what grounds were you objecting?

RL: You’re touching on something that took me a while to understand. You know Goebbels famously said: If you tell a big enough lie and repeat it often enough, it’ll become the truth. there’s been a lot of that in this. But there are aspects of establishing the narrative, that is, what makes something the truth that I hadn’t appreciated.

So the narrative was the climate is determined by a greenhouse effect
and adding CO2 to it increases warming. And moreover besides CO2
the natural greenhouse substances–water vapor, clouds, upper level clouds–
will amplify whatever man does.

Now that immediately goes against Le Chatelier’s principle which says: If you perturb a system and it is capable internally of counteracting that, it will. And our system is so capable.

So that was a little bit odd. You began wondering, where did these feedbacks come from? Immediately people including myself started looking into the feedbacks, and seeing whether there were any negative ones, and how did it all work?

But underlying it, and this is what I learned: if you want to get a narrative established, the crucial thing is to pepper it with errors, questionable things. So that the critics will seize on those and not question the basic narrative.

The basic narrative was that climate is controlled by the greenhouse effect. In point of fact the earth’s climate system has many regions, but two distinctly different regions. There are the tropics roughly minus 30 to plus 30 degrees latitude, and the extra Tropics outside of plus or minus 30 degrees.

They have very different dynamics, and this is the crucial thing for the Earth by the way. And this is a technicality and much harder to convey than saying that greenhouse gases are a blanket or that 97 percent of scientists agree.

This is actually a technical issue. The Earth rotates. Now people are aware that we have day and night, but there is something called the Coriolis effect. When you’re on a rotating system it gives rise to the appearance of forces that change the winds relative to the rotation. So at the pole the rotation vector is perpendicular to the surface, while at the equator it’s parallel to the surface:it’s zero.

And this gives you phenomenally different Dynamics. So where you don’t have a vertical component to the rotation, vector motions do what they do in the laboratory in small scales. If you have a temperature difference, it acts to wipe it out.

Figure 11. Most sunlight is absorbed in the tropics, and some of the heat energy is carried by air currents to the polar regions to be released back into space as thermal radiation. Along with energy, angular momentum — imparted to the air from the rotating Earth’s surface near the equator — is transported to higher northern and southern latitudes, where it is reabsorbed by the Earth’s surface. The Hadley circulation near the equator is largely driven by buoyant forces on warm, solar-heated air, but for mid latitudes the “Coriolis force” due to the rotation of the earth leads to transport of energy and angular momentum through slanted “baroclinic eddies.” Among other consequences of the conservation of angular momentum are the easterly trade winds near the equator and the westerly winds at mid latitudes.

And so if you look at the tropics the temperatures at any surface are relatively flat: they don’t vary much with latitude. On the other hand you go to the mid Latitudes, in the extra Tropics the temperature varies a lot between the tropics and the pole. We know that about how temperatures are cold at high Latitudes. And if you look at changes in climate in the Earth’s history, what they show is a Tropics that stays relatively constant, and what changes is the temperature difference between the tropics and the pole.

During the Ice Age it was about 60 degrees Centigrade, today it’s about 40.  During 50 million years ago something called the eocene the difference was about 20. So that’s all a function of what’s going on outside the tropics. Within the tropics the greenhouse effect is significant but what determines the temperature change between the tropics and the pole has very little to do with the greenhouse effect.

It is a dynamic phenomenon based on the fact that a temperature difference with latitude generates instabilities. These instabilities take the form of the cyclonic and anticyclonic patterns that you see on the weather map. You can see the tropics are very different from even a casual look at a weather map.
The systems that bring us weather travel from west to east at latitudes outside the tropics. Within the tropics they travel from east to west. The prevailing winds are opposite in the two sections.

Sometimes people say that changes due to the greenhouse effect are amplified at the poles. That is not true: there’s no physical basis for that Statement. All they do is determine the starting point for where the temperature changes in mid-latitudes and that’s determined mainly by Hydrodynamics.

Okay that’s complicated to explain to someone and yet it’s the basis for those claims of seemingly large significance of these small numbers. You know they’re saying if Global mean temperature goes up one and a half degrees it’s the end. That’s based on it getting much bigger at high latitudes and determining that. But all one and a half degrees at the equator would do or in the greenhouse part of the Earth is change the temperature everywhere by one and a half degrees, which for most of us is less than the temperature change between breakfast and lunch.

See Also

Arctic “Amplification” Not What You Think


Arctic “Amplification” Not What You Think

HT to Dr. David Whitehouse writing at GWPF regarding a recent study claiming Arctic Amplification is causing a wavey polar vortex, resulting in winter warming and cooling extremes.  His critique is Extreme cold snaps and global warming: A speculative explanation.

This post is challenging the notion of Arctic Amplification itself.  The term is bandied about with the connotation that man-made global warming is multiplied in the Arctic and responsible for weather extremes.

As the animation above shows, there have been in recent years alternating patterns of unusually cold or warm weather in the Northern Hemisphere.  There are several problems in the attempt to link these events to global warming/climate change, i.e. claiming causation from a slow increase in baseline global average temperatures.

  1. Arctic Amplification is an artifact of Temperature Anomalies
  2. Arctic Surface Stations Records Show Ordinary Warming
  3. Arctic Warmth Comes from Meridional Heat Transport, not CO2

Clive Best provides this animation of recent monthly temperature anomalies which demonstrates how most variability in anomalies occur over northern continents.

1. Arctic Amplification is an artifact of Temperature Anomalies

Beyond the issues with the measurements and the questionable adjustments, there is a more fundamental misconception about air temperatures in relation to “climate change.” Clive Best does a fine job explaining why Global Mean Temperature anomalies do not mean what people think. Below is my synopsis of his recent essay entitled Do Global Temperatures make sense? (link)

Background: Earth’s Heat Imbalance

ERBE measurements of radiative imbalance.

The earth’s temperature at any location is never in equilibrium. It changes daily, seasonally and annually. Incoming solar radiation varies enormously especially near the poles which receive more energy per day in summer than the equator.

The earth cools primarily by moving heat from hot tropical regions towards high latitudes where net IR radiation loss cools the planet, thus maintaining a certain temperature profile.

Key Point: GMT Anomalies Are Dominated by the Highest Latitudes

The main problem with all the existing observational datasets is that they don’t actually measure the global temperature at all. Instead they measure the global average temperature ‘anomaly’. . .The use of anomalies introduces a new bias because they are now dominated by the larger ‘anomalies’ occurring at cold places in high latitudes. The reason for this is obvious, because all extreme seasonal variations in temperature occur in northern continents, with the exception of Antarctica. Increases in anomalies are mainly due to an increase in the minimum winter temperatures, especially near the arctic circle. 

To take an extreme example here is the monthly temperature data and calculated anomalies for Verkoyhansk in Siberia. Annual temperatures vary from -50C in winter to +20C in summer. That is a seasonal range of 70C each year, and a year to year anomaly variation of ~8C is normal. The only global warming effect evident is a slight increase in the minimum winter temperatures since 1900. That is not due to any localised enhanced greenhouse effect but rather to an enhanced meridional heat transport. Temperatures in equatorial regions meanwhile have only ~4C seasonal variations, and show essentially no warming trend.

2. Arctic Surface Stations Records Show Ordinary Warming

Locations of 118 arctic stations examined in this study and compared to observations at 50 European stations whose records averaged 200 years and in a few cases extend to the early 1700s

A recent extensive analysis of Northern surface temperature records gives no support for Arctic “amplification” fears.

The Arctic has warmed at the same rate as Europe over the past two centuries. Heretofore, it has been supposed that any global warming would be amplified in the Arctic. This may still be true if urban heat island effects are responsible for part of the observed temperature increase at European stations. However, European and Arctic temperatures have remained closely synchronized for over 200 years during the rapid growth of urban centres.

And the warming pattern in Europe and the Arctic is familiar and unalarming.

Arctic temperatures have increased during the period 1820– 2014. The warming has been larger in January than in July. Siberia, Alaska and Western Canada appear to have warmed slightly more than Eastern Canada, Greenland, Iceland and Northern Europe. The warming has not occurred at a steady rate. Much of the warming trends found during 1820 to 2014 occurred in the late 1990s, and the data show temperatures levelled off after 2000. The July temperature trend is even slightly negative for the period 1820–1990. The time series exhibit multidecadal temperature fluctuations which have also been found by other temperature reconstructions.

The paper is: Arctic temperature trends from the early nineteenth century to the present W. A. van Wijngaarden, Theoretical & Applied Climatology (2015).  My synopsis: Arctic Warming Unalarming

3. Arctic Warmth Comes from Meridional Heat Transport, not CO2

Key Point: Heat Distribution Changes, not Global Temperatures

Rising CO2 levels modify that radiation imbalance profile slightly. Surface temperatures in the tropics are not really warming at all. Any excess heat induces more clouds and more convection while surface temperatures remain constant. What really happens is that the meridional radiation profile changes. Slightly more heat is transported polewards so that hot places are shifting more heat to cold places which are doing the warming. If CO2 levels stop rising then a new temperature and radiation profile would rather quickly be reached. This is then called ‘climate change’ but any such changes are concentrated in colder regions of the world. The global ‘temperature’ itself is not changing, but instead the global distribution of temperature is changing.

Key Point: More Atmospheric Heat means Warming in the Coldest Places

Temperatures at the poles during 6 months of darkness would fall well below -150C if there was no atmosphere, similar to the moon. Instead heat is constantly being transported from lower latitudes by the atmosphere and ocean and so that temperatures never fall much below -43C. If more heat is transported northwards than previously, then minimum temperatures must rise, and this is what we observe in individual measurements.

Long term changes in temperature anomalies occur mainly in northern continents in winter months. This is not because the earth as a whole is warming up but rather that meridional heat transport from the equator to the poles has increased and the largest effect on ‘anomalies occurs in winter. The average absolute temperature of the earth’s surface is unknown. Basing the evidence for climate change on the 150 year trend in global averaged temperature anomalies still biases the result towards higher latitudes where most of the stations are located.

Summary

When heat is released into the atmosphere from the oceans, it is transported toward the poles to dissipate into space. Places in higher latitudes are warmed, not by radiative effects of greenhouse gases in those locales, but by the incursion of warmer air from the equator.

What happens if more CO2 is added into the atmosphere? No one knows, but there are many opinions, a popular one being that more heat is retained in the atmosphere. But in that case, that additional heat will be shed by the planet in exactly the same manner: transport to the poles with slightly less extremely cold air at the higher latitudes.

Why in the world would we pay anything to prevent a little bit of warming in the world’s coldest places?

Clive Best takes the analysis further and relates to work by Christopher Scotese in a later post Fact: Future Climate Will Be Flatter, not HotterMore explanation at The Climate Water Wheel

Resources:  Bill Gray: H20 is Climate Control Knob, not CO2

No, CO2 Doesn’t Drive the Polar Vortex (Updated)

Quantifying Natural Climate Change

Update September 24, 2022 Richard Lindzen Weighs In

H/T Not A Lot of People Know That

London, 23 September – A prominent climate scientist has warned that the picture of climate change presented in the IPCC’s narrative is simplistic, ill-conceived, and undermined by observational evidence.
In a new 
discussion paper, Professor Richard Lindzen of the Massachusetts Institute of Technology (MIT) points out that the official picture, focusing narrowly on carbon dioxide as a warming agent, becomes implausible when applied to the details of the climate system.  According to Lindzen,

“If you are going to blame everything on carbon dioxide, you have to explain why, on all timescales, temperatures in the tropics are extremely stable while those in high latitudes are much more variable. The IPCC’s story is that small amounts of greenhouse warming near the equator are ‘amplified’ at high latitudes. But neither theory nor data support the idea of amplification.”

Instead, says Lindzen, this pattern – of stable tropical temperatures and fluctuating ones in high latitudes – is mostly a function of natural processes in the atmosphere and oceans; in other words, changes in oceanic and atmospheric currents that transport heat poleward while drawing varying amounts of heat out of the tropics.  These changes in transport affect the tropics, but they are not determined by the tropics.

“The changes in the earth’s so-called temperature are mainly due to changes in the temperature difference between the tropics and the poles – at least for major changes.  The changes in tropical temperature, which are influenced by greenhouse processes, are a minor contribution.”

Richard Lindzen: An assessment of the conventional global warming narrative (pdf)


Antidote for CO2 Hysteria

Preeminent physicist Freeman Dyson (1923-2020) put the CO2 obsession in sharp focus in his foreward to CARBON DIOXIDE  The good news by Indur M. Goklany (2015). Excerpts in italics. with my bolds.

To any unprejudiced person reading this account, the facts should be obvious: that the non-climatic effects of carbon dioxide as a sustainer of wildlife and crop plants are enormously beneficial, that the possibly harmful climatic effects of carbon dioxide have been greatly exaggerated, and that the benefits clearly outweigh the possible damage.

The people who are supposed to be experts and who claim to understand the science are precisely the people who are blind to the evidence. Those of my scientific colleagues who believe the prevailing dogma about carbon dioxide will not find Goklany’s evidence convincing. . .That is to me the central mystery of climate science. It is not a scientific mystery but a human mystery. How does it happen that a whole generation of scientific experts is blind to obvious facts?

Synopsis:  More CO2 Good, Less CO2 Bad

Gregory Wrightstone explains at CO2 Coalition More Carbon Dioxide Is Good, Less Is Bad.  Excerpts in italics with my bolds and added images.

People should be celebrating, not demonizing, modern increases in atmospheric carbon dioxide (CO2). We cannot overstate the importance of the gas. Without it, life doesn’t exist.

First, a bit of history: During each of the last four glacial advances, CO2’s concentration fell below 190 parts per million (ppm), less than 50 percent of our current concentration of 420 ppm. When glaciers began receding about 14,000 years ago – a blink in geological time – CO2 levels fell to 182 ppm, a concentration thought to be the lowest in Earth’s history.

Line of Death

Why is this alarming? Because below 150 ppm, most terrestrial plant life dies. Without plants, there are no animals.

In other words, the Earth came within 30 ppm in CO2’s atmospheric concentration of witnessing the extinction of most land-based plants and all higher terrestrial life-forms – nearly a true climate apocalypse. Before industrialization began adding CO2 to the atmosphere, there was no telling whether the critical 150-ppm threshold wouldn’t be reached during the next glacial period.

Contrary to the mantra that today’s CO2 concentration is unprecedentedly high, our current geologic period, the Quaternary, has seen the lowest average levels of carbon dioxide since the end of the Pre-Cambrian Period more than 600 million years ago. The average CO2 concentration throughout Earth’s history was more than 2,600 ppm, nearly seven times current levels.

Beneficial CO2 Increases

CO2 increased from 280 ppm in 1750 to 420 ppm today, most of it after World War II as industrial activity accelerated. The higher concentration has been beneficial because of the gas’s role as a plant food in increasing photosynthesis.

Its benefits include:

— Faster plant growth with less water and larger crop yields.

— Expansion of forests and grasslands.

— Less erosion of topsoil because of more plant growth.

— Increases in plants’ natural insect repellents.

A summary of 270 laboratory studies covering 83 food crops showed that increasing CO2 concentrations by 300 ppm boosts plant growth by an average of 46 percent. Conversely, many studies show adverse effects of low-CO2 environments.

For instance, one indicated that, compared to today, plant growth was eight percent less in the period before the Industrial Revolution, with a low concentration of 280 ppm CO2.

Therefore, attempts to reduce CO2 concentrations are bad for plants, animals and humankind.

Data reported in a recent paper by Dr. Indur Goklany, and published by the CO2 Coalition, indicates that up to 50 percent of Earth’s vegetated areas became greener between 1982-2011.

Researchers attribute 70 percent of the greening to CO2 fertilization from of fossil fuel emissions. (Another nine percent is attributed to fertilizers derived from fossil fuels.)

Dr. Goklany also reported that the beneficial fertilization effect of CO2 – along with the use of hydrocarbon-dependent machinery, pesticides and fertilizers – have saved at least 20 percent of land area from being converted to agricultural purposes – an area 25 percent larger than North America.

The amazing increase in agricultural productivity, partly the result of more CO2, has allowed the planet to feed eight billion people, compared to the fewer than 800,000 inhabitants living a short 300 years ago.

More CO2 in the air means more moisture in the soil. The major cause of water loss in plants is attributable to transpiration, in which the stomata, or pores, on the undersides of the leaves open to absorb CO2 and expel oxygen and water vapor.

With more CO2, the stomata are open for shorter periods, the leaves lose less water, and more moisture remains in the soil. The associated increase in soil moisture has been linked to global decreases in wildfires, droughts and heat waves.

Exaggeration of CO2’s Warming Effect

Alarm over global warming stems from exaggerations of CO2’s potential to retain heat that otherwise would radiate to outer space. As with water vapor, methane and nitrous oxide, CO2 retains heat in the atmosphere by how it reacts to infrared portions of the electromagnetic spectrum.

However, the gas has saturated to a large extent within the infrared range, leaving relatively little potential for increased warming.

Both sides of the climate debate agree that the warming effect of each molecule of CO2 decreases significantly (logarithmically) as the concentration increases.

This is one reason why there was no runaway greenhouse warming when CO2 concentrations approached 20 times that of today. This inconvenient fact, despite its importance, is rarely mentioned because it undermines the theory of a future climate catastrophe.

A doubling of CO2 from today’s level of 420 ppm – an increase estimated to take 200 years to attain – would have an inconsequential effect on global temperature.

Pennsylvania’s solar-powered fossil fuels

CO2 being liberated today from Pennsylvania coal was removed from the atmosphere by the photosynthesis of trees that fed on sunlight and carbon dioxide and then died to have their remains accumulate in the vast coal swamps of the Carboniferous Period.

Pennsylvania Marcellus and Utica shale hydrocarbons being exploited today were also the likely hydrocarbon source of shallower reservoirs producing since the late 1800s.

The source of those hydrocarbons was algae remains that gathered on the bottom of the Ordovician and Devonian seas.

Like the coal deposits, the algae used solar-powered photosynthesis and CO2 (the algal blooms were likely fueled by regular dust storms) to remove vast amounts of CO2 from the air and lock it up as carbon-rich organic matter.

The provenance of these hydrocarbons spawns two novel ideas. First, there is a strong case that these are solar-powered fuels.

Second, the sequestering of carbon during the creation of the hydrocarbons lowered atmospheric concentrations of CO2 to sub-optimum levels for plants. Therefore, the combustion of today’s coal and gas is liberating valuable CO2 molecules that are turbocharging plant growth.

The plain fact of the matter is that the modest warming of less than one degree Celsius since 1900, combined with increasing CO2, is allowing ecosystems to thrive and humanity to prosper.

Additional information on CO2’s benefits and related topics are available at CO2Coalition.org, which includes a number of publications and resources of interest.

Forget Reason and Science, It’s “Global Boiling” Now

Christopher Lingle explains in his AIER article “Global Boiling”: An Assault On Reason and Science.  Excerpts in italics with my bolds and added images.

An interesting and troubling double standard is applied to the acceptability of individual actions and those of political agents. An individual declaring an emergency when none exists, e.g., shouting “fire” in a crowded cinema, would lead to rightful punishment, yet public officials can do so without attracting the same scrutiny.

According to United Nations Secretary-General António Guterres, “the era of global warming has ended” and “the era of global boiling has arrived.” Of course, this statement was made with little or no sense of perspective or the possibility that any sensible human would challenge or refute it.

This comment is the latest reference relating to what is and has been going on with the weather and climate. After the warming showed a slowdown; climate change became the operative term, but this was found to be insufficiently alarming.

In turn, climate action became the necessary antidote to a “climate emergency” or “climate crisis.” Having gone full circle, with the focus back to the fetish with high temperatures during a seasonal, localized and predictable heatwave, the assertion is that we are in the midst of climate boiling.

Even with no knowledge of science, per se, recipe books point out that “boiling” occurs when water is heated to 212º Fahrenheit (100º Celsius) at sea level. For his part, it may be that the UN Boss knows that water will boil at lower temperatures at higher elevations, but he is unlikely to have been at such altitudes in his native Portugal to observe a boiling point close to recent global averages.

Although it is common for references regarding current weather to be over-stated, it does not necessarily indicate changes or trends in climatic conditions. Besides the notion of “boiling” temperatures, headlines that suggest current temperatures are “scorching” or “scalding” indicate a misunderstanding of what those terms mean.

It might be that using fear and pandering to ignorance is better than coercion to impose a narrative. Persuasion in search of cooperative arrangements is surely what should be expected of a liberal, representative democracy, but this is threatened just as much by “Left” as well as “Right” populism.  It turns out the use of extreme terms in the climate debate is not about either exaggeration or hyperbole, since exaggeration or hyperbole requires there be an element of truth in statements.

Terms used to express the effect of high temperatures on the human body
are misleading, disingenuous, and factually untrue.

Ginning up fear is a well-known technique of propaganda to support a narrative, as is the case of reports of momentary weather conditions as though they presage eventual or irrevocable climatic changes. An example of how an isolated weather event is portrayed as if it were evidence of a generalized view of overall conditions can be seen in a recent report on National Public Radio.

Noting the measurements of a single water temperature sensor in Manatee Bay, near the Everglades National Park, reached 101.1 degrees, the data were declared to be “startling” as if they reflected high average temperatures in the Florida Bay area. It went on to declare that “scorching” temperatures “could” pose a major risk to coral and other marine life.

It is noteworthy that the word “could” in this context has no real content since such conditional expressions provide no insight into or substantiation of the likelihood of the referred event. Supporters of this narrative expect most citizens to be uncurious and to willingly accept assertions of political officials for the purpose of misleading or frightening them, so they submit to whatever remedial public policies are imposed.

In all events, there was no data to support the claim of “startling” water conditions in the rest of Florida Bay. Further, the claim that the temperatures are “scorching” is confusing, at best, since injury from water burns is commonly known as scalding.

Concerning scalding, second degree burns can occur from exposure for 3 seconds to water of 140°F, while a third degree burn requires at least 5 seconds of exposure at same temperature. As it is, the temperature of sea water measured from a single buoy off the Florida coast far from those temperatures and is variable over the course of 24 hours, up to 10 degrees less at night.

Of course, the heat in the ambient air is also far away from what would be “boiling” or “scorching” temperatures. But it turns out that there is no “settled science” on the maximum ambient temperatures that will cause heat distress.

In fact, more is known about the effect of low ambient temperatures on the human body. If the temperature falls below the lower limit, 82.4º Fahrenheit (28º Celsius), more energy is used to hold internal temperature at the optimum, and if temperatures are too low, shivering occurs causing involuntary muscular contractions to generate heat.

Thermoregulation of body temperature is necessary to sustain human life and survival of human cells to thrive rather than to overheat or die. The human body engages in homeostasis to maintain balance by keeping core internal temperature within a safe range, no matter what temperatures are outside the body, otherwise organ failures might occur.

Results of research conducted at the University of Roehampton indicates ambient temperatures exceeding 104º Fahrenheit (40º Celsius) might cause some humans to be unable to shed excessive heat so that body functions become abnormal. It points out that there is a “thermoneutral” zone of temperatures within which the body has no need to increase metabolic rate or use more energy to achieve the normal core temperature of 98.6º Fahrenheit (37º Celsius).

While high temperatures can impact cardiovascular health (e.g., during heatwaves or while fighting fires), it is not a matter of climate change. Blood clotting (i.e., thrombogenesis) can occur from exposure to long and uninterrupted exposure to extreme heat, but it depends on individuals’ physical characteristics and conditions.

Of course, few people are exposed to extremely high temperatures for lengthy periods,
and if so, there are many evasive actions they can undertake to protect themselves.

In all events, it is widely known that the biggest killer from extreme temperatures is from exposure in the low ranges of thermometer readings, even in Africa and Asia.

On the left, Lancet stretched the heat axis to make the numbers look larger in their presentation.

Unfortunately, the promotion of the “climate narrative” has been successful in inducing citizens to ignore how their liberties and rights are in jeopardy from the imposition of repressive public policies that are being answered as a solution. While Germans are being subjected to adopt expensive heat pumps, Americans are beingchided for using gas ranges and the likelihood they might be banned from future installation.

Alas, citizens have lost sight of the original intent behind the move from autocratic monarchy to democracy, which was to secure the rights of all citizens and support private property as the basis for human liberty and personal dignity.

Gas stoves just the thin end of the wedge.

While the American republic was founded to put a brake on political power and limit arbitrary rule, democracy is now presented as an “all-or-nothing” game such that any curbs on democratic governance will lead to its disappearance.

Most recently, governments around the world have found that frightening their citizens would induce them to accept, even applaud, repressive policies in exchange for the promise that individual citizens would be shielded from a single virus. The loss of rights and freedom in response to the fear conjured up during the COVID-19 pandemic is a harbinger of what will be claimed as necessary to avert the existential threat to humanity from extreme weather and changing climate.


Ocean Warming Mystery: Two Natural Factors

Many have seen the media news splash of ocean warming.  For example, from Washington Post Scientists are baffled why the oceans are warming so fast.  The image above comes from that article, excerpts below with my added bolds.

A steady and remarkable rise in average global ocean temperatures this year is now outpacing anything seen in four decades of satellite observations, causing many scientists to suddenly blare alarm over the risks and realities of climate change. But even those typically aligned on climate science can’t agree on what, exactly, triggered such rapid warming and how alarmed they should be.

Some climate researchers suspect that a drastic reduction in air pollution from ships has allowed more sunlight to radiate into oceans, a conclusion others vigorously criticize. Meteorologists also say a weakening of Atlantic winds may be encouraging warming; normally these winds help cool waters and carry sun-blocking plumes of Saharan dust.

Scientists nonetheless agree on this: Conditions are ever ripening for extreme heat waves, droughts, floods and storms, all of which have proven links to ocean warming.

In the Pacific Ocean, warming temperatures are to be expected during El Niño — its impacts on weather around the world stem from warmer-than-normal surface waters along the equatorial Pacific. But the extreme warmth extends beyond the Pacific. Record warmth is also occurring in the equatorial and northern Atlantic — and in the tropics, where hurricanes form.

“This is totally bonkers and people who look at this stuff routinely can’t believe their eyes,” Brian McNoldy, a hurricane researcher at the University of Miami, wrote on Twitter. “Something very weird is happening.”

Antarctic sea ice concentration on June 27, 2023, with white representing solid ice and dark blue representing open ocean. The median ice edge for 1981–2010 is drawn in orange. (Credit: Map by NOAA Climate.gov, based on data from the National Snow and Ice Data Center)

And of course there is the added warning about Antarctic sea ice not freezing as rapidly as usual in SH winter.  The media always refers to “climate change” as the causal factor, which is code for rising CO2 and humans to blame.  For a more reasonable discussion, see Antarctic Sea Ice Varies, It’s Complicated.

What About Natural Factors?

Because the power, glory and money comes from CO2 hysteria and taking over the energy industry, the theories are all about the atmosphere.  Realists know that Oceans Make Climate, and look for more direct means by which sea temperatures can warm.

The HadSST4 AMO dataset was finally updated and showed dramatic 2023 warming in the North Atlantic. Let’s consider two possibilities.

1.  The Ocean Warming Could Be Bottom Up

An article from CICOS explains the importance of hydrothermal action on the ocean floor.  Excerpts in italics with my bolds and added images.  Scientists Discover Three New Hydrothermal Vent Fields on Mid-Atlantic Ridge

An international team of scientists led by CICOES researcher David Butterfield
work together to rapidly find and explore large hydrothermal vents
on the world’s longest mountain range.

Sometimes Mid-Atlantic ridge is called the “40,000-mile Volcano”

Scientists have discovered three new hydrothermal vent fields over a 434-mile-long stretch of the Mid-Atlantic Ridge during the first scientific expedition aboard Schmidt Ocean Institute’s recently launched research vessel Falkor (too).

The multidisciplinary science team representing 11 institutions from the United States, Canada, and France used advanced ocean technologies to make the discovery. Scientists used autonomous and remotely operated underwater vehicles resulting in 65 square miles (170 square kilometers) of seafloor mapped at one-meter scale resolution, an area approximately the size of Manhattan Island.

The discovery of the active hydrothermal vents is the first on this section of the world’s longest underwater mountain range, the Mid-Atlantic Ridge, in more than 40 years. One of the discovered vent fields was located at the Puy des Folles volcano and has five active sites over 6.95 square miles (18 square kilometers). High-temperature ‘black smoker’ vents were also found at the Grappe Deux vent system and Kane Fracture Zone.

This discovery of new hydrothermal vents under the Atlantic ocean reminds of hundreds of thousands of sea mounts active on the ocean floor, with a high concentration in the North Atlantic  For a more complete discussion of bottom up ocean warming, See Post:

Overview: Seafloor Eruptions and Ocean Warming


2. It May Be the Aftermath of Hunga Tonga Eruption 2022

Khaykin et al. (2023) explan the climate impact in their article Global perturbation of stratospheric water and aerosol burden by Hunga eruption.  Excerpts in italics with my bolds.

The eruption of the submarine Hunga volcano in January 2022 was associated with a powerful blast that injected volcanic material to altitudes up to 58 km. From a combination of various types of satellite and ground-based observations supported by transport modeling, we show evidence for an unprecedented increase in the global stratospheric water mass by 13% relative to climatological levels, and a 5-fold increase of stratospheric aerosol load, the highest in the last three decades. Owing to the extreme injection altitude, the volcanic plume circumnavigated the Earth in only 1 week and dispersed nearly pole-to-pole in three months.The unique nature and magnitude of the global stratospheric perturbation by the Hunga eruption ranks it among the most remarkable climatic events in the modern observation era, with a range of potential long-lasting repercussions for stratospheric composition and climate.

The perturbation of stratospheric water vapour burden by 13% is tremendous and has no frame of comparison in the entire observation record dating back to 1985. As there are no efficient sinks of water vapour in the stratosphere, this perturbation is expected to last over several years. Indeed, in 9 months since the eruption, the water vapour mass anomaly has gradually decreased only by 2.5% (4.3 ± 0.1% annual rate), which should lead to the perturbation timescale of over 3 years, assuming the further linear decay trend. The persistent stratospheric moist anomaly may lead to changes in atmospheric radiative balance; stratospheric dynamics as well as amplification of the polar ozone depletion through wider occurrence of polar stratospheric clouds. The ability to assess the longer-term impacts of the HT eruption on stratospheric chemistry will depend strongly on the quality and availability of global satellite observations such as MLS in the coming years.

In addition to blasting seawater to the stratosphere, the event shook the ocean floor worldwide.  

The massive volcanic blast in the Pacific last year was felt 18,000km away on the other side of the world, on the floor of the Atlantic Ocean.  The cataclysmic eruption of Hunga-Tonga Hunga-Ha’apai on 15 January 2022 sent pressure waves through Earth’s atmosphere that connected with the sea surface and triggered 50 highly sensitive seismometers placed 5,000m under water on the seabed.  It was one of a number of intriguing phenomena picked up by the instrument network in the Azores-Madeira-Canary Islands region. Source:  BBC

Summary

Let’s stop pretending we can alter nature by spending trillions of dollars “fighting climate change.”  Better to solve actual problems we are causing and can fix, rather than obsessing over imaginary ones.


Antarctica Heat Hype

Jennifer Marohasy throws cold water on heat hype in her Spectator Australia article Warming in Antarctica? Only using ‘creative’ statistics.  Excerpts in italics with my bolds and added images.

Much has been written in the tabloids, and repeated by the fashionable, about it being very hot through June – even in Antarctica. Really, I wondered. Is Antarctica melting?

The Australian Bureau of Meteorology has measured air temperatures at the Mawson weather station in Antarctica since early 1954 – this is one of the longest continuous surface temperature records for that part of the world. The Russians did not establish the more famous and isolated Vostok weather station until 1957. The satellite temperature record doesn’t begin until 1979.

Automatic weather station (AWS) near Mawson. Photo: John Burgess

The Bureau makes very few adjustments to the temperatures as measured at Mawson that oscillate within a band of some few degrees – mostly below freezing. These same temperatures show no statistically significant long-term warming trend, at least not since 1954. There are longer proxy temperature series, based on ice core records, and they show an overall cooling trend, considering the last 1,900 years. Here, again, I am referring to data from published studies, for example, the temperatures of East and West Antarctica were reconstructed by a team led by Barbara Stenni including scientists from the Australian Antarctic Division, British Antarctic Survey, and Russian Antarctic Research Institute. It is only remodelled proxy series that show warming over this same period.

Last month (June 2023), Antarctica was reported as ‘hot’ in various publications including Vox.com. It’s even hot in Antarctica, where it’s winter.  Yet the average maximum temperature for Mawson was minus 12.6 degrees Celsius, which is not quite as cold as the long-term June average for all years since 1954 which is minus 13.5 C. When the June maximum temperatures for Mawson are ranked highest to lowest, June 2023 comes in as the 29th hottest, and 42nd coldest – suggesting temperatures in Antarctica were not particularly newsworthy and rather cold.

Yet the tabloids, and fashionable, are claiming June 2023 as hot – even in Antarctica. It is all nonsense.

Some of these claims have their origin in the University of Maine’s Climate Reanalyzer, a tool that uses satellite data and computer simulations. So, they represent a remodelled average. Indeed, there is not a single place where anyone, can measure the average temperature of the Earth – or Antarctica. Rather, when it is announced that it is the hottest it has ever been, reference is made to a statistic.

This average temperature is necessarily a number
that has been derived from other numbers.

There will perhaps have been some measuring done here and there, and then some adjusting, and then some adding up and some adjusting again. This is how it is with the calculation of regional and global average temperatures – whether from satellites, tree rings, ice cores, or thermometers. To be sure, every year we are told it is getting hotter, and back in the late 1980s, this was achieved for the globally averaged thermometer record by dropping out some of the colder weather stations. This had the effect of increasing the overall average global temperature, at a time when temperatures at many individual sites were dipping somewhat.

Those who have followed the politics of measuring temperatures may also remember the infamous line in the Climategate emails, whereby the globally averaged temperatures based on tree rings, which also show a decline after 1980, are ‘corrected’ by substituting the globally averaged temperature from thermometer records – never mind that the dip in that record had already been ‘corrected’ by removing data from a great many high latitude Canadian and Russian weather stations.

Drawing from this sordid history of calculating global and regional temperatures, I can think of a large number of ways that the University of Maine’s Climate Reanalyzer could possibly generate a higher-than-average temperature for Antarctica and especially the Earth. Indeed, the larger the geographic area covered, the more opportunity for creative accounting, for which corporates using similar techniques would go to jail, while climate scientists are more usually promoted.

The solution is to perhaps give up on believing the nonsense news headlines, especially when there is no reference to a specific weather station, like Mawson. Or do away with a random selection of weather stations and focus instead on a simple index based on a good sample of well-sited weather stations with long histories, like Mawson.

Such a concept could be based on the Dow Jones Averages or the S&P 500. No one ever tries establishing an impossible-to-define ‘average stock price’ — including many stocks of doubtful provenance — and nobody cares. Rather the solution is to have a pre-selected index of certain representative stocks, that are then followed over a long-time span. So why not have an index of agreed weather stations?

The only problem is, the tabloids and the fashionable, might then have nothing to talk about – should they limit reporting to the same weather stations and with temperatures reliably measured, which will require some modification to current methods and of course, no subsequent adjusting.

There may be no catastrophe to report at least not when it comes to weather as a measure of climate, for which the lack of reliable measures, and the great number of potentially creative solutions, are currently being exploited over and over to justify rather large expenditures on all manner of things.


Watts Up With Warming and CO2

Anthony Watts has a short and to the point video entitled The True Relationship of CO2 and Temperature That the Media Won’t Tell You.  For those who prefer reading I provide below a transcript in italics, lightly edited from the closed captions, along with images and my bolds.  H/T  Geo Rublik

Climate change is in fact real. Climate has changed on the earth for millennia. Okay that’s just the natural order of things–climate is not static in any way shape or form. Let’s start with that.

The first point is: Yes, carbon dioxide does have an effect.

However it is down on the lower side of things, almost minuscule. The reason is the fact that we have reached saturation of the effect of carbon dioxide on warming the atmosphere. It happens in the first 100 parts per million and then after that it’s a logarithmic scale. The effect flattens out at the top, and we’re very nearly at the top of the curve of the effect of carbon dioxide warming the planet. The ability for additional carbon dioxide to affect the temperature is is quickly diminishing to become flat.

This mod trend calculation shows exactly what I’m talking about. In the first hundred parts per million, it’s just a rapid increase. And then it tapers off more and more. So the idea of climate running away due to carbon dioxide isn’t going to happen. So yes carbon dioxide does have an effect which gets smaller as the amount of concentration of co2 gets larger.

The second point is what I brought up in my surface station project.

Namely, that we are retaining more and more heat in our local areas due to increased infrastructure, increased concrete, asphalt and so forth. So are locales are retaining heat at night. And the more artificial structures and surfaces we have in the vicinity of the thermometer, the more it warms the temperature at night, it doesn’t get as cold.

Well the climate folks track climate change per se using the average temperature. That average temperature is obtained by averaging between the daily high and the low. So if the low goes up and the high stays the same. then the average is going to go up. That’s the result showing a warming planet, mostly based on the nighttime temperature going up.  [Note the dotted red line for daytime averages changes little compared to the rise of nightime averages shown by blue dotted line.]

That’s due both to carbon dioxide retarding heat going to space and
because we’ve got more localized influences of infrastructure retaining heat
which affects the thermometers. it’s just that simple.

Addendum

Thirdly, there has also been man made warming of the temperature record by making adjustments to the observations.

There’s a third point Anthony didn’t raise, but I will. There has also been man made warming of the temperature record by making adjustments to the observations. And those data alterations always serve to increase the warming trend.

The diagram above comes from KNMI showing how repeated adjustments over time added increments of warming to the GISSTemp record. The blue line is the GISS value for January 1910.  The red line is GISS value for January 2000.  The values for both months change many times between the GISS dataset at May 2008 and the same dataset at June 2023.  The effect is to increase the warming (the difference between January 1910 and 2000) from 0.45 C to 0.67 C, due to lowering the 1910 number and increasing the 2000 number.

Dr. Ole Humlum commented: A temperature record which keeps on changing the past hardly can qualify as being correct.

I have also done a study of the records of surface stations rated by Watts’ project as having a #1 rating for siting quality–no urban heat sources nearby. That analysis compared raw data (as reported by the local weather authority) with the adjusted data (reanalyzed before input into climatology models.)  See Updated Review of Temperature Data   which also confirms the problems noted above.

The analysis showed the effect of GHCN adjustments on each of the 23 stations in the sample. The average station was warmed by +0.58 C/Century, from +.18 to +.76, comparing adjusted to unadjusted records. 19 station records were warmed, 6 of them by more than +1 C/century. 4 stations were cooled, most of the total cooling coming at one station, Tallahassee. So for this set of stations, the chance of adjustments producing warming is 19/23 or 83%.  For example, Baker City Oregon