There are many reasons for lacking confidence in pandemic stats, as the article below will explain. From the beginning reports contained an equivocation fallacy, ie. when an argument uses a word or phrase with more than one meaning. Positive tests for the virus, SARS CV2, were presented as though they were cases of people suffering with the disease, Covid19. In fact, many with enough virus to trigger positive had mild or no symptoms, and required no treatment at all–they were not cases of the disease. Then it seems that in some, if not many, jurisdictions the number of positive tests were treated as newly infected persons, even when one individual was tested multiple times.
I am a consultant at a major, regional hospital in Surrey, had agreed to give an interview to an anti lockdown activist in which I would have revealed my identity.
Changed my mind because all staff at all hospitals have been warned that if they make any statements to press/social media we may immediately be suspended without pay. I have a family, dependents.
In my opinion, and that of many of my colleagues, there has been no Covid Pandemic, certainly not in the Surrey region and I have heard from other colleagues this picture is the same throughout the country. Our hospital would normally expect to see around 350,000 out patients a year. Around 95,000 patients are admitted to hospital in a normal year and we would expect to see around a similar figure, perhaps 100,000 patients pass through our A&E [Accident & Emergency] department.
From March to June we would normally expect to see 100,000 out patients, around 30,000 patients admitted, and perhaps 30,000 pass through A&E. This year (and these figures are almost impossible to get hold of) we are over 95% down on all those numbers. In effect, the hospital has been pretty much empty for that entire period.
At the start, staff that questioned this were told that we were being used as ‘redundant’ capacity, kept back for the ‘deluge’ we were told would come. It never did come, and when staff began to question this, comments like, ‘for the greater good’ and to ‘protect the NHS’ came down from above. Now its just along the lines of, ‘Shut up or you don’t get paid’.
Every single test (of the same person) counted as a new case
The few Covid cases that we have had to get repeatedly tested, and every single test counted as a new case. Meaning the figures reported back to ONS/PHE (Office for National Statistics & Public Health England) were almost exponentially inflated. It could be that Covid cases reported by hospitals are between 5 to 10x higher than the real number of cases. There has been no pandemic and this goes a long way to explain why figures for the UK are so much higher than anywhere else in Europe.
They’ve been running empty ambulances during lockdown and are still doing it now. By this I mean ambulances are driving around, with their emergency alert systems active (sirens &/or lights) with no job to go to. When out of public view staff masks come off and distancing is not observed.
Masks are totally ineffective and dangerous
Indeed jokes are made about the measures, and I have heard staff express amazement that despite warnings on packets and at point of sales, telling people masks are totally ineffective and dangerous, the public still buy them, because a politician has told them to.
ALL elective surgery has been cancelled. Non-elective Surgery, this tends to be emergency surgery or that which is deemed urgent has been severely curtailed. People are at best being denied basic medical care and at worst being left to die, in some cases, in much distress and pain.
Staff that are responsible for death certification encouraged where possible to put Covid-19 complications as reason for death, even though the patient may have been asymptomatic and also not even tested for covid, grossly inflating the number of Covid deaths.
Remember Covid-19 itself can not kill. What kills is complications from the virus, typically pneumonia like symptoms.
These complications are in reality incredibly rare but have featured in a large amount of death certificates issued in recent months. As long as Covid-19 appears on a death certificate, that death is counted as Covid-19 in the figures released by the ONS and PHE.
Many death certificates (appear to) have been fraudulently completed
I genuinely believe that many death certificates, especially amongst the older 65+ demographic have been fraudulently completed so as to be counted as Covid-19 deaths when in reality Covid-19 complications did not cause the death.
There have been Thursday nights when I stood, alone in my office and cried as I heard people cheering and clapping outside. It sickens me to see all the ‘Thank You NHS’ signs up everywhere and the stolen rainbow that for me now says one word and word only; fear.
There are many good people in the NHS and whilst I do not plead forgiveness for myself, I do plead for them. Most are on low pay, they joined for the right reasons and I did and have been bullied and threatened that if they don’t ‘stay on message’ they don’t eat. I know that if a way could be found to assure staff within the NHS of safety against reprisals, there would be a tsunami of whistleblowers which I have no doubt would help end this complete and brutal insanity.
I am finding it increasingly hard to live with what I have been involved in and I am sorry this has happened.
To end, I would simply say this. Politicians haven’t changed, the country has just made a fatal mistake and started trusting them without question.
The dumpster fire of COVID predictions has shown exactly why it’s important to sustain and nurture skeptics, lest we blunder into scientific monoculture and groupthink. And yet the explosion of “cancel culture” intolerance of any opinion that doesn’t fit a shrinking “3 x 5 card” of right-think risks destroying the very tolerance and science that sustains our civilization.
Since World War II, America has suffered two respiratory pandemics comparable to COVID-19: the 1958 “Asian flu,” then the 1969 “Hong Kong flu.” In neither case did we shut down the economy—people were simply more careful. Not all that careful, of course—Jimi Hendrix was playing at Woodstock in the middle of the 1969 pandemic, and social distancing wasn’t really a thing in the “Summer of Love.”
And yet COVID-19 was very different thanks to a single “buggy mess” of a computer prediction from one Neil Ferguson, a British epidemiologist given to hysterical overestimates of deaths, from mad cow to bird flu to H1N1.
For COVID-19, Ferguson predicted 3 million deaths in America unless we basically shut down the economy. Panicked policymakers took his prediction as gospel, dressed as it was in the cloak of science.
Now, long after governments plunged half the world into a Great Depression, those panicked revisions are being quietly revised down by an order of magnitude, now suggesting a final tally comparable to 1958 and 1969.
COVID-19 would have been a deadly pandemic with or without Ferguson’s fantasies, but had we known the true scale and parameters of the threat we might have chosen better tailored means to both safeguard the elderly and at-risk, while sustaining the wider economy. After all, economists have long known that mass unemployment and widespread bankruptcies carry enormous health consequences that are very real to the victims suffering drained life savings, ruined businesses, broken families, widespread mental and physical health deterioration, even suicide. Decisions involve tradeoffs.
COVID-19 has illustrated the importance of free and robust inquiry. After all, panicked politicians facing media accusations of “killing grandma” aren’t in a very good position to evaluate these tradeoffs, and they need intellectual ammunition. Not only to show them which path is best, but to bolster them when a left-wing media establishment attacks.
Moreover, voters need this ammunition so they can actually tell the politicians what to do. This means two things: debate that is transparent, and debate that is tolerant of skeptics.
Transparency means data and computer code open to public scrutiny as the minimum requirement for any study that is used to justify policy, from lockdowns to carbon taxes to whatever comes next. These studies must be based on verifiable facts, code that does what it says it does, and the ensuing decision-making process must be transparent and open to the public.
One former Indian bureaucrat put it well: “Emergency situations like this pandemic should require a far higher—and not lower—level of scrutiny,” since policy choices have such tremendous impact. “This suggests a need for democracies to strengthen their critical thinking capacity by creating an independent ‘Black Hat’ institution whose purpose would be to question any technical foundations of government decisions.”
Even more important than transparency, debate must be tolerant of alternative opinions. This means ideas that are wrong, offensive, even dangerous, have to be tolerated, even celebrated. By all means, refute them—most alternative hypotheses are completely wrong, so it shouldn’t be hard to simply refute them without censorship. This, after all, is the essence of science—to generate hypotheses testable by anybody, not just licensed “experts.”
Whether we are faced with a new crisis, a new policy innovation, or simply designing a better mousetrap, groupthink and censorship are recipes for disaster and stagnation, while transparency and tolerance of new ideas are the very essence of progress. Indeed, it is largely this scientific tolerance that allowed us to rise up from the long, brutal darkness of poverty.
As Francis Bacon observed three hundred years ago, innovation and new knowledge do not come from prestigious “learned” insiders, rather progress comes from the questioner, the tinkerer, the skeptic.
Indeed, every major scientific advance challenged the “settled science” of its day, and was often denounced as pernicious and false, even dangerous. The modern blood transfusion, for example, was developed in the late 1600s, then banned for nearly a century by a hostile medical establishment, “canceling” tens of millions of lives at the altar of groupthink and hostility to skeptics.
It’s comforting to know that our problems are old ones, and also encouraging that our solution is both time-tested and simple: transparency and tolerance. After all, the very reason our culture elevates science is because it is built on a millennia-long evolutionary “battle of ideas” in which theories are constantly tested and retested in a delightfully endless search for ever better understanding.
This implies there is no such thing as “settled science”—the phrase itself is contrary to the scientific method. In reality, science is not some billion-dollar gleaming palace in Bethesda, rather it’s a gnarled mutant sewer rat that takes all comers because it’s been burned, cut, run over, crushed, run through the wood chipper, and survived. That ugly beast is our salvation, not the gleaming palace where we bow down to whichever random guy has the biggest degree in the room.
Only with free inquiry for the most unpopular, offensive, dangerous, and, yes, wrong ideas imaginable does that power sustain. And if we break that, we can expect a series of rapid catastrophes that, like failed golden ages of the past, return us to the nasty, brutish, and very short lives that have been humanity’s norm.
Whether pandemic, climate change, “institutional racism,” or whatever new crisis they conjure next, we have a fundamental right to tenaciously defend the transparency and tolerance that constitutes science itself so that it remains among humanity’s crowning achievements, and so that we preserve this golden age that would astound our ancestors.
The lead author worked at Special Pathogens Branch, Division of Viral and Rickettsial Diseases, Centers for Disease Control and Prevention, 1600 Clifton Road, Atlanta, Georgia, 30333, USA. Virology Journal is a publication of the National Institutes of Health, which Anthony Fauci joined in 1968 and since 1984 he has directed the National Institute of Allergy and Infectious Diseases. (NIAID).
Severe acute respiratory syndrome (SARS) is caused by a newly discovered coronavirus (SARS-CoV). No effective prophylactic or post-exposure therapy is currently available.
We report, however, that chloroquine has strong antiviral effects on SARS-CoV infection of primate cells. These inhibitory effects are observed when the cells are treated with the drug either before or after exposure to the virus, suggesting both prophylactic and therapeutic advantage. In addition to the well-known functions of chloroquine such as elevations of endosomal pH, the drug appears to interfere with terminal glycosylation of the cellular receptor, angiotensin-converting enzyme 2. This may negatively influence the virus-receptor binding and abrogate the infection, with further ramifications by the elevation of vesicular pH, resulting in the inhibition of infection and spread of SARS CoV at clinically admissible concentrations.
The infectivity of coronaviruses other than SARS-CoV are also affected by chloroquine, as exemplified by the human CoV-229E [15]. The inhibitory effects observed on SARS-CoV infectivity and cell spread occurred in the presence of 1–10 μM chloroquine, which are plasma concentrations achievable during the prophylaxis and treatment of malaria (varying from 1.6–12.5 μM) [26] and hence are well tolerated by patients. It recently was speculated that chloroquine might be effective against SARS and the authors suggested that this compound might block the production of TNFα, IL6, or IFNγ [15]. Our data provide evidence for the possibility of using the well-established drug chloroquine in the clinical management of SARS.
Conclusions
Chloroquine, a relatively safe, effective and cheap drug used for treating many human diseases including malaria, amoebiosis and human immunodeficiency virus is effective in inhibiting the infection and spread of SARS CoV in cell culture. The fact that the drug has significant inhibitory antiviral effect when the susceptible cells were treated either prior to or after infection suggests a possible prophylactic and therapeutic use.
This means, of course, that Dr. Fauci has known for 15 years that chloroquine and it’s even milder derivative hydroxychloroquine (HCQ) will not only treat a current case of coronavirus (“therapeutic”) but prevent future cases (“prophylactic”). So HCQ functions as both a cure and a vaccine. In other words, it’s a wonder drug for coronavirus. Said Dr. Fauci’s NIH in 2005, “concentrations of 10 μM completely abolished SARS-CoV infection.” Fauci’s researchers add, “chloroquine can effectively reduce the establishment of infection and spread of SARS-CoV.”
In connection with the SARS outbreak – caused by a coronavirus dubbed SARS- CoV – the NIH researched chloroquine and concluded that it was effective at stopping the SARS coronavirus in its tracks. The COVID-19 bug is likewise a coronavirus, labeled SARS-CoV-2. While not exactly the same virus as SARS-CoV-1, it is genetically related to it, and shares 79% of its genome, as the name SARS-CoV-2 implies. They both use the same host cell receptor, which is what viruses use to gain entry to the cell and infect the victim.
The evidence is mounting from frontline caregivers dealing with Covid19 patients. Previous posts provide examples of HCQ treatment along with other proven medicines (eg. Azithromycin) and supplements (eg. Zinc, vitamins C and D). Summarized in the chart above is the role of HCQ+ according to the progression of the disease Covid19.
HCQ Prevents Covid19
The first column on the left is sometimes called PrEP, or pre-exposure to the virus SARS CV2. Now we are getting studies confirming that HCQ plays an important prophylactic role in blocking the virus from taking hold when someone is infected. The Times of India June 19, 2020, article is HCQ beneficial as preventive drug: SMS doctors told ICMR. Excerpts in italics with my bolds
JAIPUR: Sawai Man Singh Hospital was the first to use hydroxychloroquine (HCQ) and anti-HIV drugs — Lopinavir and Ritonavir — to treat the first few Covid-19 patients besides using the combination as a preventive drug on others.
More than 4,300 healthcare workers including doctors and nurses have been given HCQ to help them prevent the infection as there are high chances of them getting infected while treating Covid patients.
“As far as prophylaxis is concerned, more than 4,300 doctors and health works were given HCQ as approved by Indian Council of Medical Research (ICMR) out of which around 45 health persons tested positive and recovered later,” said Dr Sudhir Bhandari, principal and controller, SMS Medical College.
The hospital claimed that preventive treatment approach at SMS Hospital has been very rewarding and results of these have been shared with ICMR.
“We have used these drugs with perfect scientific background and proven efficacy in SARS Cov-2 Infection and SMS Medical College created a bridge between point of no specific treatment till the specific drug treatment is established. All these drugs were part of solidarity trial by WHO of which SMS Hospital is a centre,” said Bhandari.
SMS Hospital was declared as non-Covid hospital on June 1. But before that, it emerged as a role model of management of Covid patients. From the very beginning, 300 ICU beds and more than thousand IPD beds were dedicated for Covid patients. A separate Covid OPD and observation wards for suspects was created at Charak Bhawan. Also, 28 wards were created for Covid patients of different categories. For critically ill patients, Infectious Disease Hospital (IDH) was fully equipped with ICU facilities.
During the peak of the pandemic, average 500 plus patients were admitted to SMS from asymptomatic category to severe category.
Number of faculty was put on floor duty, which included consultants from the department of medicine and anaesthesia. Resident doctors were doing duty in each shift and hundreds of nursing, paramedics and technicians were on round-the-clock duty.
Only studies comparing a group of COVID19 patients treated with a chloroquine derivative to a control group without chloroquine derivatives were included. Non-comparative (single arm) studies and studies comparing two groups treated with chloroquine derivatives at different dosages or with different delay of treatment were excluded. Studies were classified as “big data” studies when conducted on electronic medical records extracted by public health specialists and epidemiologists who did not care COVID106 19 patients themselves. Conversely, studies were classified as “clinical studies” when mentioning details of treatments (dosages, duration, contraindications, monitoring…) and conducted by authors physicians (infectious diseases and internal medicine specialists, and pulmonologists) who cared for COVID-19 patients themselves.
Twenty studies were identified involving 105,040 patients (19,270 treated patients) from nine countries (Brazil, China, France, Iran, Saudi Arabia, South Korea, Spain, and USA). Big data observational studies were associated with conflict of interest, lack of treatment dosage and duration, and absence of favorable outcome. Clinical studies were associated with favorable outcomes and details on therapy. Among clinical studies, three of four randomized controlled trials reported a significant favorable effect.
Among clinical studies, a significant favorable summary effect was observed for duration of cough (Odds ratio (OR), 0.19, p = .00003), duration of fever (0.11, p = .039), clinical cure (0.21, p = .0495), death (0.32, p = 4.1×10⁻⁶) and viral shedding (0.43, p = .031). A trend for a favorable effect was noted for the outcome “death and/or ICU transfer” (0.29, p = .069) with a point estimate remarkably similar to that observed for death (∼0.3). In conclusion, a meta-analysis of publicly available clinical reports demonstrates that chloroquine derivatives are effective to improve clinical and virological outcomes but, more importantly, it reduces mortality by a factor 3 in patients infected with COVID-19.
All “big data” studies reported a lack of beneficial effect of the treatment and were significantly more likely associated with “Cons” variable (5/5 vs 3/15, p = .004). This was also observed by examination of the meta-analysis forest plot (Figure 2, Table S3 to S8). In addition, both “conflicts of interest” (p = .01) and “not described treatment protocol” variables (p = .004) were associated with “Cons” variable. Conversely, clinical studies were more likely to report a favorable effect of chloroquine derivatives in COVID-19 patients (p <.05). Consistently, clinical studies with detailed treatment protocol were more likely associated with the observation of a favorable effect of the treatment (p < .05).
In the big data analyses, 4 comparisons reported a significant effect, and all were deleterious (4/4). In the clinical studies, 17 comparisons reported a significant effect, and all were beneficial.
A Henry Ford Health System study shows the controversial anti-malaria drug hydroxychloroquine helps lower the death rate of COVID-19 patients, the Detroit-based health system said Thursday.
Officials with the Michigan health system said the study found the drug “significantly” decreased the death rate of patients involved in the analysis.
The study analyzed 2,541 patients hospitalized among the system’s six hospitals between March 10 and May 2 and found 13% of those treated with hydroxychloroquine died while 26% of those who did not receive the drug died.
Among all the patients in the study, there was an overall in-hospital mortality rate of 18%, and many who died had underlying conditions, the hospital system said. Globally, the mortality rate for hospitalized patients is between 10% and 30%, and 58% among those in the ICU or on a ventilator.
“As doctors and scientists, we look to the data for insight,” said Steven Kalkanis, CEO of the Henry Ford Medical Group. “And the data here is clear that there was a benefit to using the drug as a treatment for sick, hospitalized patients.”
The national immunity task force has started testing thousands of blood samples for COVID-19 antibodies. (Darryl Dyck/The Canadian Press)
There’s a right way and a wrong way to go about this The USA demonstrates the wrong way, which is to conflate current cases of infection with numbers of people who recovered from a past infection. Of course there is political power to be gained by scaring the citizenry into tolerating dictatorial behavior from elected officials or to sway presidential voting. Let’s hope that this Canadian effort stays on track as described in the research design. The CBC article is 1st glimpse of Canada’s true COVID-19 infection rate expected mid-July from immunity testing. Excerpts in italics with my bolds
Results elsewhere suggest infection rate higher than number of confirmed case
The national immunity task force has started testing thousands of blood samples for COVID-19 antibodies and should be able to produce a more detailed picture of how many Canadians have been infected with the novel coronavirus within a couple of weeks.
It will be much longer, however, before we know more about what kind of protection against future infection having the antibodies provides, said Dr. Timothy Evans, executive director of the COVID-19 Immunity Task Force.
Plus, he said, most of the people whose blood is being tested will not be informed of the results because of how the blood is being collected for testing.
“There won’t be an opportunity for individuals to find out their status,” said Evans, who is also director of the McGill School of Population and Global Health in Montreal.
More than 105,000 Canadians have tested positive for COVID-19 since the coronavirus infection was identified in Canada in late January, while many others were sick but couldn’t get tested because provinces were limiting who could access the procedure until just a few weeks ago.
Evans also said a significant number of people get the infection and show no symptoms and will have no clue they were ever sick. Immunity testing in other countries has suggested the actual infection rate is 10 to 20 times more than the number of confirmed cases, he said.
There are multiple prongs to the task force’s plan to figure out the true infection rate here, starting with running antibody tests on 40,000 samples collected from people who donated blood to Canadian Blood Services and Hema Quebec since May. Evans said about 1,600 of those samples are being run through the test kits every day now, and analyses are already underway on the results.
“Hopefully within the next two weeks, we will have an initial first number,” he said.
The first results will reveal how many samples showed antibodies but will include no specifics, such as whether they are male or female or where they live.
“By the end of the month of July, we expect to have a more broken-down picture of what we call the seroprevalence, the presence of antibodies in the blood, that will look at it by age group and geographic location,” Evans said.
Evans said Canadian Blood Services can’t trace back the samples to the actual patients who gave them, so positive antibody tests will not be reported back for anyone who donated blood outside of Quebec. He said Hema Quebec said it might be possible to identify the patients but hasn’t yet decided if it will do so.
Another testing program is now beginning on 25,000 blood samples taken from pregnant women, using blood routinely drawn during the first trimester to screen for sexually transmitted infections and check for immunity to other illnesses, such as rubella. COVID-19 antibody testing will be added to that list for all pregnant women in Canada going back to December. The women will be informed if they test positive for COVID-19 antibodies, Evans said.
Evans said there are also about 30,000 blood samples held in provincial labs that are being tested for antibodies.
Together, he said, these projects can provide a piecemeal picture of the infection rate across the country, though it won’t be a truly representative sample until a national household survey can be run. That isn’t going to happen until the portable antibody tests become reliable, but a plan is being developed with Statistics Canada so it’s ready when the tests are.
“We’d love to have a test that didn’t require a formal blood draw, but rather a pin prick, but we’re not quite there yet,” Evans said. “There’s some things on the horizon. We’re trying to get those validated quickly, but we still haven’t got what I would call a good portable test that could be used in the home.”
The tests the task force is using now require only a small amount of blood — less than 1/20th of a teaspoon, generally — but it is still more than what comes from a finger prick.
Evans said understanding how many people got infected can help drive policy decisions about where to vaccinate first and the impact specific public health measures might have had in some settings like long-term care centres, hospitals and schools, or communities that have been hit particularly hard.
The task force also has a two-year mandate to try to look at what kind of protection someone has from having antibodies, as well as how long the levels of antibodies last in a person’s blood. Evans said those studies are just getting underway and will take time, including looking to see whether people who have the antibodies get infected during a second or third wave of the pandemic.
A Henry Ford Health System study shows the controversial anti-malaria drug hydroxychloroquine helps lower the death rate of COVID-19 patients, the Detroit-based health system said Thursday.
Officials with the Michigan health system said the study found the drug “significantly” decreased the death rate of patients involved in the analysis.
The study analyzed 2,541 patients hospitalized among the system’s six hospitals between March 10 and May 2 and found 13% of those treated with hydroxychloroquine died while 26% of those who did not receive the drug died.
Among all the patients in the study, there was an overall in-hospital mortality rate of 18%, and many who died had underlying conditions, the hospital system said. Globally, the mortality rate for hospitalized patients is between 10% and 30%, and 58% among those in the ICU or on a ventilator.
“As doctors and scientists, we look to the data for insight,” said Steven Kalkanis, CEO of the Henry Ford Medical Group. “And the data here is clear that there was a benefit to using the drug as a treatment for sick, hospitalized patients.”
A previous study by French doctors considered the efficacy of HCQ along with other widely available drugs during the several stages of Covid19. The Michigan study shows benefits for people hospitalized in phases II and III. The French study emphasized early use during phase I at onset of testing positive for SARS CV2.
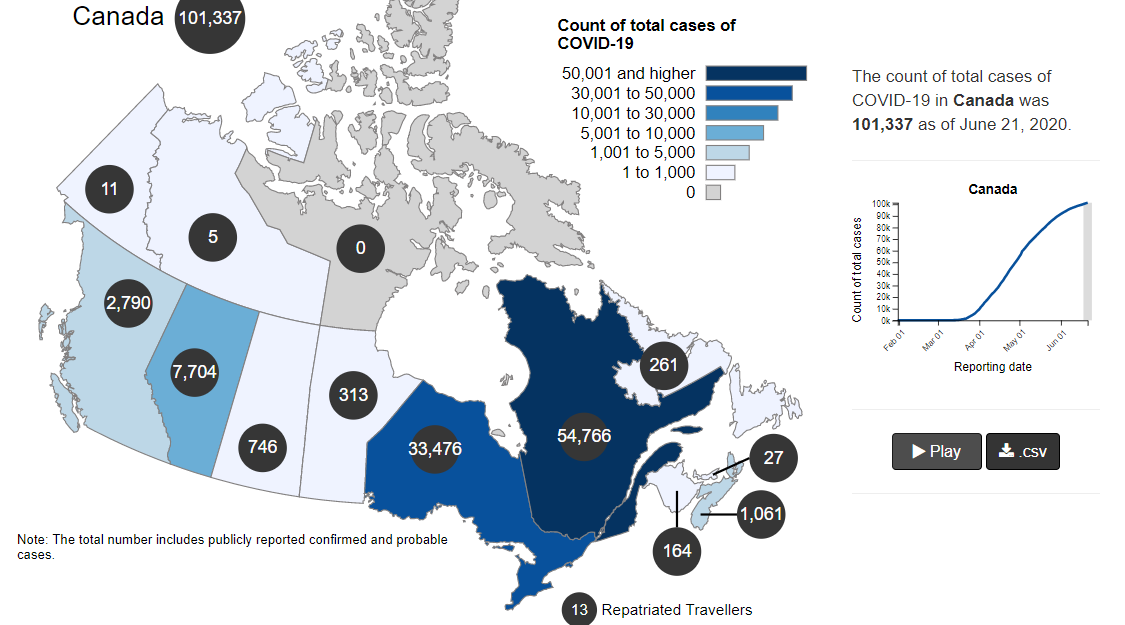
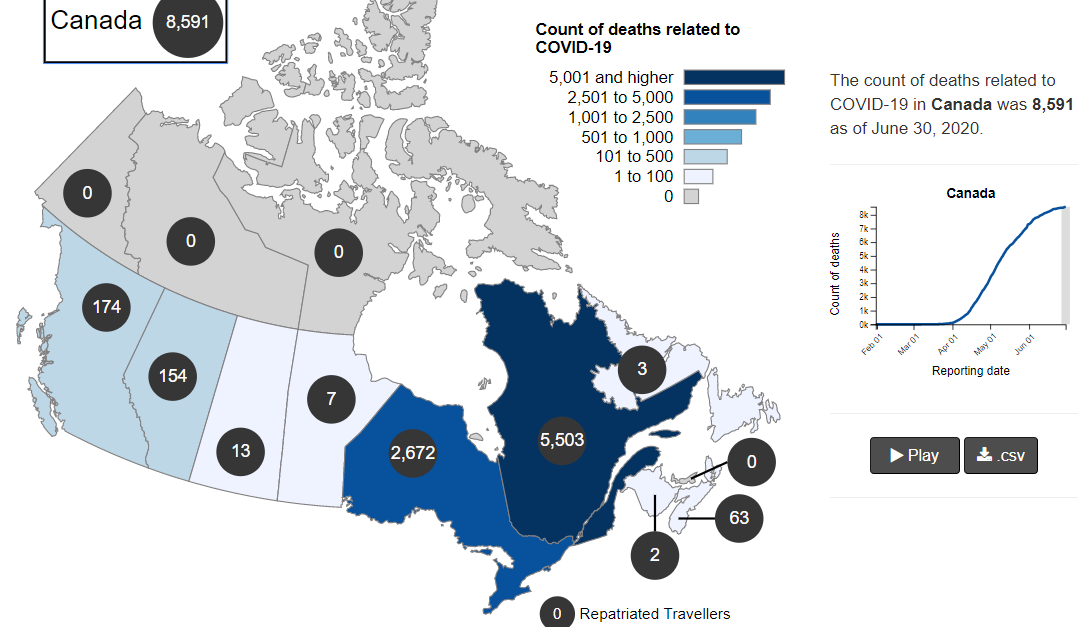
The map shows that in Canada 8591 deaths have been attributed to Covid19, meaning people who died having tested positive for SARS CV2 virus. This number accumulated over a period of 132 days starting January 31. The daily death rate reached a peak of 177 on May 6, 2020, and is down to 20 as of yesterday. More details on this below, but first the summary picture. (Note: 2019 is the latest demographic report)
Canada Pop
Ann Deaths
Daily Deaths
Risk per Person
2019
37589262
330786
906
0.8800%
Covid 2020
37589262
8591
65
0.0228%
Over the epidemic months, the average Covid daily death rate amounted to 7% of the All Causes death rate. During this time a Canadian had an average risk of 1 in 5000 of dying with SARS CV2 versus a 1 in 114 chance of dying regardless of that infection. As shown later below the risk varied greatly with age, much lower for younger, healthier people.
Background Updated from Previous Post
In reporting on Covid19 pandemic, governments have provided information intended to frighten the public into compliance with orders constraining freedom of movement and activity. For example, the above map of the Canadian experience is all cumulative, and the curve will continue upward as long as cases can be found and deaths attributed. As shown below, we can work around this myopia by calculating the daily differentials, and then averaging newly reported cases and deaths by seven days to smooth out lumps in the data processing by institutions.
A second major deficiency is lack of reporting of recoveries, including people infected and not requiring hospitalization or, in many cases, without professional diagnosis or treatment. The only recoveries presently to be found are limited statistics on patients released from hospital. The only way to get at the scale of recoveries is to subtract deaths from cases, considering survivors to be in recovery or cured. Comparing such numbers involves the delay between infection, symptoms and death. Herein lies another issue of terminology: a positive test for the SARS CV2 virus is reported as a case of the disease COVID19. In fact, an unknown number of people have been infected without symptoms, and many with very mild discomfort.
For this discussion let’s assume that anyone reported as dying from COVD19 tested positive for the virus at some point prior. A recent article by Nic Lewis at Climate Etc. referred to evidence that the average time from infection to symptoms is 5.1 days, and from symptoms to death 18.8 days. A separate issue, of course, is that 95+% of those dying had one or more co-morbidities contributing to the patient’s demise. Setting aside the issue of dying with/from Covid19, it is reasonable to assume that 24 days after testing positive for the virus, survivors can be considered recoveries.
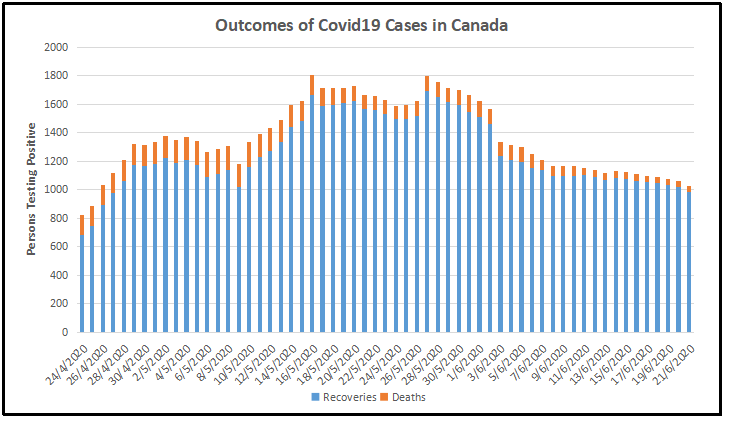
Recoveries are calculated as cases minus deaths with a lag of 24 days. Daily cases and deaths are averages of the seven days ending on the stated date. Recoveries are # of cases from 24 days earlier minus # of daily deaths on the stated date. Since both testing and reports of Covid deaths were sketchy in the beginning, this graph begins with daily deaths as of April 24, 2020 compared to cases reported on March 31, 2020. Another view of the data is shown below.
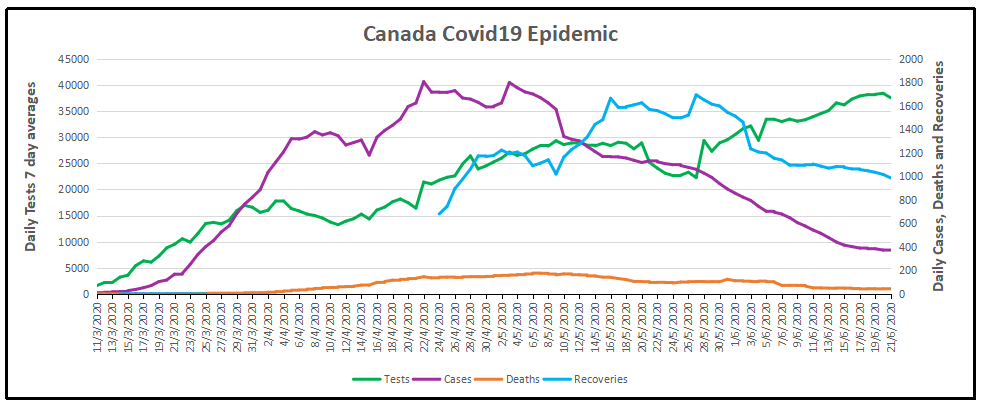
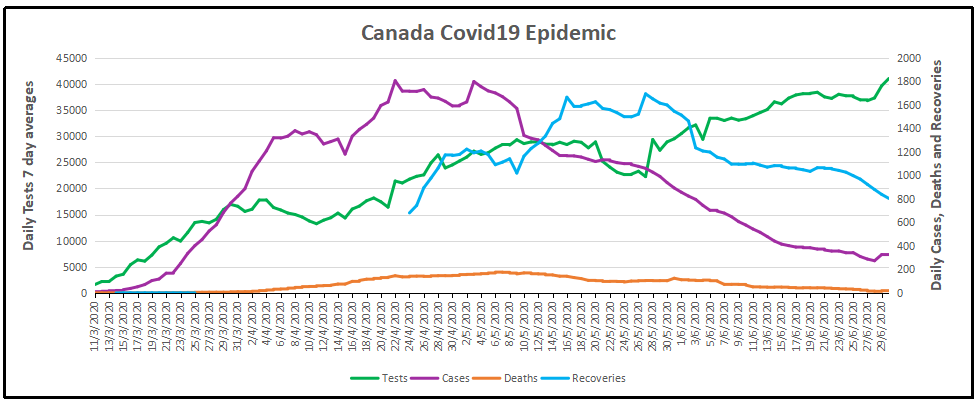
The scale of testing has increased and has now reached 40,000 a day, while positive tests (cases) are dwindling. The shape of the recovery curve resembles the case curve lagged by 24 days, since death rates are a small portion of cases. The recovery rate has grown from 83% to 98% steady over the last 5 days. This approximation surely understates the number of those infected with SAR CV2 who are healthy afterwards, since antibody studies show infection rates multiples higher than confirmed positive tests. In absolute terms, cases are now down to 320 a day and deaths 20 a day, while estimates of recoveries are 804 a day.
Summary of Canada Covid Epidemic
It took a lot of work, but I was able to produce something akin to the Dutch advice to their citizens.
The media and governmental reports focus on total accumulated numbers which are big enough to scare people to do as they are told. In the absence of contextual comparisons, citizens have difficulty answering the main (perhaps only) question on their minds: What are my chances of catching Covid19 and dying from it? The map shows a lot of cases, and the chart looks like an hockey stick, going upward on a straight line. So why do I say canadians are safer than it looks like from such images?
By showing daily tests, new cases and reported deaths, we can see how the outbreak has built up, peaked and declined over the last 3 months. The green line shows how testing steadily grew up to a daily rate of 40,000 (all numbers are smoothed with 7 day averages ending with the stated date.) Note that the curve is now descending after peaking at 1800 on April 22, now down to 320 new cases per day. This lower rate of infections is despite the highest rate of testing since the outbreak began. Deaths have also peaked at 177 on May 6, down to 20 on June 30. The percentage of people testing positive is down to 3.8%, and deaths are 0.31% of the tests administered.
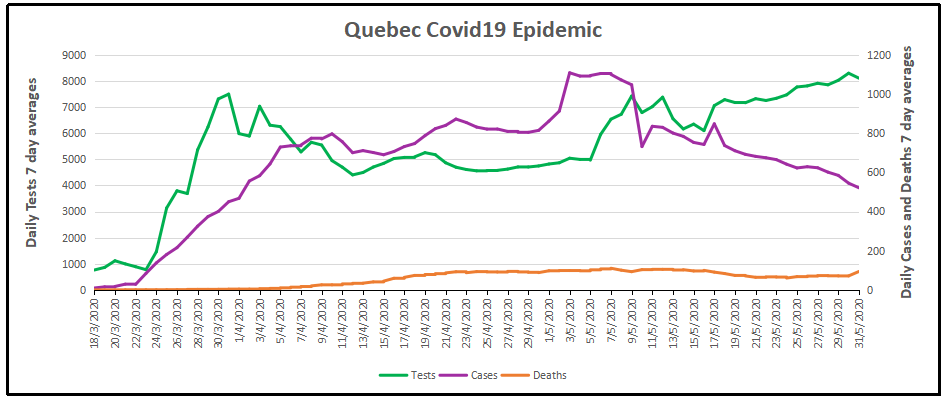
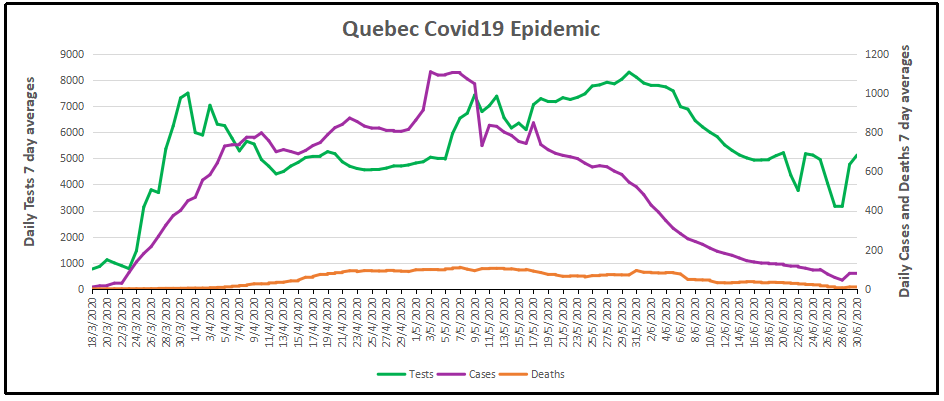
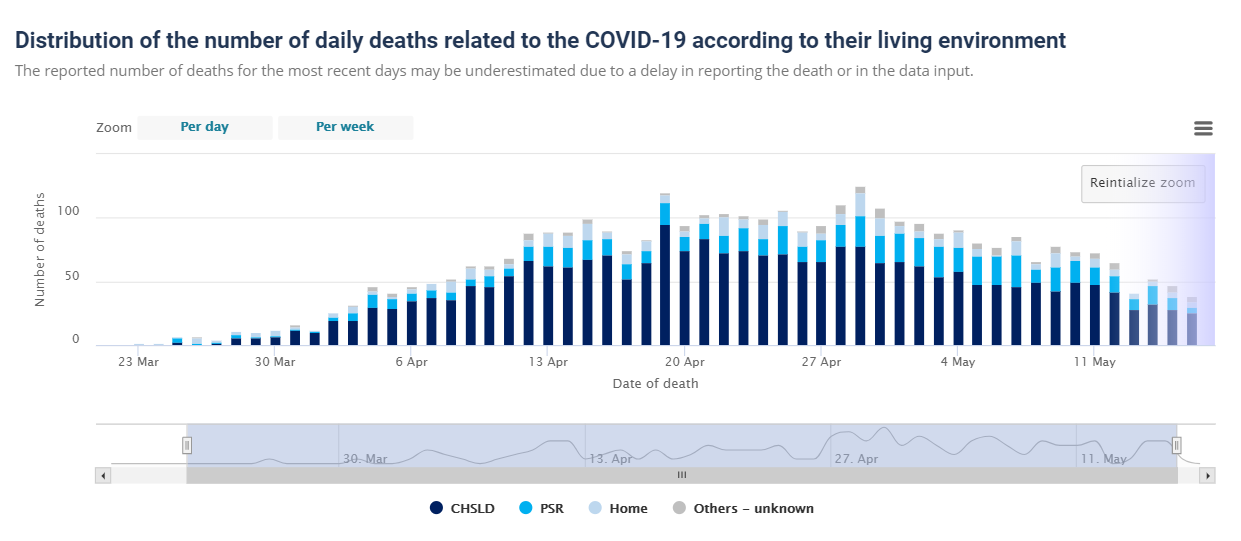
But it matters greatly where in Canada you live. In the map at the top, Quebec is the dark blue province leading the nation in both cases and deaths. Quebec has always celebrated being a distinct society, but not in this way. Below is the same chart for the Quebec epidemic from the same dataset. The province has about 23% of the national population and does about 26% of the tests. But Quebec contributed 56% of the cases and 64% of the deaths, as of yesterday. Here how the outbreak has gone in La Belle Province.
The Quebec graph is more lumpy showing cases peaking May 1-9, including several days inflated by data catchups. Cases have dropped off recently, from 1100 May 7 down to 82 yesterday. Deaths are also slowing, declining from 110 on May 7 to 11 on June 30. The animation below shows the epidemic in Canada with and without Quebec statistics.
But clearly everywhere else in Canada, people are much safer than those living in Quebec. So what is going on?
To enlarge image, open in new tab.
The graph shows that people in Quebec are dying in group homes, the majority in CHSLD (long term medical care facilities) and also in PSR (private seniors’ residences). The huge majority of Quebecers in other, more typical living arrangements have very little chance of dying from this disease. Not even prisoners are much at risk.
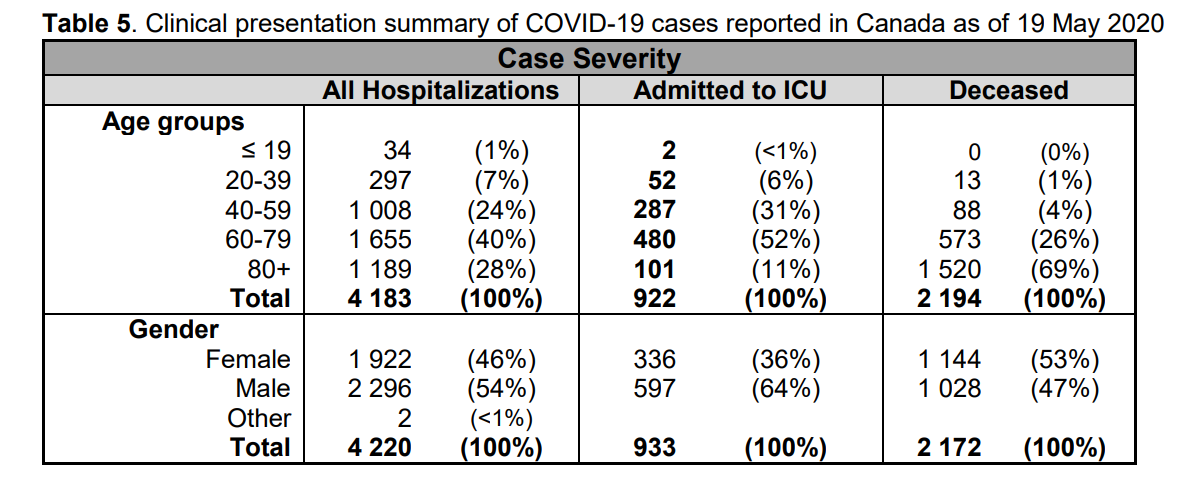
Of course the other dimension is years of age, since this disease has punished mostly people suffering from end-of-life frailties. A previous post reported that the Netherlands parliament was provided with the type of guidance everyone wants to see.
The table presents only those cases with a full clinical documentation, which included some 2194 deaths compared to the 5842 total reported. The numbers show that under 60 years old, few adults and almost no children have anything to fear.
Update May 20, 2020
It is really quite difficult to find cases and deaths broken down by age groups. For Canadian national statistics, I resorted to a report from Ontario to get the age distributions, since that province provides 69% of the cases outside of Quebec and 87% of the deaths. Applying those proportions across Canada results in this table. For Canada as a whole nation:
Age
Risk of Test +
Risk of Death
Population per 1 CV death
<20
0.05%
None
NA
20-39
0.20%
0.000%
431817
40-59
0.25%
0.002%
42273
60-79
0.20%
0.020%
4984
80+
0.76%
0.251%
398
In the worst case, if you are a Canadian aged more than 80 years, you have a 1 in 400 chance of dying from Covid19. If you are 60 to 80 years old, your odds are 1 in 5000. Younger than that, it’s only slightly higher than winning (or in this case, losing the lottery).
As noted above Quebec provides the bulk of cases and deaths in Canada, and also reports age distribution more precisely, The numbers in the table below show risks for Quebecers.
Age
Risk of Test +
Risk of Death
Population per 1 CV death
0-9 yrs
0.13%
0
NA
10-19 yrs
0.21%
0
NA
20-29 yrs
0.50%
0.000%
289,647
30-39
0.51%
0.001%
152,009
40-49 years
0.63%
0.001%
73,342
50-59 years
0.53%
0.005%
21,087
60-69 years
0.37%
0.021%
4,778
70-79 years
0.52%
0.094%
1,069
80-89
1.78%
0.469%
213
90 +
5.19%
1.608%
62
While some of the risk factors are higher in the viral hotspot of Quebec, it is still the case that under 80 years of age, your chances of dying from Covid 19 are better than 1 in 1000, and much better the younger you are.
In past weeks there have been anecdotal reports from frontline doctors that patients who would have been flattened fighting off SARS CV2 in April are now sitting up and recovering in a few days. We have also the statistical evidence in the US and Sweden, as two examples, that case numbers are rising while Covid deaths continue declining. One explanation is that the new cases are younger people who have been released from lockdown (in US) with stronger immune systems. But it may also be that the virus itself is losing potency.
Contrary to the narrative that is being pushed by the mainstream that the COVID 19 virus was the result of a natural mutation and that it was transmitted to humans from bats via pangolins, Dr Luc Montagnier the man who discovered the HIV virus back in 1983 disagrees and is saying that the virus was man made.
Professor Luc Montagnier, 2008 Nobel Prize winner for Medicine, claims that SARS-CoV-2 is a manipulated virus that was accidentally released from a laboratory in Wuhan, China. Chinese researchers are said to have used coronaviruses in their work to develop an AIDS vaccine. HIV RNA fragments are believed to have been found in the SARS-CoV-2 genome.
“With my colleague, bio-mathematician Jean-Claude Perez, we carefully analyzed the description of the genome of this RNA virus,” explains Luc Montagnier, interviewed by Dr Jean-François Lemoine for the daily podcast at Pourquoi Docteur, adding that others have already explored this avenue: Indian researchers have already tried to publish the results of the analyses that showed that this coronavirus genome contained sequences of another virus, … the HIV virus (AIDS virus), but they were forced to withdraw their findings as the pressure from the mainstream was too great.
To insert an HIV sequence into this genome requires molecular tools
In a challenging question Dr Jean-François Lemoine inferred that the coronavirus under investigation may have come from a patient who is otherwise infected with HIV. No, “says Luc Montagnier,” in order to insert an HIV sequence into this genome, molecular tools are needed, and that can only be done in a laboratory.
According to the 2008 Nobel Prize for Medicine, a plausible explanation would be an accident in the Wuhan laboratory. He also added that the purpose of this work was the search for an AIDS vaccine.
In any case, this thesis, defended by Professor Luc Montagnier, has a positive turn.
According to him, the altered elements of this virus are eliminated as it spreads: “Nature does not accept any molecular tinkering, it will eliminate these unnatural changes and even if nothing is done, things will get better, but unfortunately after many deaths.”
This is enough to feed some heated debates! So much so that Professor Montagnier’s statements could also place him in the category of “conspiracy theorists”: “Conspirators are the opposite camp, hiding the truth,” he replies, without wanting to accuse anyone, but hoping that the Chinese will admit to what he believes happened in their laboratory.
To entice a confession from the Chinese he used the example of Iran which after taking full responsibility for accidentally hitting a Ukrainian plane was able to earn the respect of the global community. Hopefully the Chinese will do the right thing he adds. “In any case, the truth always comes out, it is up to the Chinese government to take responsibility.”
Implications: Leaving aside the geopolitics, this theory also explains why the virus weakens when mutations lose the unnatural pieces added in the lab. Since this is an RNA (not DNA) sequence mutations are slower, but inevitable. If correct, this theory works against fears of a second wave of infections. It also gives an unintended benefit from past lockdowns and shutdowns, slowing the rate of infections while the virus degrades itself.
HCQ +AZ Survives Attack from Big Pharma with Growing Results
For background on the bogus big data studies intended to discredit HCQ since it threatens profits from new pharmaceuticals, see: HCQ Hit Job by Big Pharma Data Miners
Our study has a retrospective observational design, and such characteristics may be presented as a limitation of the study [37]. Patients were not enrolled in perfectly homogeneous groups with regards to demographics, chronic conditions and clinical status at admission.
Treatments were not allocated randomly but according to the clinical status of patients and contra-indications to drugs, or preference of patients with regards to therapeutic options. As we have aimed to tests and treat all positive patients presenting to our institution, the patient population comprised a majority of patients with mild diseases and a minority of patients with severe disease, with the former managed at our day-care hospital and the latter as in-patients.
We enrolled all patients including those who started their treatment with delay or stopped it early. Because of the crisis situation we had to face, clinical, virological and radiological data were not documented in 100% patients. However, missing data may also be a limitation of RCT. Furthermore, RCT are not useful in the context of an emerging pandemic when commercially available drugs known to be active in vitro are available for immediate treatment [38,39].
Our approach of early diagnosis and care of as many patients as possible results in much lower mortality rates than other strategies. The test-and-treat strategy adopted in Marseille also seems capable of shortening the duration of the outbreak when compared to data from France overall by identifying infected people and reducing their viral shedding duration.
In fact, more people were tested in Marseille than in most other areas, and the outbreak lasted only 9 weeks. In addition, patients under HCQ-AZ treatment for at least 3 days had a better clinical outcome, based on mortality rates among patients >60 years, less transfer to ICU and shorter length of stay at the hospital, and these patients also had a shorter duration of viral shedding than patients who did not receive this drug combination.
Finally, a global strategy for the management of the COVID-19 outbreak may help to limit both the number of cases and fatalities and guide countries where this pandemic has not yet peaked.
Discussion
We confirm here that COVID-19 has several evolutionary stages (Fig. 4). After the incubation period, the first clinical stage, including LRTI and URTI symptoms, is associated with a high viral load and the occurrence of early lung lesions on LDCT, for which it is reasonable to use a compound with antiviral activity. HCQ-AZ has demonstrated its effectiveness in reducing viral shedding [6] and preventing disease progression and death particularly when prescribed at early stages [10,27,28]. Other antiviral compounds, including remdesivir and hyperimmune gamma globulins [29], may have antiviral activity at an early stage of the disease, although there is to date no convincing published report, comparable to that of oseltamivir at the early stage of influenza [30]. Taking into account the association between low blood zinc levels and poor clinical outcomes, zinc supplementation should be also considered, as recently reported [31]. However, the choice of the best treatment should be made according to its safety profile, which is much better for HCQ-AZ than for remdesivir (adverse events leading to cessation of treatment in 0.3% in our study vs. 12% for remdesivir [12]). Nevertheless, we were surprised by the large discrepancy on efficacy and toxicity of HCQ in recent studies compared to ours [32]. As a matter of fact, all patients reported here have been followed by the physicians authors named in our study. Altogether, we found only 0.67% of QTc prolongations and no death related to treatment. In our opinion, this excellent safety profile of HCQ-AZ in our real-life medical experience much better reflects the reality than registry studies such as those recently retracted from high profile medical journals [9].
Fig. 4. Evolutionary stages of SARS-CoV-2 infection, including major clinical and biological features and possible therapies
The second stage includes both an immune reaction and the persistence of the virus [1]. At this stage, extreme caution should be required for patients with risk factors (particularly hypertension), severe clinical presentation (NEWS CoV ≥ 5), intermediate-to-severe lesions in LDCT and biological parameters such as lymphocytopenia, eosinopenia or D-dimers higher than 0.5 μg/L. Systemic coagulation activation and thrombotic complications were probably overlooked in COVID-19 patients. In our study, the youngest person who died was 60 years old, and the death was associated with generalized thrombosis. A recent study reported that among 198 hospitalized COVID-19 patients, 39 (20%) were diagnosed with venous thromboembolism (VTE), and of these patients 25 (13%) had symptomatic VTE, despite routine thrombosis prophylaxis [33]. The third stage consists of an inflammatory stage linked to pro-inflammatory cytokine release with a high risk of transfer to ICU [34]. Moreover, the strong specific antibody response observed at this stage questions the use of hyperimmune gamma globulins [29]. The fourth stage with acute respiratory distress syndrome (ARDS) is characterised by pulmonary tissue injury and requires supportive intensive care. To date, no drug has proven effective at this stage. While most surviving patients may be definitely cured, an unknown proportion may evolve towards pulmonary fibrosis constituting the late stage of the disease, as described by Chinese physicians caring for COVID-19 patients and as previously described for severe acute respiratory syndrome (SARS) in 2003 [35]. Long-term follow-up aiming to screen for fibrosis will be the next challenge in the management of COVID-19. Our experience and suggestions regarding the various stages of COVID-19 are summarized in Fig. 4.
Lest anyone think this appreciation of HCQ+AZ is limited to France, see these reports, among others:
The hands of frontline medical practitioners have been tied treating Covid19 cases because the drugs that work on the virus work against Big Pharma profits. Computers were employed to produce attack papers overwhelming the growing confidence that HCQ helps patients. A recent paper later on describes how medical science is corrupted to follow the money rather than fight disease.
Context: The Attack Against Medical Practitioners Using HCQ
On May 22, 2020, the time-honoured Lancet[vi]– one of the world’s two top medical journals – published the stunning claim that 671 hospitals on six continents were reporting life-threatening heart rhythms in patients taking hydroxychloroquine (HCQ) for Covid-19.
The headlines that followed were breath-taking.
Although wider access to the drug had recently been urged in a petition signed by nearly 500,000 French doctors and citizens,[vii] WHO and other agencies responded to the article by immediately suspending the clinical trials that may have cleared it for use.
North American headlines did not mention that HCQ has been on the WHO list of essential drugs since the list began in 1977. Nor did they mention an investigative report on the bad press that hydroxychloroquine had been getting prior to May 22, and how financial interests had been intersecting with medicine to favour Gilead’s new, more expensive drug, Remdesivir.[viii]
The statistics behind the headlines
As a Canadian health sciences librarian who delivered statistics to a large public health agency for 25 years, I sensed almost immediately that the article had to be flawed.
Why? Because health statistics are developed for different purposes and in different contexts, causing them to exist in isolated data “stovepipes.”[ix] Many health databases, even within a single region or country, are not standardized and are thus virtually useless for comparative research.
On May 28, an open letter from 200 scientists to the authors and The Lancet requested details of the data and an independent audit. The letter was “signed by clinicians, medical researchers, statisticians, and ethicists from across the world.”[xii]
The authors declined to supply the data, or even the hospital names. Meanwhile, investigative analysis was showing the statistics to be deeply flawed.[xiii][xiv]
If this were not enough, the lead author was found to be in a conflict of interest with HCQ’s rival drug, Remdesivir: In view of the foregoing, the article was retracted by three of its authors on June 5.
How did this fraud get past The Lancet reviewers in the first place?
The answer emerges from what has remained an obscure French interview, although it has been quoted in the alternative media.[xvi]
On May 24, a closed-door Chatham House expert meeting about Covid included the editors-in-chief of The Lancet and the NEJM. Comments regarding the article were leaked to the French press by a well-known health figure, Dr. Philippe Douste-Blazy,[xvii] who felt compelled to blow the whistle.
His resulting BFM TV interview was posted to YouTube with English subtitles on May 31,[xviii] but it was not picked up by the English-speaking media.
These were The Lancet editor Dr. Richard Horton’s words, as reported by Dr. Douste-Blazy:
“If this continues, we are not going to be able to publish any more clinical research data because pharmaceutical companies are so financially powerful today, and are able to use such methodologies as to have us accept papers which are apparently methodologically perfect, but which, in reality, manage to conclude what they want to conclude.” [xix]
Doust-Blazy made his own comments on Horton’s words:
“I never thought the boss of The Lancet could say that. And the boss of the New England Journal of Medicine too. He even said it was ‘criminal’. The word was used by them.”[xx]
The final words in Doust-Blazy’s interview were:
“When there is an outbreak like Covid, in reality, there are people like us – doctors – who see mortality and suffering. And there are people who see dollars. That’s it.”[xxi]
The scientific process of building a trustworthy knowledge base is one of the foundations of our civilization. Violating this process is a crime against both truth and humanity.
Evidently the North American media does not consider this extraordinary crime to be worth reporting.
In the context of a pandemic with an unknown virus, development of new drugs is a major opportunity for “big pharma” industry, and this is potentially associated with a very high risk of conflicts of interest. This led us to consider these conflicts of interest as a moderator variable in the present work. As major financial issues are at stake, and may impact the interpretation of scientific data, we felt it was important to mention that none of us have conflict of interest with any pharmaceutical company.
The following outcomes were considered: hospitalization rate, duration of cough, duration of fever, clinical cure, lymphocyte count, C-reactive protein level, Interleukin-6 level, thoracic CT-scan imaging, aggravation to severe, death, transfer to intensive care unit (ICU), ventilation, length of hospital stay and persistent viral shedding as assessed by PCR.
Only studies comparing a group of COVID19 patients treated with a chloroquine derivative to a control group without chloroquine derivatives were included. Non-comparative (single arm) studies and studies comparing two groups treated with chloroquine derivatives at different dosages or with different delay of treatment were excluded. Studies were classified as “big data” studies when conducted on electronic medical records extracted by public health specialists and epidemiologists who did not care COVID106 19 patients themselves. Conversely, studies were classified as “clinical studies” when mentioning details of treatments (dosages, duration, contraindications, monitoring…) and conducted by authors physicians (infectious diseases and internal medicine specialists, and pulmonologists) who cared for COVID-19 patients themselves.
Twenty studies were identified involving 105,040 patients (19,270 treated patients) from nine countries (Brazil, China, France, Iran, Saudi Arabia, South Korea, Spain, and USA). Big data observational studies were associated with conflict of interest, lack of treatment dosage and duration, and absence of favorable outcome. Clinical studies were associated with favorable outcomes and details on therapy. Among clinical studies, three of four randomized controlled trials reported a significant favorable effect.
Among clinical studies, a significant favorable summary effect was observed for duration of cough (Odds ratio (OR), 0.19, p = .00003), duration of fever (0.11, p = .039), clinical cure (0.21, p = .0495), death (0.32, p = 4.1×10⁻⁶) and viral shedding (0.43, p = .031). A trend for a favorable effect was noted for the outcome “death and/or ICU transfer” (0.29, p = .069) with a point estimate remarkably similar to that observed for death (∼0.3). In conclusion, a meta-analysis of publicly available clinical reports demonstrates that chloroquine derivatives are effective to improve clinical and virological outcomes but, more importantly, it reduces mortality by a factor 3 in patients infected with COVID-19.
All “big data” studies reported a lack of beneficial effect of the treatment and were significantly more likely associated with “Cons” variable (5/5 vs 3/15, p = .004). This was also observed by examination of the meta-analysis forest plot (Figure 2, Table S3 to S8). In addition, both “conflicts of interest” (p = .01) and “not described treatment protocol” variables (p = .004) were associated with “Cons” variable. Conversely, clinical studies were more likely to report a favorable effect of chloroquine derivatives in COVID-19 patients (p <.05). Consistently, clinical studies with detailed treatment protocol were more likely associated with the observation of a favorable effect of the treatment (p < .05).
In the big data analyses, 4 comparisons reported a significant effect, and all were deleterious (4/4). In the clinical studies, 17 comparisons reported a significant effect, and all were beneficial.
The clinical studies used a standardized treatment protocol with methods that included assessment of contraindications, daily dosage, adjuvant measures and duration of treatment with at least 48 hours of treatment before the objective could be assessed. For example, assessment of kalemia and electrocardiogram is critical prior to treatment, especially when the chloroquine derivative is combined with AZ (37). At the same time, we observed that virtual big data studies did not mention these elements and considered the presence of chloroquine derivative prescription in electronic records in a binary fashion. Obviously, the number of patients included in the database analyses was much higher than the number of patients included in the clinical studies, because these databases are made up of thousands of electronic medical records (EMR). As mentioned in the past (4), this type of studies have tremendous statistical power but are limited by clinical inaccuracy that makes their conclusions difficult to believe.
The major elements of this study are that, overall there is an extremely significant difference between the analyses of data not collected directly by the doctors who cared for patients and the studies carried out by the physicians who set up these studies and cared for patients, including the randomized studies. The second thing is that in these studies conducted electronically, the treatment is never really specified, with the dosage and duration of treatment making it impossible to assess efficacy (dose too low) or toxicity (dose too high). In addition to this major bias, we also noted a significant bias when the authors had conflicts of interest due to their relationship with industrialists trying to market molecules in the same therapeutic framework competing with HCQ.
Overall, and as previously published, the relevance of the analysis of important medical data depends on clinical accuracy (4). Indeed, the discrepancy between clinicians and epidemiologists reflects a major trend, that of the analysis of large medical data, with database warehouse more or less well filled by individuals who are not directly included in the work reported. This analysis is unrelated to the observations made by physicians who are in direct contact with patients and which lead to divergent interpretations and opposite conclusions, which are of real interest and show that the world predicted by Baudrillard (39); that of a parallel world of numerical analysis completely disconnected from reality; is being born.
Under these conditions, a meta-analysis allowing for the combination of different studies makes it possible to identify a general trend. This makes it possible to reconcile the chloroquine derivative efficacy that many doctors have perceived with the results of the first published studies. This meta-analysis is based on several studies, including four RCTs, and identifies a favorable trend toward the benefit of chloroquine derivatives in the treatment of COVID-19 patients, enabling us to make a grade I recommendation for its use against the disease.
Footnote: The “parallel world of numerical analysis disconnected from reality” sounds a lot like climate science. We are in a Brave New World where narratives are primary, while facts and data are servants to the agenda. See Climate Science Was Broken
More Bad News for Big Pharma:
Doctors in Italy, Israel and U.S. say the coronavirus may be losing its potency and becoming less deadly even as it spreads. Some wonder if there will be enough cases around when a vaccine becomes available. See Covid Decline in Canada and World June 8
In reporting on Covid19 pandemic, governments have provided information intended to frighten the public into compliance with orders constraining freedom of movement and activity. Statistics of interest to the public have been hidden; for example only cumulative numbers are presented to show ever increasing cases and deaths. For example, the above map of the Canadian experience is all cumulative, and the curve will continue upward as long as cases can be found and deaths attributed. As shown below, we can work around this myopia by calculating the daily differentials, and then averaging newly reported cases and deaths by seven days to smooth out lumps in the data processing by institutions.
A second major deficiency is lack of reporting of recoveries, including people infected and not requiring hospitalization or, in many cases, without professional diagnosis or treatment. The only recoveries presently to be found are limited statistics on patients released from hospital. The only way to get at the scale of recoveries is to subtract deaths from cases, considering survivors to be in recovery or cured. Comparing such numbers involves the delay between infection, symptoms and death. Herein lies another issue of terminology: a positive test for the SARS CV2 virus is reported as a case of the disease COVID19. In fact, an unknown number of people have been infected without symptoms, and many with very mild discomfort.
For this discussion let’s assume that anyone reported as dying from COVD19 tested positive for the virus at some point prior. A recent article by Nic Lewis at Climate Etc. referred to evidence that the average time from infection to symptoms is 5.1 days, and from symptoms to death 18.8 days. A separate issue, of course, is that 95+% of those dying had one or more co-morbidities contributing to the patient’s demise. Setting aside the issue of dying with/from Covid19, it is reasonable to assume that 24 days after testing positive for the virus, survivors can be considered recoveries.
Recoveries are calculated as cases minus deaths with a lag of 24 days. Daily cases and deaths are averages of the seven days ending on the stated date. Recoveries are # of cases from 24 days earlier minus # of daily deaths on the stated date. Since both testing and reports of Covid deaths were sketchy in the beginning, this graph begins with daily deaths as of April 24, 2020 compared to cases reported on May 31, 2020. Another view of the data is shown below.
The scale of testing has increased and is now well above 35,000 a day, while positive tests (cases) are dwindling. The shape of the recovery curve resembles the case curve lagged by 24 days, since death rates are a small portion of cases. The recovery rate has grown from 83% to 96% steady over the last 11 days. This approximation surely understates the number of those infected with SAR CV2 who are healthy afterwards, since antibody studies show infection rates multiples higher than confirmed positive tests. In absolute terms, cases are now down to 364 a day and deaths 41 a day, while estimates of recoveries are 986 a day.
Background from previous post May 31, 2020 It took a lot of work, but I was able to produce something akin to the Dutch advice to their citizens.
The media and governmental reports focus on total accumulated numbers which are big enough to scare people to do as they are told. In the absence of contextual comparisons, citizens have difficulty answering the main (perhaps only) question on their minds: What are my chances of catching Covid19 and dying from it? The map shows a lot of cases, and the chart looks like an hockey stick, going upward on a straight line. So why do I say canadians are safer than it looks like from such images?
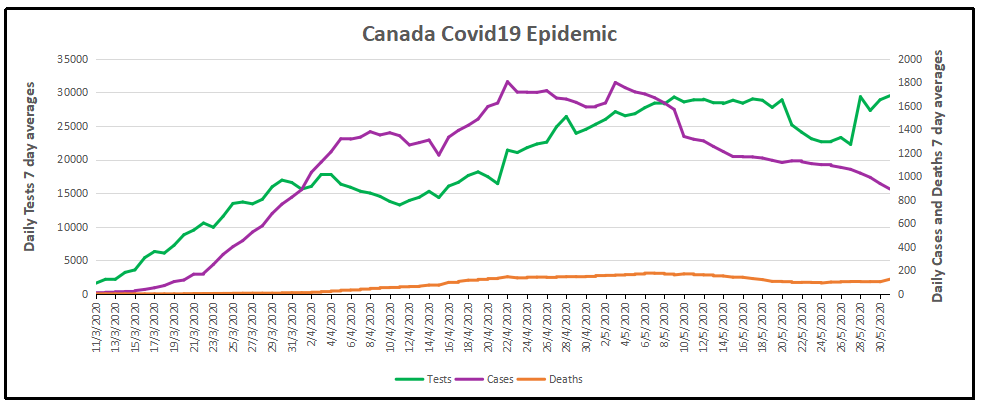
By showing daily tests, new cases and reported deaths, we can see how the outbreak has built up, peaked and declined over the last 2.5 months. The green line shows how testing grew to a sustained daily rate of 29,000, with a recent drop and recovery (all numbers are smoothed with 7 day averages ending with the stated date.) Note that the curve is now descending after peaking at 1800 on April 22, now down to 893 new cases per day. This lower rate of infections is despite the highest rate of testing since the outbreak began. Deaths have also peaked at 177 on May 6, down to 104 May 30. (Reported deaths bumped upward yesterday due to a data transmission catchup in Quebec, explained below). The percentage of people testing positive is down to 3%, and deaths are 0.42% of the tests administered.
But it matters greatly where in Canada you live. In the map at the top, Quebec is the dark blue province leading the nation in both cases and deaths. Quebec has always celebrated being a distinct society, but not in this way. Below is the same chart for the Quebec epidemic from the same dataset. The province has about 23% of the national population and does about 26% of the tests. But Quebec contributes 56% of the cases and 64% of the deaths, as of yesterday. Here how the outbreak has gone in La Belle Province.
The Quebec graph is more lumpy showing cases peaking May 1-9, including several days inflated by data catchups. Cases have dropped off recently, from 1100 May 7 down to 521 yesterday. Deaths are also slowing, declining from 110 on May 7 to 71 May 30. Yesterday the reported deaths in Quebec jumped to 202 due to 165 previously unrecorded data, while the actual new deaths were 37 . The animation below shows the epidemic in Canada with and without Quebec statistics.
But clearly everywhere else in Canada, people are much safer than those living in Quebec. So what is going on?
To enlarge image, open in new tab.
The graph shows that people in Quebec are dying in group homes, the majority in CHSLD (long term medical care facilities) and also in PSR (private seniors’ residences). The huge majority of Quebecers in other, more typical living arrangements have very little chance of dying from this disease. Not even prisoners are much at risk.
Of course the other dimension is years of age, since this disease has punished mostly people suffering from end-of-life frailties. A previous post reported that the Netherlands parliament was provided with the type of guidance everyone wants to see.
The table presents only those cases with a full clinical documentation, which included some 2194 deaths compared to the 5842 total reported. The numbers show that under 60 years old, few adults and almost no children have anything to fear.
Update May 20, 2020
It is really quite difficult to find cases and deaths broken down by age groups. For Canadian national statistics, I resorted to a report from Ontario to get the age distributions, since that province provides 69% of the cases outside of Quebec and 87% of the deaths. Applying those proportions across Canada results in this table. For Canada as a whole nation:
Age
Risk of Test +
Risk of Death
Population per 1 CV death
<20
0.05%
None
NA
20-39
0.20%
0.000%
431817
40-59
0.25%
0.002%
42273
60-79
0.20%
0.020%
4984
80+
0.76%
0.251%
398
In the worst case, if you are a Canadian aged more than 80 years, you have a 1 in 400 chance of dying from Covid19. If you are 60 to 80 years old, your odds are 1 in 5000. Younger than that, it’s only slightly higher than winning (or in this case, losing the lottery).
As noted above Quebec provides the bulk of cases and deaths in Canada, and also reports age distribution more precisely, The numbers in the table below show risks for Quebecers.
Age
Risk of Test +
Risk of Death
Population per 1 CV death
0-9 yrs
0.13%
0
NA
10-19 yrs
0.21%
0
NA
20-29 yrs
0.50%
0.000%
289,647
30-39
0.51%
0.001%
152,009
40-49 years
0.63%
0.001%
73,342
50-59 years
0.53%
0.005%
21,087
60-69 years
0.37%
0.021%
4,778
70-79 years
0.52%
0.094%
1,069
80-89
1.78%
0.469%
213
90 +
5.19%
1.608%
62
While some of the risk factors are higher in the viral hotspot of Quebec, it is still the case that under 80 years of age, your chances of dying from Covid 19 are better than 1 in 1000, and much better the younger you are.


 Published August 22, 2005, in the Virology Journal
 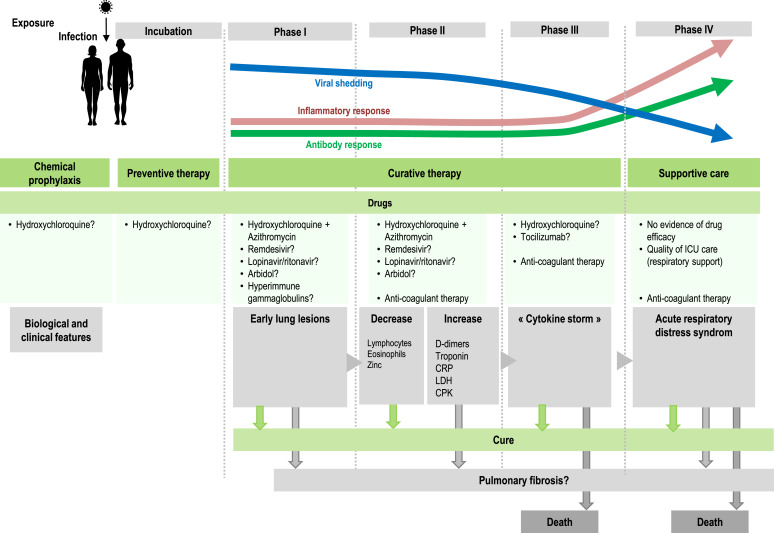 The evidence is mounting from frontline caregivers dealing with Covid19 patients. Previous posts provide examples of HCQ treatment along with other proven medicines (eg. Azithromycin) and supplements (eg. Zinc, vitamins C and D). Summarized in the chart above is the role of HCQ+ according to the progression of the disease Covid19.


 The hands of frontline medical practitioners have been tied treating Covid19 cases because the drugs that work on the virus work against Big Pharma profits. Computers were employed to produce attack papers overwhelming the growing confidence that HCQ helps patients. A recent paper later on describes how medical science is corrupted to follow the money rather than fight disease.