Beliefs and Uncertainty: A Bayesian Primer

Those who follow discussions regarding Global Warming and Climate Change have heard from time to time about the Bayes Theorem. And Bayes is quite topical in many aspects of modern society:
Bayesian statistics “are rippling through everything from physics to cancer research, ecology to psychology,” The New York Times reports. Physicists have proposed Bayesian interpretations of quantum mechanics and Bayesian defenses of string and multiverse theories. Philosophers assert that science as a whole can be viewed as a Bayesian process, and that Bayes can distinguish science from pseudoscience more precisely than falsification, the method popularized by Karl Popper.
Named after its inventor, the 18th-century Presbyterian minister Thomas Bayes, Bayes’ theorem is a method for calculating the validity of beliefs (hypotheses, claims, propositions) based on the best available evidence (observations, data, information). Here’s the most dumbed-down description: Initial belief plus new evidence = new and improved belief. (A fuller and more technical description is below for the more mathematically inclined.)
Now that doesn’t sound so special, but in fact as you will see below, our intuition about probabilities is often misleading. Consider the classic Monty Hall Problem.
The Monty Hall Game is a counter-intuitive statistics puzzle:

There are 3 doors, behind which are two goats and a car.
You pick a door (call it door A). You’re hoping for the car of course.
Monty Hall, the game show host, examines the other doors (B & C) and always opens one of them with a goat (Both doors might have goats; he’ll randomly pick one to open)
Here’s the game: Do you stick with door A (original guess) or switch to the other unopened door? Does it matter?
Surprisingly, the odds aren’t 50-50. If you switch doors you’ll win 2/3 of the time!
Don’t believe it? There’s a Monty Hall game (here) where you can prove it to yourself by experience that your success doubles when you change your choice after Monty eliminates one of the doors. Run the game 100 times either keeping your choice or changing it, and see the result.
The game is really about re-evaluating your decisions as new information emerges. There’s another example regarding race horses here.
The Principle Underlying Bayes Theorem
Like any tool, Bayes method of inference is a two-edged sword, explored in an article by John Horgon in Scientific American (here):
“Bayes’s Theorem: What’s the Big Deal?
Bayes’s theorem, touted as a powerful method for generating knowledge, can also be used to promote superstition and pseudoscience”
Here is my more general statement of that principle: The plausibility of your belief depends on the degree to which your belief–and only your belief–explains the evidence for it. The more alternative explanations there are for the evidence, the less plausible your belief is. That, to me, is the essence of Bayes’ theorem.
“Alternative explanations” can encompass many things. Your evidence might be erroneous, skewed by a malfunctioning instrument, faulty analysis, confirmation bias, even fraud. Your evidence might be sound but explicable by many beliefs, or hypotheses, other than yours.
In other words, there’s nothing magical about Bayes’ theorem. It boils down to the truism that your belief is only as valid as its evidence. If you have good evidence, Bayes’ theorem can yield good results. If your evidence is flimsy, Bayes’ theorem won’t be of much use. Garbage in, garbage out.
Embedded in Bayes’ theorem is a moral message: If you aren’t scrupulous in seeking alternative explanations for your evidence, the evidence will just confirm what you already believe. Scientists often fail to heed this dictum, which helps explains why so many scientific claims turn out to be erroneous. Bayesians claim that their methods can help scientists overcome confirmation bias and produce more reliable results, but I have my doubts.
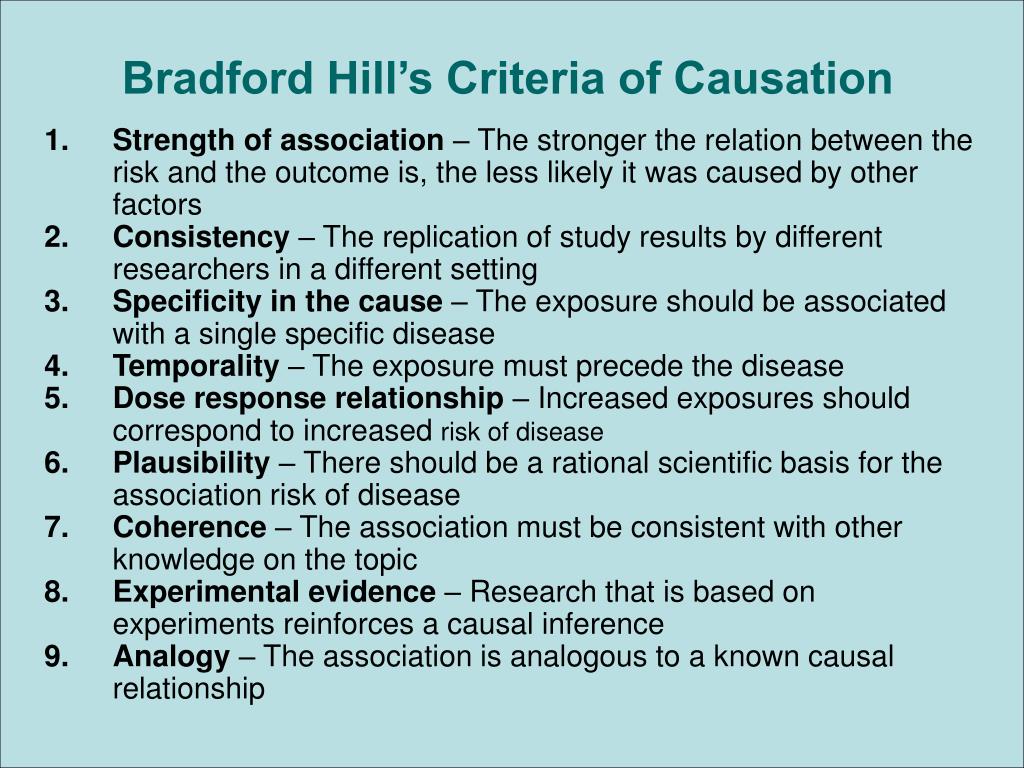
Horgon’s statement comes very close to the legal test articulated by Bradford Hill and widely used by courts to determine causation of liability in relation to products, medical treatments or working conditions.
By way of context Bradford Hill says this:
None of my nine viewpoints can bring indisputable evidence for or against the cause-and-effect hypothesis and none can be required as a sine qua non. What they can do, with greater or less strength, is to help us to make up our minds on the fundamental question – is there any other way of explaining the set of facts before us, is there any other answer equally, or more, likely than cause and effect?
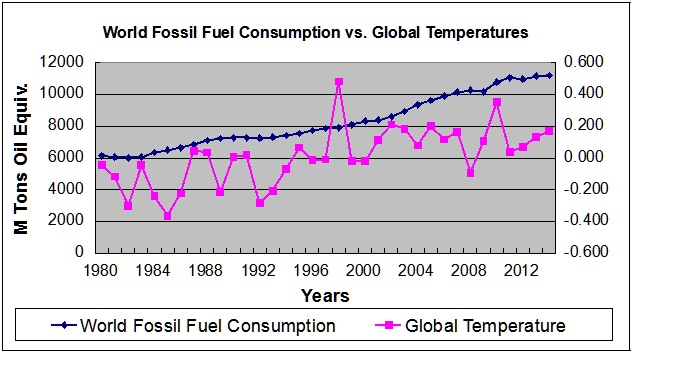
Such is the legal terminology for the “null” hypothesis: As long as there is another equally or more likely explanation for the set of facts, the claimed causation is unproven. For more see the post: Claim: Fossil Fuels Cause Global Warming
Limitations of Bayesian Statistics
From the above it should be clear that Bayesian inferences can be drawn when there are definite outcomes of interest and historical evidence of conditions that are predictive of one outcome or another. For example, my home weather sensor from Oregon Scientific predicts rain whenever air pressure drops significantly because that forecast will be accurate 75% of the time, based on that one condition. The Weather Network will add several other variables and will increase the probability, though maybe not always in predicting the outcomes in my backyard.
When it comes to the response of GMT (Global Mean Temperatures) to increasing CO2 concentrations, or many other climate concerns, we currently lack the historical probabilities because we have yet to untangle the long-term secular trends from the noise of ongoing, normal and natural variability.
Andrew Gelman writes on Bayes statistical methods and says this:
In short, I think Bayesian methods are a great way to do inference within a model, but not in general a good way to assess the probability that a model or hypothesis is true (indeed, I think ‘the probability that a model or a hypothesis is true’ is generally a meaningless statement except as noted in certain narrow albeit important examples).
A Fuller (more technical) Description of Bayes Theorem
The probability that a belief is true given new evidence
equals
the probability that the belief is true regardless of that evidence
times
the probability that the evidence is true given that the belief is true
divided by
the probability that the evidence is true regardless of whether the belief is true.
Got that?
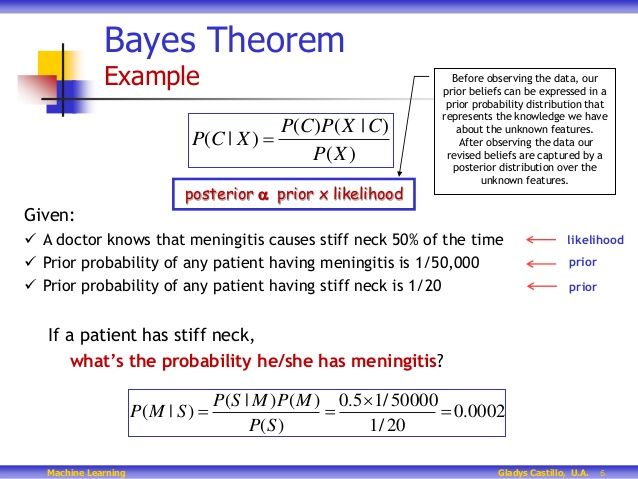
The basic mathematical formula takes this form: P(B|E) = P(B) * P(E|B) / P(E), with P standing for probability, B for belief and E for evidence. P(B) is the probability that B is true, and P(E) is the probability that E is true. P(B|E) means the probability of B if E is true, and P(E|B) is the probability of E if B is true.

The application above shows some important facts to remember about Beliefs and Uncertainties:
Tests are not the event. We have a cancer test, separate from the event of actually having cancer. We have a test for spam, separate from the event of actually having a spam message.
Tests are flawed. Tests detect things that don’t exist (false positive), and miss things that do exist (false negative).
Tests give us test probabilities, not the real probabilities. People often consider the test results directly, without considering the errors in the tests.
False positives skew results. Suppose you are searching for something really rare (1 in a million). Even with a good test, it’s likely that a positive result is really a false positive on somebody in the 999,999.