Growing Gap: Rhetoric vs. Reality

asylum-lunatics

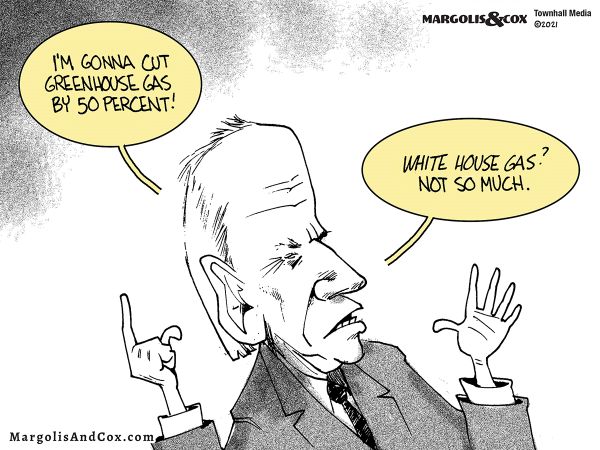
From ancient days of village idiots, communities recognized that some people get caught up into thinking and talking crazy stuff detached from the real world.  And if the behavior resulting from being unhinged endangers other people, it becomes necessary to hold the crazies in an asylum apart from the general population.  So what to make of Biden’s first 100 days?  Systemic Delusion, full of sound and fury, in defiance of the real world.  Later on I will go into some depth on the climate fantasies, but the unhinged rhetoric is generalized and administration-wide.  No one knows whether the principals (Biden, Harris, etc.) actually understand what they are saying.  I am inclined to believe they are only posturing, since those in power behind the throne are emboldened by the advantage of escaping accountability for the results of bad rhetoric and policies.

Examples include calling illegal aliens, not simply “undocumented”, but according to Biden “already Americans.”  Legislation expanding voting access to documented citizens is called “voter suppression.”  Adding four more Supreme Justices is called “unpacking the court.”  A brave policeman who saves two black teenagers from being stabbed by a third is called a “racist.”  Biden and his appointees claim the nation is guilty of “systemic racism” without any apology for their own roles for decades in government.  But the grandest fantasy and hypocrisy are wrapped in the call for climate action.

Climate stool

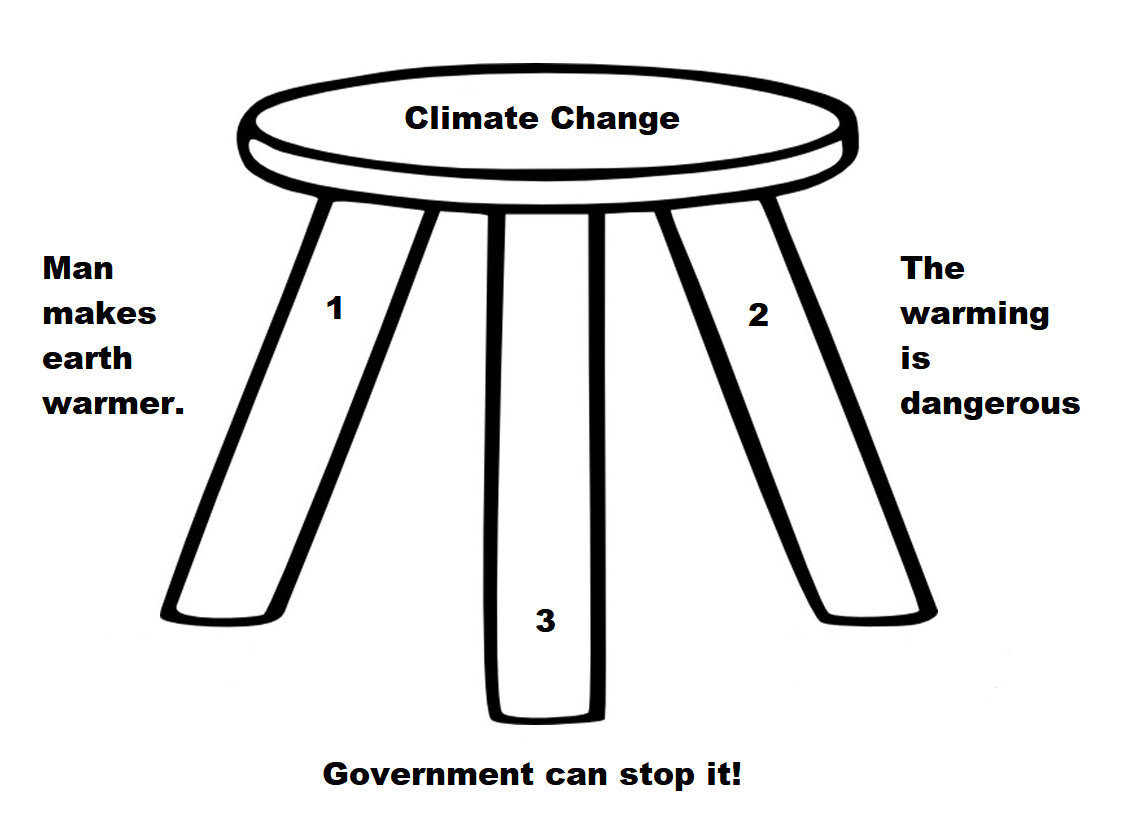
Climate Rhetoric is a stool composed of three assertions, all of which must stand for the appeal to be compelling. Of course, the topic itself has been shifted from “global warming” (not scary enough) to “climate change” (not urgent enough) to “climate crisis, or chaos or emergency.”  The consensus label is not yet settled, with “global weirding” still in the running.  But we know the issue is the same one posted on Obama’s twitter account, back when POTUS was permitted to tweet: “Ninety-seven percent of scientists agree: climate change is real, man-made and dangerous.”

mc_wh_gas_web20210423124932

The Science Leg:  Man Makes Earth Warmer.

Many people commenting both for and against reducing emissions from burning fossil fuels assume it has been proven that rising GHGs including CO2 cause higher atmospheric temperatures. That premise has been tested and found wanting, as this post describes:  Global Warming Theory and the Tests It Fails.  At least five rigorous analyses of relevant datasets failed to discern surface warming due to rising CO2 concentrations.  While it is true in the laboratory that CO2 is able to absorb and emit infrared radiation (IR), the effect upon the actual planetary climate system has not proven to be substantial rather than negligible.

The temperature records show warming from time to time, but do not distinguish between natural and man-made warming.  For example, consider that all the surface warming since the 1940s can be attributed to three oceanic events.

GMT warming events

The animation is an update of a previous analysis from Dr. Murry Salby. These graphs use Hadcrut4 and include the 2016 El Nino warming event. The exhibit shows since 1947 GMT warmed by 0.8 C, from 13.9 to 14.7, as estimated by Hadcrut4. This resulted from three natural warming events involving ocean cycles. The most recent rise 2013-16 lifted temperatures by 0.2C. Previously the 1997-98 El Nino produced a plateau increase of 0.4C. Before that, a rise from 1977-81 added 0.2C to start the warming since 1947. 

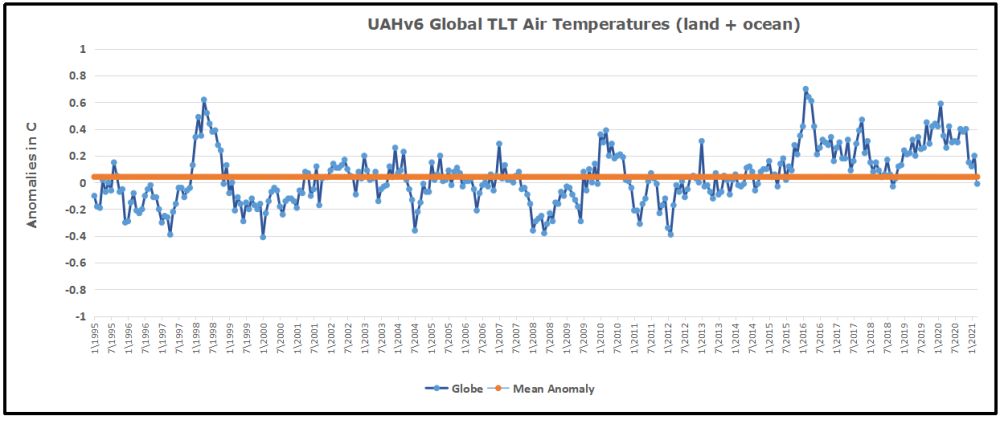
Importantly, the theory of human-caused global warming asserts that increasing CO2 in the atmosphere changes the baseline and causes systemic warming in our climate. On the contrary, all of the warming since 1947 was episodic, coming from three brief events associated with oceanic cycles. Moreover, the UAH record shows that the effects of the last one are now gone as of January 2021. Updated to March 2021 (UAH baseline is now 1990-2020)

uah-global-1995to202103-1

 Professor Richard Lindzen ended a recent lecture with these words:

I haven’t spent much time on the details of the science, but there is one thing that should spark skepticism in any intelligent reader. The system we are looking at consists in two turbulent fluids interacting with each other. They are on a rotating planet that is differentially heated by the sun. A vital constituent of the atmospheric component is water in the liquid, solid and vapor phases, and the changes in phase have vast energetic ramifications. The energy budget of this system involves the absorption and reemission of about 200 watts per square meterDoubling CO2 involves a 2% perturbation to this budget. So do minor changes in clouds and other features, and such changes are common. In this complex multifactor system, what is the likelihood of the climate (which, itself, consists in many variables and not just globally averaged temperature anomaly) is controlled by this 2% perturbation in a single variable? Believing this is pretty close to believing in magic. Instead, you are told that it is believing in ‘science.’ Such a claim should be a tip-off that something is amiss. After all, science is a mode of inquiry rather than a belief structure.

The Impacts Leg: The Warming is Dangerous

The second leg consists of impact studies from billions of research dollars spent uncovering any and all possible negatives from warming, everything from risk of Acne to Zika Virus.  The delusion is double:  Natural fluctuations when increasing are presumed to be negative, and the positive benefits of CO2 concentrations are ignored. 

A recent Climate Report repeats the usual litany of calamities to be feared and avoided by submitting to IPCC demands. The evidence does not support these claims. An example:

It is scientifically established that human activities produce GHG emissions, which accumulate in the atmosphere and the oceans, resulting in warming of Earth’s surface and the oceans, acidification of the oceans, increased variability of climate, with a higher incidence of extreme weather events, and other changes in the climate.

Moreover, leading experts believe that there is already more than enough excess heat in the climate system to do severe damage and that 2C of warming would have very significant adverse effects, including resulting in multi-meter sea level rise.

Experts have observed an increased incidence of climate-related extreme weather events, including increased frequency and intensity of extreme heat and heavy precipitation events and more severe droughts and associated heatwaves. Experts have also observed an increased incidence of large forest fires; and reduced snowpack affecting water resources in the western U.S. The most recent National Climate Assessment projects these climate impacts will continue to worsen in the future as global temperatures increase.

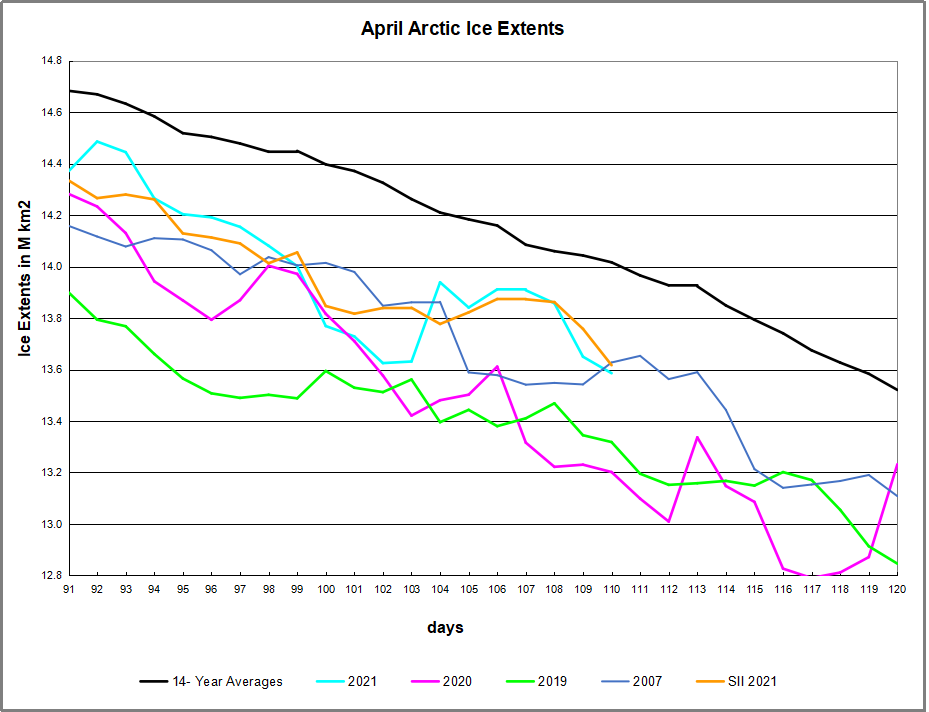
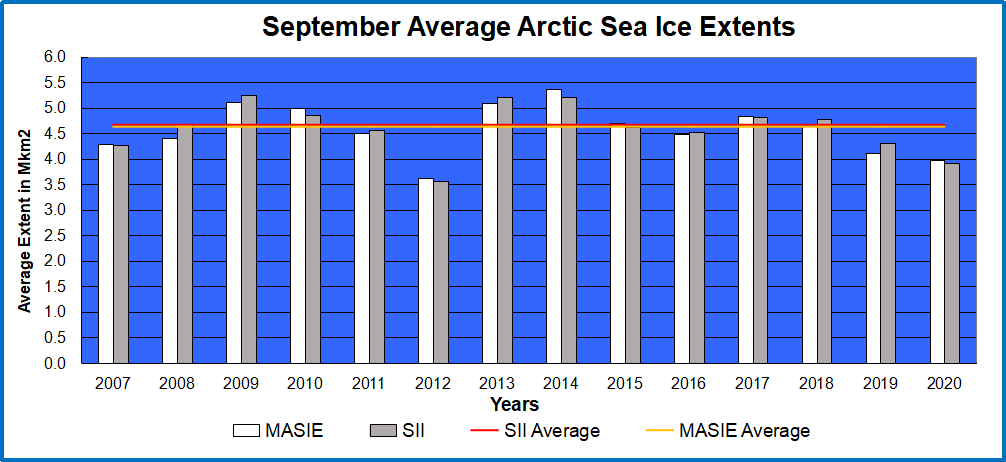
But: Arctic Ice has not declined since 2007.

Arctic ice Sept Ave 2020

But: All of these are within the range of past variability.

us-wet-dry-co2rev-1

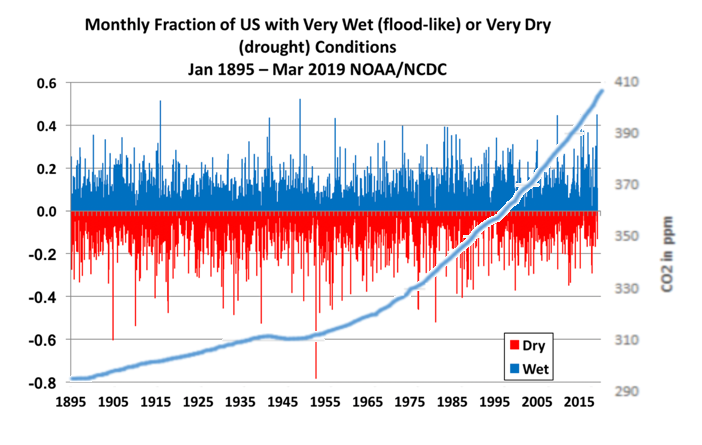
But: Weather is not more extreme.

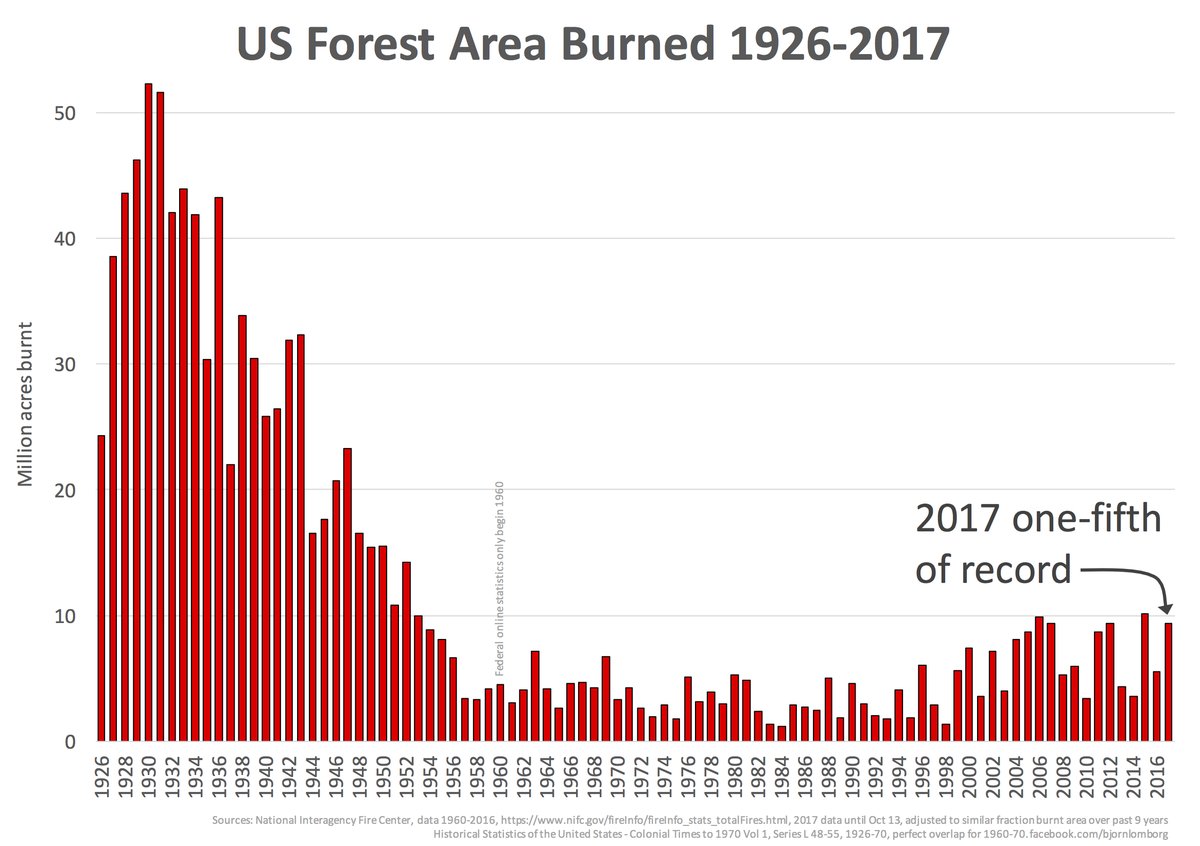
But:Wildfires were worse in the past

us-acres-burned-1926-2017

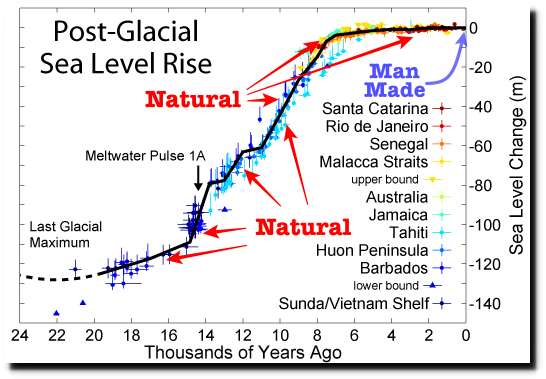
But: Sea Level Rise is not accelerating.

post-glacial_sea_level

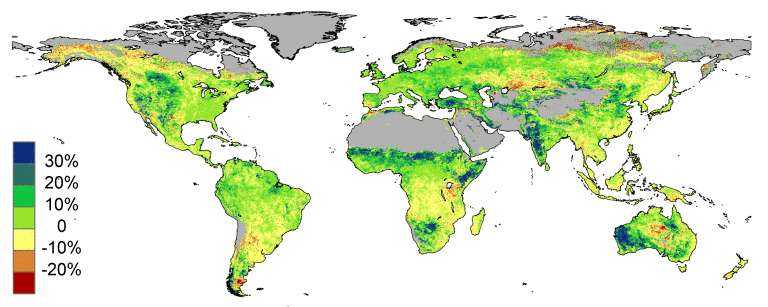
But: The planet is greener because of rising CO2.

high_resolution1


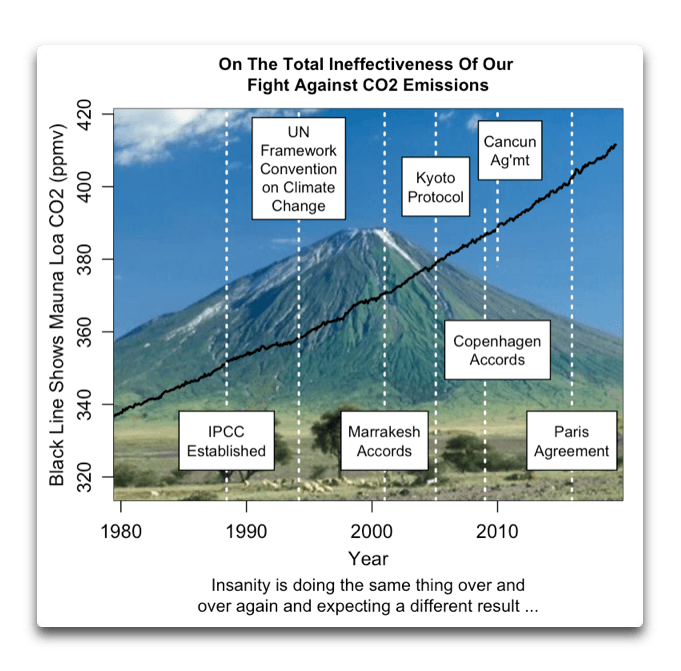
The Policy Leg:  Government Can Stop It.

Reality Check 30 yrs. of climate policy

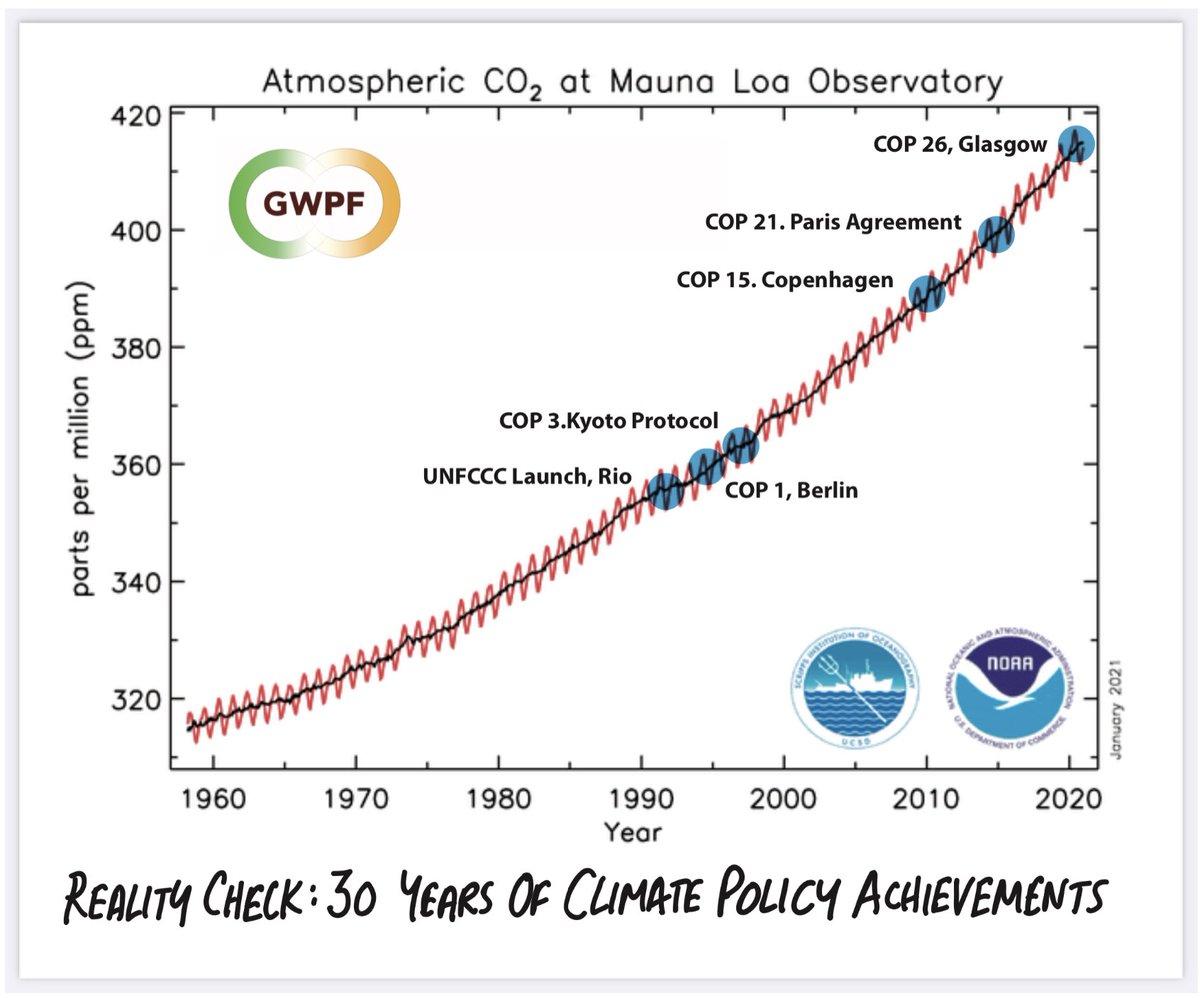
And the third leg is climate initiatives (policies) showing how governments can “fight climate change.”  Some discussion on the wildly improbable notion of powering modern societies with so-called “renewable energy” is provided by Kent Lassman writing at the Washington Examiner Our conversation about the environment is broken. What is the way forward? Excerpts in italics with my bolds.

Our government relies on predictive scientific models that are periodically tweaked. With decades of actual data, it is clear the models have consistently over-predicted warming. Yet, these problems are rarely given any cautionary weight in policy deliberations.

We have a half-century of dire environmental predictions that are usually wrong in the same direction. That raises the question of how much science is being undermined by a political agenda. Is the problem models that do not perform or our attachment to the terror of environmental apocalypse?

This fear is the second major problem we must overcome to improve the quality of our policy debate. Fear of carbon dioxide obscures the near-term and very real consequences of radical climate policies that could have consequences worse than those of a warming atmosphere.

Consider the poorest among us. According to the International Energy Agency, Africa will be the most populous region on Earth by 2023. Today there are 600 million Africans without access to electricity and 900 million who lack clean water. Achieving a reliable electricity supply for this population will require a huge investment, about four times pre-pandemic trends, of $120 billion a year, every year through 2040.

That gargantuan figure assumes access to the most readily available forms of energy: fossil fuels. Without such access, lower-income nations will not enjoy improving standards of living, education, and health. Instead, disease and war are their future. Ironically, depriving these people of a carbon economy likely leads to the very apocalyptic conditions we all want to avoid.

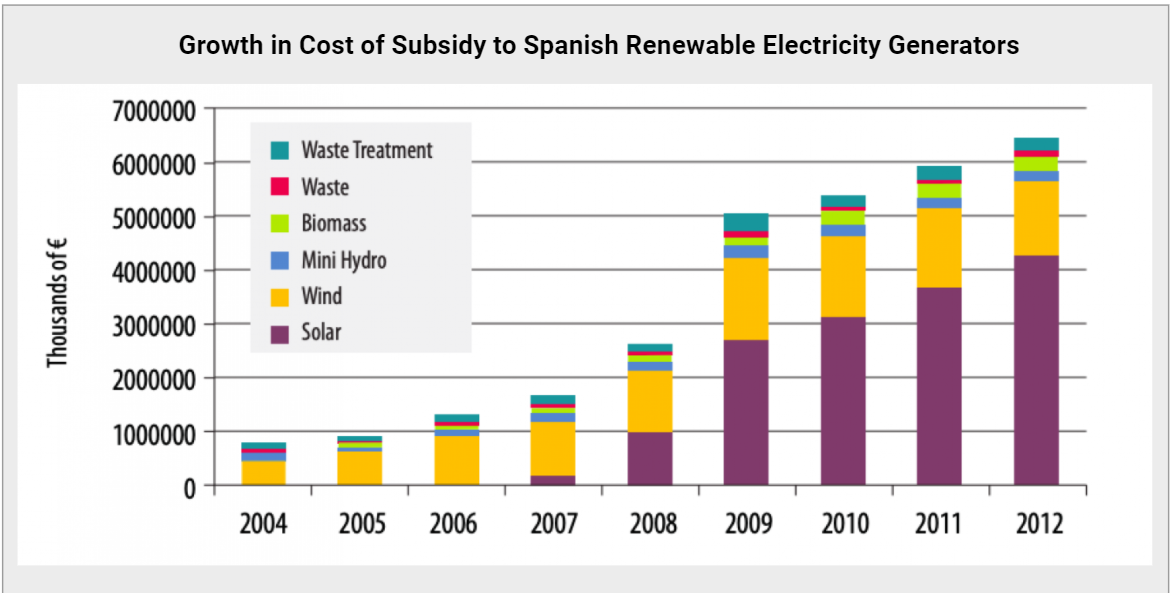
Renewable energy can be a crucial piece of a greener energy future, but we need to be realistic about its limits, the costs of production and disposal, and the secondary effects for the communities producing the raw materials necessary, often with child labor.

Last year a Dutch government-sponsored study concluded that the Netherlands’s renewable energy ambitions ALONE would consume a major share of global minerals. Considering that the U.S. consumes 30 times more energy than the Netherlands, the study concluded: “Exponential growth in [global] renewable energy production capacity is not possible with present-day technologies and annual metal production.” The report also determined that meeting the goals of the Paris climate agreement would require the global production of some metals to grow at least 12-fold by 2050.

An effective climate strategy must be itself sustainable. That requires some measure of humility and an honest evaluation of real-world trade-offs, the linkage between energy use and human welfare, the technological vulnerabilities of alternatives to fossil fuels, and how little we know about the future of something as complex as climate.

That uncertainty demands honesty about the confidence we have, and ought to have, in what we know and can predict. It is a feature, not a bug, of sound climate policy. It should inform understanding of both benefits and costs that flow from any policy choice.

The lives and livelihoods of real people are at stake. We have a responsibility to be clear-eyed and humble about real-world consequences. That means admitting when we are wrong and, equally important, when someone with a different view has a valid point.

ineffective-fight-against-co2-emissions-2


California on the Road to Ruin

daalp6zvmaa7isf

The Golden State is a shining example of paradise lost by wrong policy choices pursuing a “woke” agenda.  Since the Biden-Harris regime intends to Californicate the entire nation, it is critical to understand and avoid the wrong road taken.  David L. Bahnsen writes at National Review The Great California Exodus.  Excerpts in italics with my bolds. 

A look at why droves are leaving the state

What caused and continues to cause the exodus out of California is not tax burden, or regulation, or cost of living, or housing prices. Rather, it is the burden, and regulation, and cost of living, and housing prices, and more.

There is no evidence that the declining appeal of staying in California is simply a tax protest. On top of being walloped by taxes, one takes fiscal hit after fiscal hit — property taxes that average $5,000 per year for a lower-end middle-class home with no frills and that can easily approach $10,000 per year for the most mundane of tract homes. Utili­ties, car registration, insurance, and education expenses are all in the top decile.

cls63stwwaayc9f

One is being asked to pay a lot more to live in California, and yet education results are abysmal, crime rates are unacceptable (the state has the 14th-worst rate of violent crimes per capita), the electricity grid is a debacle, and the job market has hollowed out. (The CEOs of great California companies have maintained homes in Menlo Park or Palos Verdes; recent factory or plant expansions of the companies have gone to Nevada, Arizona, and Texas.)

The value of living in California has declined but the cost has not been correspondingly reduced; in fact, it has exponentially increased. A business cannot survive when it raises prices while simultaneously making a worse product. Neither can a state.

California made a choice to adopt a cost structure perfectly tailored to the needs of its public-employee unions. (The same could be said of Greece.) Policy-makers have made a conscious decision to make no effort whatsoever to diversify the state’s revenue base. The extreme revenues that highly specialized companies in Silicon Valley have earned bought legislators time as they came out of the great financial crisis. But the dysfunctional dependency on a technology tax base in the go-go 1990s and the subsequent dot-com bust taught Sacramento nothing. Today, the state depends on a revenue base narrower than ever before, even as debt levels, pension-funding needs, and infrastructure needs are at code red. One need not ignore the blessing of high capital-gain revenue when Big Tech flourishes, but to assume that the gravy train will continue is perilous.

596ce5d9cc5dd.image_

For the leftist ideologues who have brought about the exodus, an unexpected turn of events is taking place. The Left underestimated the impact of the pre-pandemic outmigration. It was never good for the fiscal and cultural health of the state that so many, after weighing the pros and cons, voted with their feet. One can be forgiven, however, for thinking that the Left was not all that shaken up by 650,000 middle-class people per year realizing that, in Texas or Arizona, they could buy more house for less money, with a smaller tax burden and greater job prospects for their kids. The “don’t let the door hit you on the way out” mentality of so many lawmakers was hardly disguised, especially while another social-media company was making an IPO or a new venture-capital fund was ringing the cash register.

But the newest development in the Left’s fatal designs for this state is a game-changer. It is no longer just a family of four making $90,000 per year packing up the U-Haul and headed to Utah for a better life.  The leftists themselves have had enough. The tech wizards of Palo Alto realize they have artisanal coffee shops in Denver, too. The cultural appeal of California has spread outside its own borders. Middle-class traditional families had already made the cost–benefit analysis of leaving the state, but now the gravy train has caught on as well. The Hewlett-Packards and the Teslas and select Silicon Valley gurus capture headlines now as they pack their own version of a U-Haul. What lies ahead for the state is ten years of a slow build of this same dynamic — even the cool kids are getting out of Dodge.

Legislators make conscious decisions sometimes. So do middle-class families. And guess what? So do hip, tech-savvy Millennials.

5db36b3ee25b2.image_


Oceans SST Update April 2021

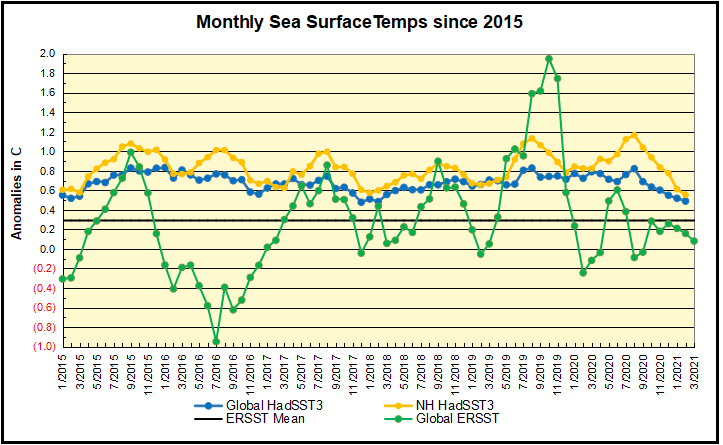
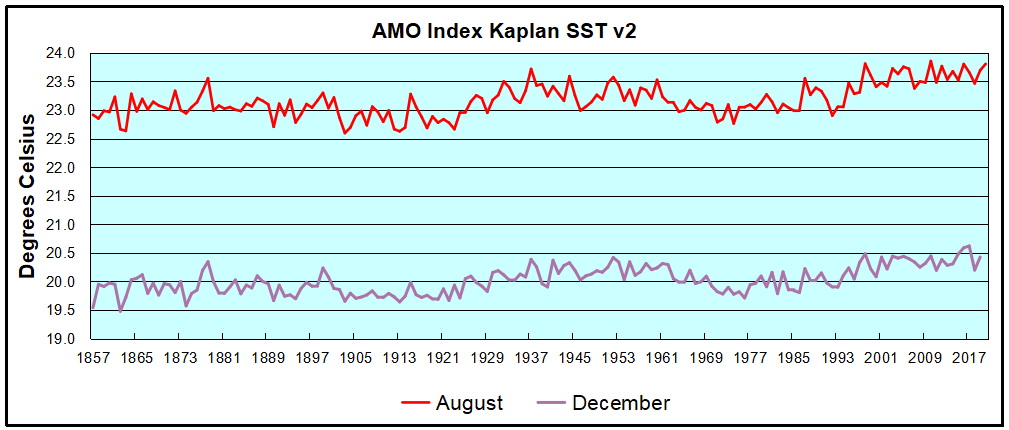
My preferred SST dataset is HadSST3, for reasons noted at the end.  However, no new data has been provided for either February or March, so I have been looking at alternatives.  HadSST4 shows February, but nothing since.  So this post will feature ERSST5, with some comparisons with HadSST3 and notes on the differences.  First the usual contextual introduction.

Overview

The best context for understanding decadal temperature changes comes from the world’s sea surface temperatures (SST), for several reasons:

  • The ocean covers 71% of the globe and drives average temperatures;
  • SSTs have a constant water content, (unlike air temperatures), so give a better reading of heat content variations;
  • A major El Nino was the dominant climate feature in recent years.

The Current Context

The various ERSST sources and history are described at the home page NOAA Extended Reconstructed Sea Surface Temperature (ERSST), Version 5.  A major distinction is the practice of interpolation, which involves infilling 2° by 2° grid cells missing sufficient observations in a month.  The values are anomalies from average anomalies for the period 1971 to 2000.  HadSST3 reports only on 5° by 5° grid cells observed in a month, and compares to a baseline 1961 to 1990. 

ERSST202103

ERSST5 reports only Global SSTs, unlike HadSST3 which also shows results for NH, SH and the Tropics (latitudes 20N to 20S).  The graph shows in green ERSST5 anomalies are much more volatile with both higher and lower extremes, compared to the blue HadSST3.  NH is added since it appears to vary similarly to ERSST, with the notable contradiction in 2016.  Also, the 2019 peak is much higher than 2015-16 in ERSST, whereas HADSST Global shows them comparable.  Both datasets show SSTs dropping sharply since summer 2020, and now below the mean anomaly for the period (only ERSST mean is shown).

The chart below shows SST monthly anomalies as reported in HadSST3 starting in 2015 through January 2021. After three straight Spring 2020 months of cooling led by the tropics and SH, NH spiked in the summer, along with smaller bumps elsewhere.  Now temps everywhere are dropping the last six months, with all regions well below the Global Mean since 2015, matching the cold of 2018, and lower than January 2015. 

A global cooling pattern is seen clearly in the Tropics since its peak in 2016, joined by NH and SH cycling downward since 2016.  In 2019 all regions had been converging to reach nearly the same value in April.

Then  NH rose exceptionally by almost 0.5C over the four summer months, in August 2019 exceeding previous summer peaks in NH since 2015.  In the 4 succeeding months, that warm NH pulse reversed sharply. Then again NH temps warmed to a 2020 summer peak, matching 2019.  This has now been reversed with all regions pulling the Global anomaly downward sharply.

Note that higher temps in 2015 and 2016 were first of all due to a sharp rise in Tropical SST, beginning in March 2015, peaking in January 2016, and steadily declining back below its beginning level. Secondly, the Northern Hemisphere added three bumps on the shoulders of Tropical warming, with peaks in August of each year.  A fourth NH bump was lower and peaked in September 2018.  As noted above, a fifth peak in August 2019 and a sixth August 2020 exceeded the four previous upward bumps in NH.

And as before, note that the global release of heat was not dramatic, due to the Southern Hemisphere offsetting the Northern one.  The major difference between now and 2015-2016 is the absence of Tropical warming driving the SSTs, along with SH anomalies reaching nearly the lowest in this period. Presently both SH and the Tropics are quite cool, with NH coming off its summer peak.  Note the tropical temps descending into La Nina levels.  At this point, the 2016 El Nino and its NH after effects have dissipated completely.

A longer view of SSTs

The graph below  is noisy, but the density is needed to see the seasonal patterns in the oceanic fluctuations.  Previous posts focused on the rise and fall of the last El Nino starting in 2015.  This post adds a longer view, encompassing the significant 1998 El Nino and since.  The color schemes are retained for Global, Tropics, NH and SH anomalies.  Despite the longer time frame, I have kept the monthly data (rather than yearly averages) because of interesting shifts between January and July.

ERSST95to0321

In the longer record the 1998 El Nino stands as one bookend and 2019 as the other.  Note that HadSST Global warming events appear more as extended periods of slightly higher anomalies, while ERSST events appear as sharp peaks and valleys.  Note also that present Global SSTs are matching the mean since 1995.

To enlarge image, single-click or open in new tab.

1995 is a reasonable (ENSO neutral) starting point prior to the first El Nino.  The sharp Tropical rise peaking in 1998 is dominant in the record, starting Jan. ’97 to pull up SSTs uniformly before returning to the same level Jan. ’99.  For the next 2 years, the Tropics stayed down, and the world’s oceans held steady around 0.2C above 1961 to 1990 average.

Then comes a steady rise over two years to a lesser peak Jan. 2003, but again uniformly pulling all oceans up around 0.4C.  Something changes at this point, with more hemispheric divergence than before. Over the 4 years until Jan 2007, the Tropics go through ups and downs, NH a series of ups and SH mostly downs.  As a result the Global average fluctuates around that same 0.4C, which also turns out to be the average for the entire record since 1995.

2007 stands out with a sharp drop in temperatures so that Jan.08 matches the low in Jan. ’99, but starting from a lower high. The oceans all decline as well, until temps build peaking in 2010.

Now again a different pattern appears.  The Tropics cool sharply to Jan 11, then rise steadily for 4 years to Jan 15, at which point the most recent major El Nino takes off.  But this time in contrast to ’97-’99, the Northern Hemisphere produces peaks every summer pulling up the Global average.  In fact, these NH peaks appear every July starting in 2003, growing stronger to produce 3 massive highs in 2014, 15 and 16.  NH July 2017 was only slightly lower, and a fifth NH peak still lower in Sept. 2018.

The highest summer NH peak came in 2019, only this time the Tropics and SH are offsetting rather adding to the warming. Since 2014 SH has played a moderating role, offsetting the NH warming pulses. Now September 2020 is dropping off last summer’s unusually high NH SSTs. (Note: these are high anomalies on top of the highest absolute temps in the NH.)

What to make of all this? The patterns suggest that in addition to El Ninos in the Pacific driving the Tropic SSTs, something else is going on in the NH.  The obvious culprit is the North Atlantic, since I have seen this sort of pulsing before.  After reading some papers by David Dilley, I confirmed his observation of Atlantic pulses into the Arctic every 8 to 10 years.

But the peaks coming nearly every summer in HadSST require a different picture.  Let’s look at August, the hottest month in the North Atlantic from the Kaplan dataset.
The AMO Index is from from Kaplan SST v2, the unaltered and not detrended dataset. By definition, the data are monthly average SSTs interpolated to a 5×5 grid over the North Atlantic basically 0 to 70N. The graph shows August warming began after 1992 up to 1998, with a series of matching years since, including 2020.  Because the N. Atlantic has partnered with the Pacific ENSO recently, let’s take a closer look at some AMO years in the last 2 decades.

AMO decade 022021


This graph shows monthly AMO temps for some important years. The Peak years were 1998, 2010 and 2016, with the latter emphasized as the most recent. The other years show lesser warming, with 2007 emphasized as the coolest in the last 20 years. Note the red 2018 line is at the bottom of all these tracks. The black line shows that 2020 began slightly warm, then set records for 3 months. then dropped below 2016 and 2017, peaked in August and is now below 2016. This year is starting out matching cooler analog years.

Summary

The oceans are driving the warming this century.  SSTs took a step up with the 1998 El Nino and have stayed there with help from the North Atlantic, and more recently the Pacific northern “Blob.”  The ocean surfaces are releasing a lot of energy, warming the air, but eventually will have a cooling effect.  The decline after 1937 was rapid by comparison, so one wonders: How long can the oceans keep this up? If the pattern of recent years continues, NH SST anomalies may rise slightly in coming months, but once again, ENSO which has weakened will probably determine the outcome.

Footnote: Why Rely on HadSST3

HadSST3 is distinguished from other SST products because HadCRU (Hadley Climatic Research Unit) does not engage in SST interpolation, i.e. infilling estimated anomalies into grid cells lacking sufficient sampling in a given month. From reading the documentation and from queries to Met Office, this is their procedure.

HadSST3 imports data from gridcells containing ocean, excluding land cells. From past records, they have calculated daily and monthly average readings for each grid cell for the period 1961 to 1990. Those temperatures form the baseline from which anomalies are calculated.

In a given month, each gridcell with sufficient sampling is averaged for the month and then the baseline value for that cell and that month is subtracted, resulting in the monthly anomaly for that cell. All cells with monthly anomalies are averaged to produce global, hemispheric and tropical anomalies for the month, based on the cells in those locations. For example, Tropics averages include ocean grid cells lying between latitudes 20N and 20S.

Gridcells lacking sufficient sampling that month are left out of the averaging, and the uncertainty from such missing data is estimated. IMO that is more reasonable than inventing data to infill. And it seems that the Global Drifter Array displayed in the top image is providing more uniform coverage of the oceans than in the past.

uss-pearl-harbor-deploys-global-drifter-buoys-in-pacific-ocean

USS Pearl Harbor deploys Global Drifter Buoys in Pacific Ocean


Worst Threat: Greenhouse Gas or Quiet Sun?

At the American Thinker, Anony mee writes The Coming Modern Grand Solar Minimum.  Excerpts in italics with my bolds.

solar_cycle_25_nasa_full

I wrote last week about the coming Grand Solar Minimum, something that will have much more impact on the environment than anything we puny humans can do. It generated a lot of interest from all sides, so it’s time to delve deeper into what we can expect.

Starting with the hype: During the last grand solar minimum (GSM), the Maunder Minimum of 1645 to 1715, glaciers advanced, rivers froze, sea ice expanded — in short, the Little Ice Age. Is another one is almost upon us?

Probably not. Maunder occurred at the tail end of a bi-millennial cycle. These cycles range between 2,000 and 2,600 years in length and see the Earth first warm, then cool. Gradual cooling had been going on for hundreds of years. Maunder just capped it off. Today we are a few hundred years into the warming phase of the subsequent bi-millennial cycle. Different starting conditions yield different paths.

The progressives say that we’re so deep into anthropogenically accelerated climate change (AACC) that there’s almost no time left to turn things around. If we don’t act now, it will be too late.

Nope, sorry squad members. What we can predict, instead, is an overall temperature reduction of 1 degree Centigrade by the end of the GSM. Afterward, natural warming at the rate of around 0.5 C. every hundred years will continue for the next 600 years or so.

That gives us a good 35 to 50 years to hone the science and come up with the best ways to mitigate the impact of unstoppable global warming on humankind; until, that is, it naturally reverses. See suggestions below for better uses of funding currently earmarked to address the “climate crisis.”

Reasonably speaking: We’ve been warming, so the cooling of the GSM will just even us out for a while. Therefore, nothing to worry about, right?

Well, not quite. There are a few worries. Plants grow in response to warmth, moisture, nutrients, and most importantly sunlight. Even if the temperature does not plunge to glacial depths, some cooling will take place and clouds are expected to grow denser and cover much of the earth’s surface as this GSM bottoms out. If normally-correlating volcanism takes place, the additional material in the atmosphere will further darken the globe and provide even more opportunity for condensation and cloud formation.

Last year, Dr. Valentina Zharkova wrote “This global cooling during the upcoming grand solar minimum…would require inter-government efforts to tackle problems with heat and food supplies for the whole population of the Earth” (not to mention their livestock).

The pessimists ask, what else can go wrong? Well, cooling will increase the demand for heat, darker days will increase the demand for light, and unfavorable outside conditions will increase the demand for power for enclosed food production. With more power needed, the amount we currently rely on from solar installations will decrease as cloud cover limits their efficacy.

A decrease in solar ultraviolet radiation can be expected to slow the formation of ozone in the atmosphere, a lack of which tends to destabilize the jet stream, causing wilder weather. Wind generators turn off when the wind is excessively strong. As we now know, they are not immune from freezing in place. In the face of a greater demand for power, we will generate less.

Even worse is this: Historically, GSMs have been associated with extreme weather events. Floods, droughts, heavy snowfall, late springs, and early autumns have all resulted in famine. Famine during GSMs has led to starvation and societal upheaval. No one wants the former, and I think we’ve seen enough of the latter this past year or so to do for our lifetimes.

We’re about 16 months into this GSM, with 32 more years to go. Already 2019 and 2020 saw record low numbers of sunspots. We’ve had lower than expected crop harvests due to unseasonable rains both years. The April 2021 USDA World Agricultural Product report has articles detailing Taiwan’s expected 20% decrease in rice production this year over last, Cuba’s rice production 15% below its five-year average, Argentina’s corn, Australia’s cotton, Malaysia’s palm oil — all down, all due primarily to the weather. There are some expected bumper crops, all based on expanded acreage.

We’ve got seven years until we hit the trough. There’s no time to lose. Fortunately, We the People are amazing. We’re strong, courageous, resilient, smart, well-educated, and clever. We are capable of coming together for a common cause and working well together regardless of politics and other differences. We must pull together to make sure we all survive the coming tumult. Here’s what we do.

On the federal level, take the brakes off energy production. No more talk of closing power plants, especially coal-fired ones, or of removing hydroelectric dams. Reinstate the Keystone XL pipeline; we’re going to need that fuel available to us when the predictable contraction of the global fuel market occurs. Extend the tax credits for those who install solar power. Production may not be optimal during the GSM, but as much as can occur will take a load off commercial energy.

At the United Nations, Ambassador Thomas-Greenfield should prioritize preparations for the coming dark, cold years. It is in the world’s best interest that all nations cease aggressions, even if just for a decade or so, so that we all may turn our resources to securing the lives of our peoples.

The USDA should not just take the brakes off agricultural production; it should encourage all producers to ramp it up. We need to have enough on hand to address the expected shortfall between production and requirement for at least five years. All loans to all farmers should be forgiven if they will agree to get on board with maximizing production. Garden seed producers, along with all other producers and processors, should be given significant tax credits for ramping up their production too.

Commerce should support vastly expanded food processing for long-term storage. Congress should fund the acquisition and storage of surplus staples and other food commodities so that sufficient amounts are on hand to keep our markets, feeding programs, and food banks operating when crop after crop begins to fail. Stockpiling for our future should take precedence over exports.

The NSC should demand a reconstitution of our strategic grain reserve, and that we prepare not just for ourselves, but to be able to share with needy neighbors and allies to keep America secure.

State, local, and tribal governments should clear away barriers to gardening and small animal production, including not limiting water catchment for gardening. Everything folks can do for themselves will take pressure off public services and limited markets. Local Emergency Services operations should also look at acquiring stocks of staples to help support their residents, as was done in many places last year.

Individuals, as well as schools and other institutions, should begin to garden, even if it’s just pots in a window. It’s a skill that takes time to learn and practice. Everyone should begin to preserve food for the hard times coming – freezing, canning, drying, smoking, pickling. As much as we can do for ourselves, we won’t be looking for someone else to have done for us.

This is really most important. We need to act now while food production is still relatively normal. Later on, if there’s nothing to buy, it won’t matter how much money we have on hand, as individuals or as a nation.

228683_5_

Valentina Zharkova presents her analysis and findings in paper Modern Grand Solar Minimum will lead to terrestrial cooling.  Excerpts in italics with my bolds.

In this editorial I will demonstrate with newly discovered solar activity proxy-magnetic field that the Sun has entered into the modern Grand Solar Minimum (2020–2053) that will lead to a significant reduction of solar magnetic field and activity like during Maunder minimum leading to noticeable reduction of terrestrial temperature.

ktmp_a_1796243_f0001_oc

Figure 3 presents the summary curve calculated with the derived mathematical formulae forwards for 1200 years and backwards 800 years. This curve reveals appearance of Grand Solar Cycles of 350–400 years caused by the interference of two magnetic waves. These grand cycles are separated by the grand solar minima, or the periods of very low solar activity.

Currently, the Sun has completed solar cycle 24 – the weakest cycle of the past 100+ years – and in 2020, has started cycle 25. During the periods of low solar activity, such as the modern grand solar minimum, the Sun will often be devoid of sunspots. This is what is observed now at the start of this minimum, because in 2020 the Sun has seen, in total, 115 spotless days (or 78%), meaning 2020 is on track to surpass the space-age record of 281 spotless days (or 77%) observed in 2019. However, the cycle 25 start is still slow in firing active regions and flares, so with every extra day/week/month that passes, the null in solar activity is extended marking a start of grand solar minimum.

Similarly to the Maunder Minimum … the reduction of solar magnetic field will cause a decrease of solar irradiance by about 0.22% for a duration of three solar cycles (25-27).” Zharkova determines that this drop in TSI (in conjunction with the “often overlooked” role solar background magnetic field plays, as well as with cloud nucleating cosmic rays) will lead to “a drop of the terrestrial temperature by up to 1.0°C from the current temperature during the next three cycles (25-27) … to only 0.4°C higher than the temperature measured in 1710,” with the largest temperature drops arriving “during the local minima between cycles 25−26 and cycles 26-27.

The reduction of a terrestrial temperature during the next 30 years can have important implications for different parts of the planet on growing vegetation, agriculture, food supplies, and heating needs in both Northern and Southern hemispheres. This global cooling during the upcoming grand solar minimum (2020-2053) can offset for three decades any signs of global warming and would require inter-government efforts to tackle problems with heat and food supplies for the whole population of the Earth.

Cool 2021 Spring Continues

imagehy1p

Dr. Judah Cohen provides a weather outlook based upon his study of the Arctic Oscillation at his blog Arctic Oscillation and Polar Vortex Analysis and Forecast April 19, 2021.  Excerpts in italics with my bolds.

The PV is in its waning days of the 2020/21 cold season and will likely be nearly or completely disappeared by the next blog update. This seems to me to be a clear dynamically assisted Final Warming as vertical Wave Activity Flux (WAFz and is proportional to poleward heat transport) has been active for at least a week now and is predicted to remain active for the next two weeks. A dynamic Final Warming can result in some cooler weather across the mid-latitudes; and in my opinion the snow and possibly record cold temperatures predicted for the Eastern US this week is related to the dynamic Final Warming. The PV is being stretched from Siberia to Canada that creates cross polar flow from Siberia to North America that drives cold air south across Canada and the US east of the Rockies. I do believe that this is a short-term impact only and will not have an influence on the summer weather across North America.

Europe has had an impressively cool April, relative to recent Aprils (probably the coolest April since 2013 and maybe even since 2003), which is directly attributable to Greenland blocking that has also extended into the North Atlantic for much of the month. There are no strong signs that the Greenland blocking will disappear any time soon, and as long as it persists, Europe can experience relatively cool temperatures. I see no obvious signs that the Greenland blocking is tied to PV variability and it is therefore more challenging for me to anticipate how long it will last. But it is likely that the streak of cool weather is dependent on the persistence of the Greenland blocking. If and when the Greenland blocking abates, European temperatures could start to climb.

As noted in previous posts, when cold Arctic air pushes south, it is replaced by warmer air contributing to ice melting.  To be clear, sea ice melts primarily because of sunshine directly, and indirectly by intruding sun-warmed water, mostly from the Atlantic by way of Barents Sea. The Arctic in summer daily receives more solar energy than does the equator.  Warmer air is a tertiary contributing factor.

ArcApril 099 to 110

The animation shows Okhotsk upper left lost ~250k km2 of ice extent over the last 10 days.  Bering Sea lower left waffled with little change until losing ~60k km2 the last two days.  On the Atlantic side, Barents Sea upper right gained ~100k km2 over a week, then lost most of it ending about the same.  Greenland Sea middle right lost ~100k km2m, while Baffin Bay lower right waffled and lost very little.

Arctic2021110

The overall impact on NH sea ice is shown in the graph above.  Firstly a drop starting April 10, then recovering April 14 and holding firm to draw near to average, before another drop the last two days.

Background Previous Post  Spring 2021: Warm is Cold, and Down is Up

The cold Spring this year is triggering responses turning natural factors upside down and backwards, confusing causes and effects.  For example, this article at Science Daily Snow chaos in Europe caused by melting sea-ice in the Arctic.  The simplistic appeal to “climate change” is typical: “It is the loss of the Arctic sea-ice due to climate warming that has, somewhat paradoxically, been implicated with severe cold and snowy mid-latitude winters.”  In fact, as we shall see below, it is the wavy Polar Vortex causing both cold mid-latitudes from descending Arctic air, and melting ice from intrusions of warmer southern air.  Importantly, global warming theory asserts that adding CO2 causes the troposphere to warm and the stratosphere to cool.  What we are experiencing this Spring is an unstable Polar vortex due to events of Sudden Stratospheric Warming  (SSWs), not cooling.

Seasoned meteorologist Judah Cohen of AER shows the mechanism this way:

My colleagues, at AER and at selected universities, and I have found a robust relationship between two October Eurasian snow indices and the large-scale winter hemispheric circulation pattern known as the North Atlantic or Arctic Oscillation pattern (N/AO).

The N/AO is more highly correlated with or explains the highest variance of winter temperatures in eastern North America, Europe and East Asia than any other single or combination of atmospheric or coupled ocean-atmosphere patterns that we know of. Therefore, if we can predict the winter N/AO (whether it will be negative or positive) that provides the best chance for a successful winter temperature forecast in North America but certainly does not guarantee it.

He goes on to say that precipitation is the key, not air temperatures, and ENSO is a driving force:

As long as I have been a seasonal forecaster, I have always considered El Nino/Southern Oscillation (ENSO) as a better predictor of precipitation than temperature across the Eastern US. I think this is supported by the observational or statistical analysis as well as the skill or accuracy of the climate models.

There have been recent modeling studies that demonstrate that El Nino modulates the strength and position of the Aleutian Low that then favors stratospheric warmings and subsequently a negative winter N/AO that are consistent with our own research on the relationship between snow cover and stratospheric warmings. So the influence of ENSO on winter temperatures in the Mid-Atlantic and the Northeast may be greater than I acknowledge or that is represented in our seasonal forecast model.

Summary

As Cohen’s diagram shows, there is an effect from warming, but in the stratosphere. Global warming theory claims CO2 causes warming in the troposphere and cooling in the stratosphere. So whatever is going on, it is not due to CO2.

Cohen’s interview with the Washington Post.

its-easier-to-fool-people-than-to-convince-them-that-they-have-been-fooled


The current situation is described in Cohen’s most recent post at his Arctic Oscillation blog:

The stratospheric PV always disappear in the spring due to the increasing solar radiation in the polar stratosphere. However, during some springs in addition to the radiative warming of the polar stratosphere, there is also dynamic warming of the polar stratosphere due to the absorption of upwelling Wave Activity Flux (WAFz) from the troposphere. This occurred last spring, which did result in a cool May and even some rare snowfall in the Northeastern US. The predicted return of Ural blocking coupled with Northeast Asia/northern North Pacific troughing is conducive to more active WAFz. The latest PV animation (see Figure ii) shows the stratospheric PV filling (weakening) and meandering over the northern Asia in response to the more active WAFz. This could be the beginning of a dynamically assisted Final Warming that could result in a period of cooler temperatures in parts of the mid-latitudes.

imagesj5oh

Figure ii. Observed and predicted daily geopotential heights (dam; contours) and anomalies (shading) through April 21, 2021. The forecast is from the 00Z 5 April 2021 GFS ensemble.

Background is at post No, CO2 Doesn’t Drive the Polar Vortex 

graphic20-20polarvortex_explained_updated2001291920-204034x2912-1


Why in Chile Both Covid Vax and Cases up

coronavirus-data-explorer vax apr 19

As the chart above shows Chile has vaccinated about 2/3 of its population, a world leader in that regard.  Some are puzzled how that nation would at the same time have a surge in confirmed Covid cases.  Let’s see how Chile compares on the cases metric in chart below

coronavirus-data-explorer April 19

Chile has seen a rise in cases, though still in the middle of the pack of nations shown.  The screen grab below allows a clearer picture of the Chilean experience.

coronavirus-data-explorer Chile April 19

Thomas Lifson explains what is going on in Chile in his American Thinker article COVID surging in Chile despite high rate of vaccination.  Excerpts in italics with my bolds.

The headline and tone of this article from CNBC are alarming: “Chile has one of the world’s best vaccination rates. COVID is surging there anyway.” One must read 13 paragraphs into the story to begin to solve what looks like a mystery.

Chile’s vaccination campaign against the coronavirus has been one of the world’s quickest and most extensive, but a recent surge in infections has sparked concern beyond its borders.

Almost 40% of the South American country’s total population have now received at least one dose of a COVID-19 vaccine, according to statistics compiled by Our World in Data, reflecting one of the highest vaccination rates in the world.

Chile is an impressive country in many respects. Yet:

The number of daily cases in Chile rose to a record high on April 9, climbing above 9,000 for the first time since the pandemic began and significantly higher than the peak of almost 7,000 recorded last summer.

CNBC’s writer Sam Meredith offers possible explanations:

Health experts say the country’s latest surge in cases has, in part, been driven by more virulent strains of the virus, a relaxation of public health measures, increased mobility and defiance of simple precautions — such as physical distancing and wearing a mask.

These are all Fauci favorites. Live in fear of new strains (and be prepared for masks and lockdowns forever because viruses mutate, you see). For goodness’s sake, isolate from each other, and don’t let herd immunity develop (as it seems to have done in free states like Texas and Florida and in Sweden). And above all, wear your obedience mask and live in a world without smiles.

Oh, yes: Cut yourself off from the rest of the world. Right-wing Chile didn’t, and look what happened:

Chile’s center-right government, led by President Sebastian Pinera, had ordered the closure of the country’s borders from March to November of 2020, albeit with a few exceptions, before the decision was taken to reopen them to international passengers late last year.

Finally, after all these possibilities have been mentioned, we get to what’s really going on:
There have also been questions raised about vaccine efficacy, given Chile’s widespread use of CoronaVac,  the coronavirus vaccine manufactured by Chinese firm Sinovac.

Questions raised, eh?   A few paragraphs later, we learn:

Late-stage data of China’s COVID vaccines remain unpublished, and available data of the CoronaVac vaccine is varied. Brazilian trials found the vaccine to be just over 50% effective, significantly less effective than the likes of Pfizer-BioNTech, Moderna and Oxford-AstraZeneca, while Turkish researchers have reported efficacy as high as 83.5%. (snip)

A study published by the University of Chile earlier this month reported that CoronaVac was 56.5% effective two weeks after the second doses were administered in the country. Crucially, however, they also reported that one dose was only 3% effective.

“This would help to explain why Chile — with one of the world’s most robust vaccine rollouts but 93% of the doses coming from China — has experienced a simultaneous significant expansion in cases, and a much slower decline in hospitalizations and deaths compared to the early rollouts in Israel, the United Kingdom and the United States,” Ian Bremmer, president of risk consultancy Eurasia Group, said in a research note.

Nowhere in the long article, which suggests that “‘comprehensive strategies’ to speed up the rollout of vaccines and stop transmission by using proven public health measures” may be necessary, is there any mention at all of therapeutic approaches using hydroxychloroquine or ivermectin in combination with zinc and vitamins, which has proven highly effective in arresting the development of cases, and even in prophylactically protecting people. Both drugs have been taken by millions of people for many years with very few reported adverse reactions.

Isn’t it curious that this obvious approach is not worth mentioning?

American Covid Phobia

screen-shot-2021-04-19-at-5.48.17-pm-998x649-1

Kylee Zempel explains in her Federalist article Americans Are Irrationally Afraid Of COVID Because The Ruling Class Has Demonized Risk

‘Why do so many vaccinated people remain fearful?’ David Leonhardt asks with a straight face in Monday’s New York Times newsletter.
Let me tell you.

Leonhardt opens with a story about judge and Yale University law professor Guido Calabresi, who for 30 years has been telling his students a tale he crafted about a god who came to society to propose an invention that would make their lives better in nearly every way. It would afford them extra quality time with loved ones and enable them to see sights and perform tasks they wouldn’t otherwise be able to do.

The cost? The god would select 1,000 young people to strike dead.

The professor would then pose the question to his students: Would you take the deal? The students’ answer would almost always be no. “What’s the difference between this and the automobile?” Calabresi would ask, revealing the moral of the story.

Leonhardt concludes in the Times that we accept the cost of automobile fatalities because it has always been an aspect of our lives. A world without cars and thus the risks they carry is a world we really just can’t imagine for ourselves. Our comfortability with vehicles, Leonhardt says, is an example of human irrationality when calculating risks. While people tend to focus on minuscule risks such as airplane crashes or shark attacks, we gloss over much riskier activities such as driving.

“One way for a risk to become salient is for it to be new,” Leonhardt says, likening the salient risk of Calabresi’s fable to COVID-19. “That’s a core idea behind Calabresi’s fable. He asks students to consider whether they would accept the cost of vehicle travel if it did not already exist. That they say no underscores the very different ways we treat new risks and enduring ones.”

Americans Used to Embrace Risk

Leonhardt’s assessment might be true to an extent. But the fact is that vehicles, which have always been risky, do exist, meaning that Americans at one point were willing to take that risk. At the turn of the 20th century, Calabresi’s fable wasn’t a fable at all. It was a reality, and Americans decided the risk was worth taking.

Thus the explanation can’t just be that we assign different treatments to “new risks and enduring ones.” It’s that Americans of today are orders of magnitude more risk-averse than our predecessors, and thus are more paralyzed and less productive. For a virus, Americans have chosen to cater to the most irrationally COVID-terrified voices among us, making us not only more paralyzed and less productive, but also increasingly less free.

COVID Terror Isn’t ‘Natural’

That’s where Leonhardt’s analysis almost completely diverges from reality. Irrational fears about COVID-19 are not “natural,” nor are they merely the result of salience and newness. It isn’t inherent in the human spirit to be terrified of things that pose such little risk for so much of the population.

These irrational fears are manufactured. They’re instilled by folks like Anthony Fauci, who said just last week that “No, it’s still not OK,” when asked whether vaccinated or unvaccinated Americans should be eating and drinking inside at restaurants and bars. Infection counts are still “disturbingly high,” he said, again fueling the fire of illogical COVID terror.

“Even after you’re vaccinated, social distancing, wearing masks are going to be essential,” White House Press Secretary Jen Psaki warned in February. Meanwhile, corporations and the federal government are teaming up to make you prove you’re not unclean with a “vaccine passport” so you don’t pose an existential threat to your fellow citizens, blue-state leaders and bureaucrats are double-masking even after they’re vaccinated and saying “it is possible” we’ll still be wearing face masks in 2022, and Biden’s COVID adviser is saying the pandemic in the United States is still a “Category 5 hurricane” even after millions of Americans have been inoculated.

So no, it isn’t “natural” that the vaccinated continue to cling to irrational fears. It’s a direct result of scare-mongering and lies and an unwillingness to do any type of risk assessment until a Pfizer cocktail is coursing through one’s veins. It’s the predictable outcome after a year of terrifying rhetoric and fudged data, in which The New York Times itself played a role (see here, here, here, here, here, and here) — and continues to.

stg041321dapr20210411104504

Resist the Culture of Fear

Either the Times author is too simple to connect those dots, or he’s part of the media and “expert” ruling class that still wants Americans to buy into their social experiment so they can keep normal citizens on a short leash as they craft the culture they desire of herders and sheep, haves and have-nots, and engineers and cogs.

Leonhardt is right about one thing: Most COVID fears are completely irrational. But The New York Times doesn’t get credit for pointing this out more than a year after the world went into lockdown and lives have been destroyed. When conservatives and Americans of goodwill tried to make risk assessments early on, they were excoriated by the corporate press for being selfish and conspiratorial murderers and rubes.

The irrationality of COVID fears didn’t start with the vaccine — and won’t end with it either. Today’s risk-averse Americans have decided en masse that safety is paramount, risk is unacceptable and therefore freedom is dangerous, and dissenters are malicious.

This brings us all back to Calabresi’s fable. American greatness, with pandemics as with automobiles, doesn’t come from 21st-century Yale students afraid of their own shadows. It comes from the types of Americans who can identify the dangers of the Model T, recognize that risk-taking is the sine qua non to human progress, and say, “Bring it on.”

titanic_brighter_small20210410060257


Cogito ergo sum→→Sentio ergo ita est

quote-cogito-ergo-sum-i-think-therefore-i-am-rene-descartes-282482

Historians consider that this René Descartes statement epitomizes the spirit of the Age of Reason.  The 17th century philosopher was looking for an unalterable foundation to build the knowledge, a fixed point from which knowledge could be erected. The quote comes from the Discourse on Method by René Descartes, writing which altered the course of history, ushering in a transformation also known as the Enlightenment.

Sentio ergo ita est

Now we have a new awakening and a shift away from reason and objectivity in favor of emotion and subjectivity.  The effects of this spirit are apparent in the Twitter mobs, legacy media propaganda,  in academic intolerance, and extends into virtue signalling corporate executives.  H/T to Pat Frank for his recent comment summarizing this distubing retreat from rationality.  Excerpt in italics with my bolds.

“In woke “science” there is no falsifiable hypothesis. In its place, we have the official orthodox consensus view.”

These areas of science have succumbed to sociology and culture studies. They not only include Covid and climate change, but extend to gender dysphoria, critical race theory, white supremacy, intersectionality, implicit bias, systemic racism, efficacy of diversity/equity/inclusion (DEI; right-think/quota/prejudice), the root cause of crime, and on and on.

These areas make claims that political extremism and violent riots have leveraged to the status of knowledge. Pseudo-knowledge. Things not true that are accepted widely and hotly.

Their general category is the subjectivist narrative. They assume what should be proved, the assumptions are granted the status of evidence, and all the studies are self-confirmatory.

Equivocal language and the flabby tendentious thinking of critical theorists (academic third-raters, all) makes subjectivist narratives the perfect tool for the political demagogue.

This is where universities are headed. Intolerant, prejudicial mediocrity fiercely overseen by Commisars of right-think.

Overseen because university presidents and boards, and heads of national labs, will be judged by their commitment to right-think. If an unseemly interest in merit undercuts DEI, the Commisar will see to their exit. Today, disemployment; later on, execution.

To this, the halls of science have surrendered.

It seems far too many scientists are just methodological hacks. Unable to distinguish knowledge from pseudo-knowledge, the cultural theorists have effortlessly rolled them over.

Background from previous post Revolution: Sentiment Now Overrules Sense

election-meddling-meghan-markle-all-but-endorses-joe-biden-crossing-political-line-that-is-off

Dominic Green describes the sociopolitical coup in his Spectator article Meghan ’n’ Joe’s empire of the sentiments.  Excerpts in italics with my bolds.

Biden dispenses serotonin the way Barack Obama dispensed drone strikes

If your facts don’t care about my feelings, then my feelings aren’t obliged to care about your facts. The facts in Joe Biden’s energetic, inspiring and exhilarating address to the nation last night were frequently as unsteady as the speaker. But the feelings that Biden expressed were, unlike the previous president who must not be named, unimpeachable.

He knows how it feels, he said with that now-customary surge of anger, as if he’s not fully in control of his frontal cortex. And we know how it feels when someone says they know how we feel. Consider everything fixed: COVID, racism, opioids, deficits, the collapse of the schools, the children at the border. The Therapeute-in-Chief is here, dispensing serotonin the way Barack Obama dispensed drone strikes.

It doesn’t matter whether Biden means what he says, any more that it matters whether Meghan Markle told the truth when she implied that her son was denied a prince’s title because he might have dark skin. It’s the feelings that matter: feelings of security, empathy and contentment, and especially the feeling that Nietzsche correctly foresaw as the root feeling of modern life, resentment.

quote-resentment-is-like-drinking-poison-and-then-hoping-it-will-kill-your-enemies-nelson-mandela-38-6-0685

The result is the rule of sentiment over thought and symbols over reality. The Biden administration didn’t invent the moral and humanitarian disaster at the southern border. But it has produced a new crisis by altering the laws to satisfy sentiment.

It feels cruel to return unaccompanied minors, as the Trump administration did, and to hold them in prison-like conditions, as both the Obama and Trump administrations did. But the fact is, Biden’s policies have fostered a greater cruelty.

Biden has created new incentives for human trafficking and the worse kinds of child exploitation.

The result is a surge in border crossings that even a professional euphemist like secretary of Homeland Security Alejandro Mayorkas calls ‘overwhelming’, and the spectacle of would-be illegal immigrants kneeling at the border while wearing t-shirts reading ‘Biden let us in’.

kid-migrants-913x479-1

This is what Biden gets for taking a knee as a craven genuflection to BLM. This is what he gets for accusing Donald Trump of being a racist and sadist for caging unaccompanied minors — even though Biden was vice president when the cages were built, and even though Biden now presides over a greater influx. And this is what we get: a theater of the sentiments, in which the actors and audience are so jaded that their senses and check books can only be stimulated by that reliable and obscene soap-opera trick, putting children’s lives in the balance.

Asked if the word ‘crisis’ applied, the President’s spokeswoman, Jennifer Psaki, refuses to call it anything at all — because she would feel bad, and we would feel bad, and Biden would look bad, if we called it for what it is. It is easier for the administration to resent the Mexican children for putting us in this moral bind, and resent the Republicans, who aren’t short of their own resentments when it comes to immigration, for making hay with it.

bg031121dapr20210311014503

The fact is that this is a crisis. It reflects the corrupt failure of Washington DC and the cold self-interest of corporations who want cheap labor, unions who don’t want it, and, in the middle, the upper-middle-class donors who dislike foreigners who don’t speak English, but need them to bus their tables, do their lawns and wipe their children’s backsides.

Given the complexities of the facts and the appeal of a flight into sentiment, it’s no wonder that this week the administration and media did direct us to pity the children. Meghan and Harry, that is.

Jennifer Psaki commends Meghan and Harry for the ‘courage’ it took to sit down with Oprah and make unsubstantiated allegations against his family. Their kind of fact-light, sentiment-heavy self-promotion and self-therapy was, Psaki told us, one of the areas that Biden is ‘committed to in the future’.

alg031221dapr20210312044519

Biden’s increasingly vague routines of empathy are the symbolic face and velvet glove of a bureaucracy of the sentiments whose offices run from government to the media.

Biden is very old. After him, the gloves will be off and the face will be hardened with more than Botox. We’ll get this decayed form of democracy good and hard, and we’ll be told it should feel good. And that’s a fact.

sentiments over sense

See also Head, Heart and Science

Tom Wolfe tells the story about the Revenge of the Humanities against science and engineering disciplines. Synopsis and link to full essay in post Warmists and Rococo Marxists.

Spring 2021: Warm is Cold, and Down is Up

The cold Spring this year is triggering responses turning natural factors upside down and backwards, confusing causes and effects.  For example, this article at Science Daily Snow chaos in Europe caused by melting sea-ice in the Arctic.  The simplistic appeal to “climate change” is typical: “It is the loss of the Arctic sea-ice due to climate warming that has, somewhat paradoxically, been implicated with severe cold and snowy mid-latitude winters.”  In fact, as we shall see below, it is the wavy Polar Vortex causing both cold mid-latitudes from descending Arctic air, and melting ice from intrusions of warmer southern air.  Importantly, global warming theory asserts that adding CO2 causes the troposphere to warm and the stratosphere to cool.  What we are experiencing this Spring is an unstable Polar vortex due to events of Sudden Stratospheric Warming  (SSWs), not cooling.

Seasoned meteorologist Judah Cohen of AER shows the mechanism this way:

My colleagues, at AER and at selected universities, and I have found a robust relationship between two October Eurasian snow indices and the large-scale winter hemispheric circulation pattern known as the North Atlantic or Arctic Oscillation pattern (N/AO).

The N/AO is more highly correlated with or explains the highest variance of winter temperatures in eastern North America, Europe and East Asia than any other single or combination of atmospheric or coupled ocean-atmosphere patterns that we know of. Therefore, if we can predict the winter N/AO (whether it will be negative or positive) that provides the best chance for a successful winter temperature forecast in North America but certainly does not guarantee it.

He goes on to say that precipitation is the key, not air temperatures, and ENSO is a driving force:

As long as I have been a seasonal forecaster, I have always considered El Nino/Southern Oscillation (ENSO) as a better predictor of precipitation than temperature across the Eastern US. I think this is supported by the observational or statistical analysis as well as the skill or accuracy of the climate models.

There have been recent modeling studies that demonstrate that El Nino modulates the strength and position of the Aleutian Low that then favors stratospheric warmings and subsequently a negative winter N/AO that are consistent with our own research on the relationship between snow cover and stratospheric warmings. So the influence of ENSO on winter temperatures in the Mid-Atlantic and the Northeast may be greater than I acknowledge or that is represented in our seasonal forecast model.

Summary

As Cohen’s diagram shows, there is an effect from warming, but in the stratosphere. Global warming theory claims CO2 causes warming in the troposphere and cooling in the stratosphere. So whatever is going on, it is not due to CO2.

Cohen’s interview with the Washington Post.

its-easier-to-fool-people-than-to-convince-them-that-they-have-been-fooled


The current situation is described in Cohen’s most recent post at his Arctic Oscillation blog:

The stratospheric PV always disappear in the spring due to the increasing solar radiation in the polar stratosphere. However, during some springs in addition to the radiative warming of the polar stratosphere, there is also dynamic warming of the polar stratosphere due to the absorption of upwelling Wave Activity Flux (WAFz) from the troposphere. This occurred last spring, which did result in a cool May and even some rare snowfall in the Northeastern US. The predicted return of Ural blocking coupled with Northeast Asia/northern North Pacific troughing is conducive to more active WAFz. The latest PV animation (see Figure ii) shows the stratospheric PV filling (weakening) and meandering over the northern Asia in response to the more active WAFz. This could be the beginning of a dynamically assisted Final Warming that could result in a period of cooler temperatures in parts of the mid-latitudes.

imagesj5oh

Figure ii. Observed and predicted daily geopotential heights (dam; contours) and anomalies (shading) through April 21, 2021. The forecast is from the 00Z 5 April 2021 GFS ensemble.

Background is at post No, CO2 Doesn’t Drive the Polar Vortex 

graphic20-20polarvortex_explained_updated2001291920-204034x2912-1


The Green Mirage

Mirage (2)

John Constable writes at Civitas The Green Mirage: Why a Low-Carbon Economy May be Further Off Than We Think.  Excerpts in italics with my bolds and images.  h/t Real Clear Public Affairs

Spain renewables

Findings:

  • The prospects for a sustainable, low-carbon economy as the result of current UK national and EU-wide policies are poor.
  • Empirical experience in Spain and Germany shows that the costs of supporting renewable energy generation are too high.
  • Rising employment in the renewable energy sector compared to the wider UK economy stems from unsustainably high subsidies.
  • Renewables are naturally less productive, so as they are relentlessly pursued, a painful rebalancing of the economy will occur, with fewer jobs and less economic growth.

green-and-environment

Bottom Line: The current prospects for a sustainable low-carbon economy are poor in both the UK and across the European Union (EU). Germany and Spain have already clearly shown what happens when state coercion forces such a dramatic shift to less reliable and more costly renewable energy systems: unsustainably high subsidies, fewer jobs, and reduced economic growth.

Whatever the longer-term potential for a viable and prosperous global economy with a low-emissions profile, the present study demonstrates that the prospects for a self-sustaining low-carbon economy as the result of current UK national and EU-wide policies are poor.

The problem is that these policies for such a shift to renewable energy systems demand high levels of state coercion. This has the risk of stagnating economic growth and leading to lower levels of invention and innovation, thus appearing to be a weak preparation for reduced usage of fossil fuels.

In addition, empirical experience in Spain and Germany shows that the costs of supporting renewable energy generation is overly high, compared to low-carbon alternatives, and almost certainly has, over time, net economic effects that are negative both in terms of gross domestic product and employment.

An age of subsistence energy generation appears to be dawning. Overly high subsidies to force renewable energy into the system erode jobs in other sectors of the economy.

Finally, analysis for the EU suggests that the net effects of such policies would only be marginally positive if the EU retains a high share of the world export market in renewable energy technologies – something that appears rather unlikely.

Read the full study here.

Footnote:  Excerpt from the full study:

In an interview with an environmental journalist for Ecoseed in early 2011, a spokesman for the industry body ASIF (Asociación de la Industria Fotovoltaica) remarked ‘The government cheated the solar investors by changing the law after it has lured them to invest their money in PV power plants… If you know that the government would change the law, you will never have invested in that technology and never have put your money in that market’.22 This implicitly concedes that the sector was from the outset likely to be a long-term client of the state, unable to survive without support, and should serve as a warning to other governments hoping to create independent renewables industries through subsidy.

green-octopus-10270