No, Grist, MSN, et al: CO2 Is Not Making Oceans Boil

The Climate Crisis media network is announcing a new claim that rising CO2 is causing recent ocean warming, proving it’s dangerous and must be curtailed. Examples in the last few days include these:
Finally, an answer to why Earth’s oceans have been on a record hot streak Grist
Ocean warming 4 times faster than in 1980s — and likely to accelerate in coming decades MSN
News spotlight: Fossil fuels behind extreme ocean temperatures, study says. Conservation International
Ocean temperature rise accelerating as greenhouse gas levels keep rising UK Natural History Museum
The surface of our oceans is now warming four times faster than it was in the late 1980s The Independent UK
Oceans Are Warming Four Times Faster as Earth Traps More Energy Bloomberg Law News
All this hype deriving from one study,
and ignoring the facts falsifying that narrative.
Fact: Historically, ocean natural oscillations drive observed global warming.
The long record of previous warmings prior to the satellite record shows that the entire rise of 0.8C since 1947 is due to oceanic, not human activity.

The animation is an update of a previous analysis from Dr. Murry Salby. These graphs use Hadcrut4 and include the 2016 El Nino warming event. The exhibit shows since 1947 GMT warmed by 0.8 C, from 13.9 to 14.7, as estimated by Hadcrut4. This resulted from three natural warming events involving ocean cycles. The most recent rise 2013-16 lifted temperatures by 0.2C. Previously the 1997-98 El Nino produced a plateau increase of 0.4C. Before that, a rise from 1977-81 added 0.2C to start the warming since 1947.
Importantly, the theory of human-caused global warming asserts that increasing CO2 in the atmosphere changes the baseline and causes systemic warming in our climate. On the contrary, all of the warming since 1947 was episodic, coming from three brief events associated with oceanic cycles.
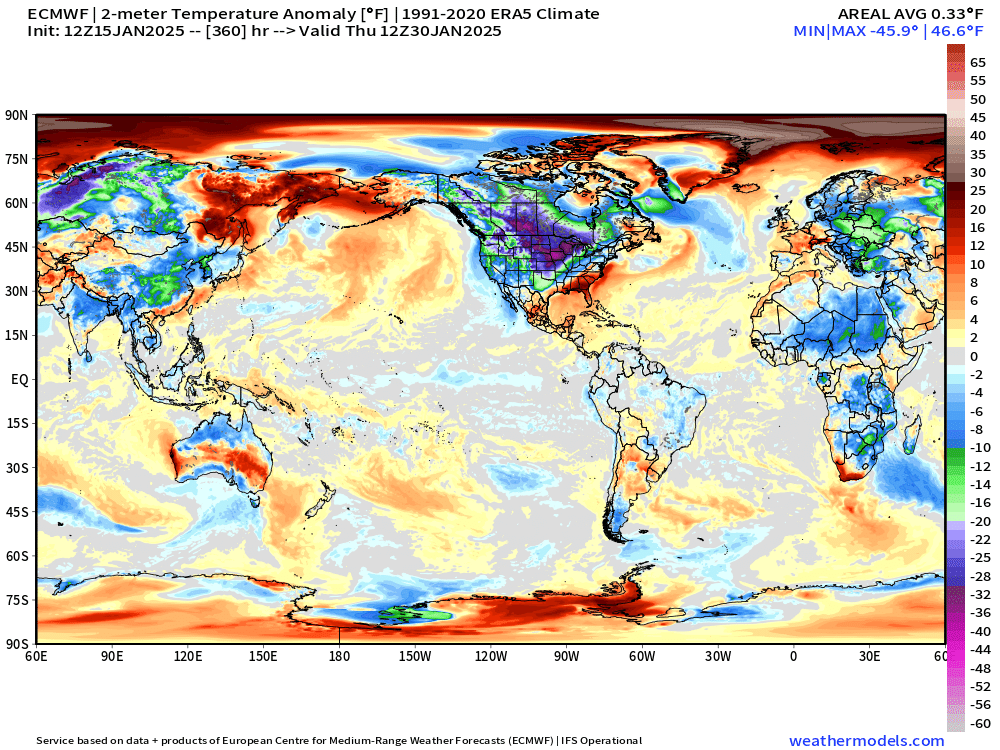
Fact: Recent rise in SST was driven by ENSO and N. Atlantic Anomalies.
And now in 2024 we have seen an amazing episode with a temperature spike driven by ocean warming in all regions, along with rising NH land temperatures, now dropping below its peak.
The chart below shows SST monthly anomalies as reported in HadSST4 starting in 2015 through December 2024. A global cooling pattern is seen clearly in the Tropics since its peak in 2016, joined by NH and SH cycling downward since 2016, followed by rising temperatures in 2023 and 2024.

To enlarge, open image in new tab.
Note that in 2015-2016 the Tropics and SH peaked in between two summer NH spikes. That pattern repeated in 2019-2020 with a lesser Tropics peak and SH bump, but with higher NH spikes. By end of 2020, cooler SSTs in all regions took the Global anomaly well below the mean for this period. A small warming was driven by NH summer peaks in 2021-22, but offset by cooling in SH and the tropics, By January 2023 the global anomaly was again below the mean.
Now in 2023-24 came an event resembling 2015-16 with a Tropical spike and two NH spikes alongside, all higher than 2015-16. There was also a coinciding rise in SH, and the Global anomaly was pulled up to 1.1°C last year, ~0.3° higher than the 2015 peak. Then NH started down autumn 2023, followed by Tropics and SH descending 2024 to the present. After 10 months of cooling in SH and the Tropics, the Global anomaly came back down, led by NH cooling the last 4 months from its peak in August. It’s now about 0.1C higher than the average for this period. Note that the Tropical anomaly has cooled from 1.29C in 2024/01 to 0.66C as of 2024/12.
Fact: Empirical measurements show ocean warms the air, not the other way around.
One can read convoluted explanations about how rising CO2 in the atmosphere can cause land surface heating which is then transported over the ocean and causes higher SST. But the interface between ocean and air is well described and measured. Not surprisingly it is the warmer ocean water sending heat into the atmosphere, and not the other way around.

The graph displays measures of heat flux in the sub-tropics during a 21-day period in November. Shortwave solar energy shown above in green labeled radiative is stored in the upper 200 meters of the ocean. The upper panel shows the rise in SST (Sea Surface Temperature) due to net incoming energy. The yellow shows latent heat cooling the ocean, (lowering SST) and transferring heat upward, driving convection. [From An Investigation of Turbulent Heat Exchange in the Subtropics by James B. Edson]
As we see in the graphs ocean circulations change sea surface temperatures which then cause global land and sea temperatures to change. Thus, oceans make climate by making temperature changes.
Fact: On all time scales, from last month’s observations to ice core datasets spanning millennia, temperature changes first and CO2 changes follow.
Previously I have demonstrated that changes in atmospheric CO2 levels follow changes in Global Mean Temperatures (GMT) as shown by satellite measurements from University of Alabama at Huntsville (UAH). That background post is included in the posting referenced later below.
My curiosity was piqued by the remarkable GMT spike starting in January 2023 and rising to a peak in April 2024, and then declining afterward. I also became aware that UAH has recalibrated their dataset due to a satellite drift that can no longer be corrected. The values since 2020 have shifted slightly in version 6.1, as shown in my recent report Ocean Leads Cooling UAH December 2024.
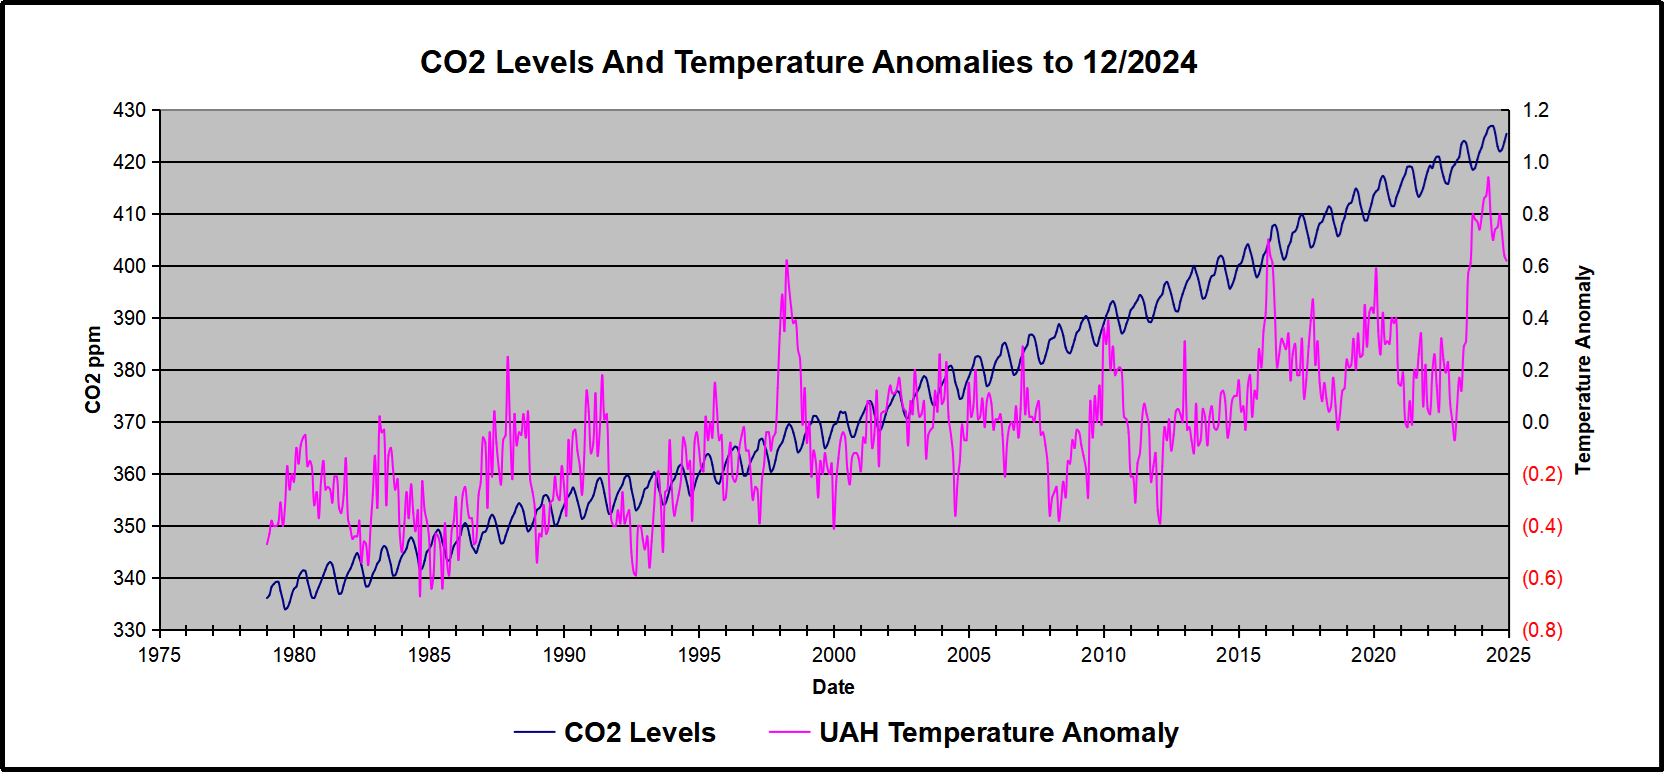
I tested the premise that temperature changes are predictive of changes in atmospheric CO2 concentrations. The chart above shows the two monthly datasets: CO2 levels in blue reported at Mauna Loa, and Global temperature anomalies in purple reported by UAHv6.1, both through December 2024. Would such a sharp increase in temperature be reflected in rising CO2 levels, according to the successful mathematical forecasting model? Would CO2 levels decline as temperatures dropped following the peak?
The answer is yes: that temperature spike resulted
in a corresponding CO2 spike as expected.
And lower CO2 levels followed the temperature decline.
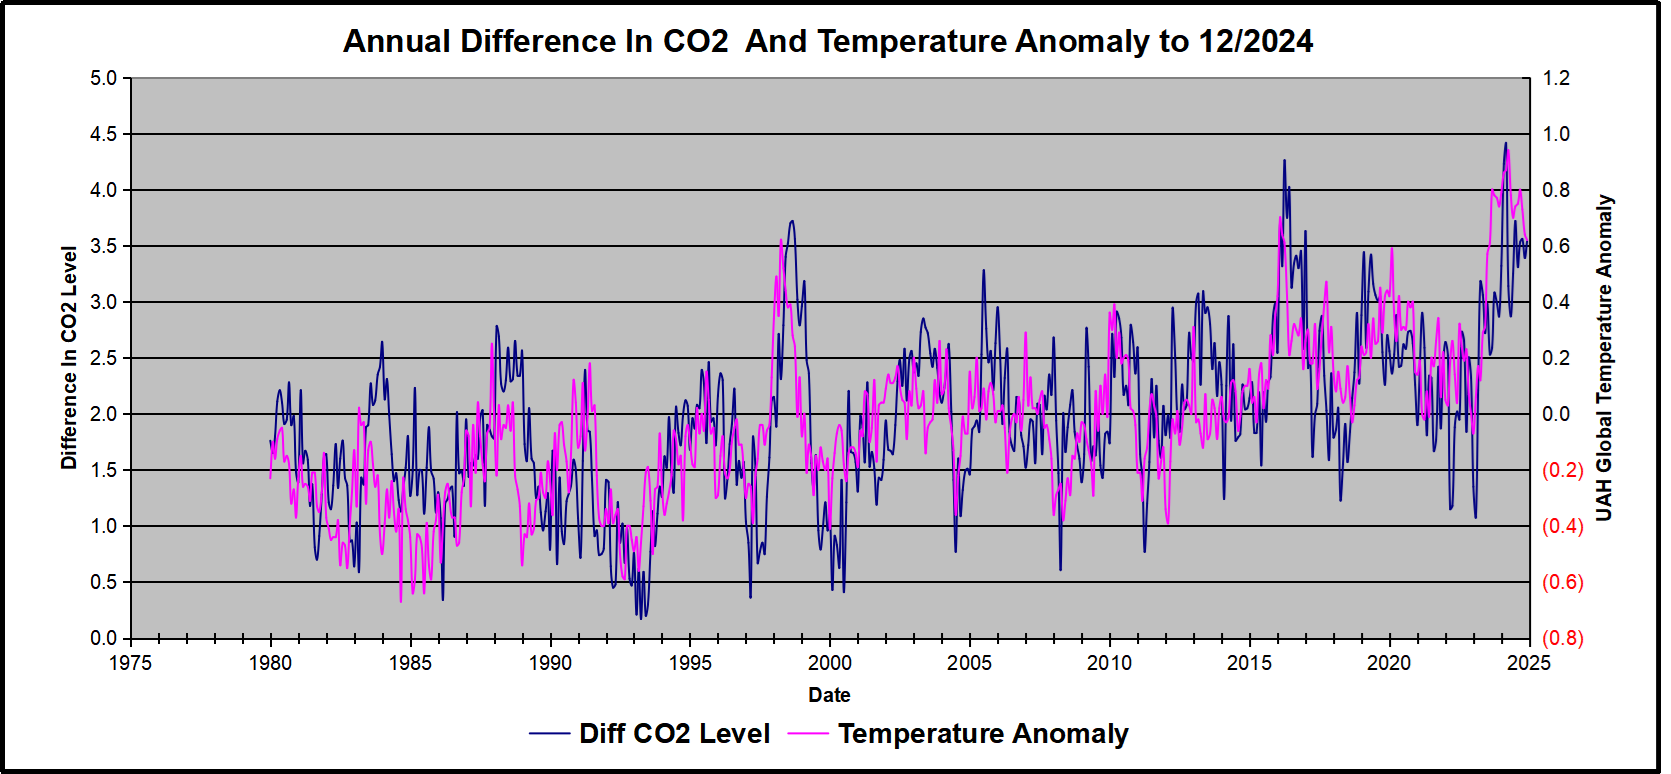
Above are UAH temperature anomalies compared to CO2 monthly changes year over year.
Changes in monthly CO2 synchronize with temperature fluctuations, which for UAH are anomalies now referenced to the 1991-2020 period. CO2 differentials are calculated for the present month by subtracting the value for the same month in the previous year (for example December 2024 minus December 2023). Temp anomalies are calculated by comparing the present month with the baseline month. Note the recent CO2 upward spike and drop following the temperature spike and drop.
Summary
Changes in CO2 follow changes in global temperatures on all time scales, from last month’s observations to ice core datasets spanning millennia. Since CO2 is the lagging variable, it cannot logically be the cause of temperature, the leading variable. It is folly to imagine that by reducing human emissions of CO2, we can change global temperatures, which are obviously driven by other factors.


