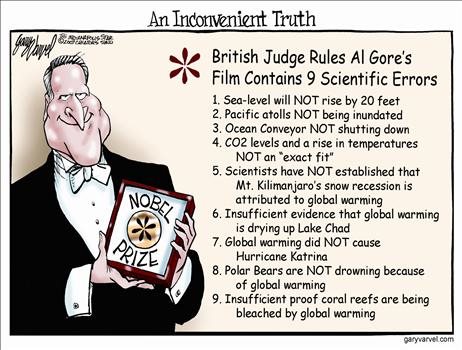
Twenty years after Al Gore’s apocalyptic movie “An Inconvenient Truth,” the Trump administration has put the final nail in the coffin of the lie that scared a generation into believing the planet was about to explode in flames if they kept using fossil fuels.
In what the White House calls “the largest deregulatory action in American history,” the EPA on Thursday will repeal an Obama-era proclamation that has mandated greenhouse-gas regulations for 17 years,
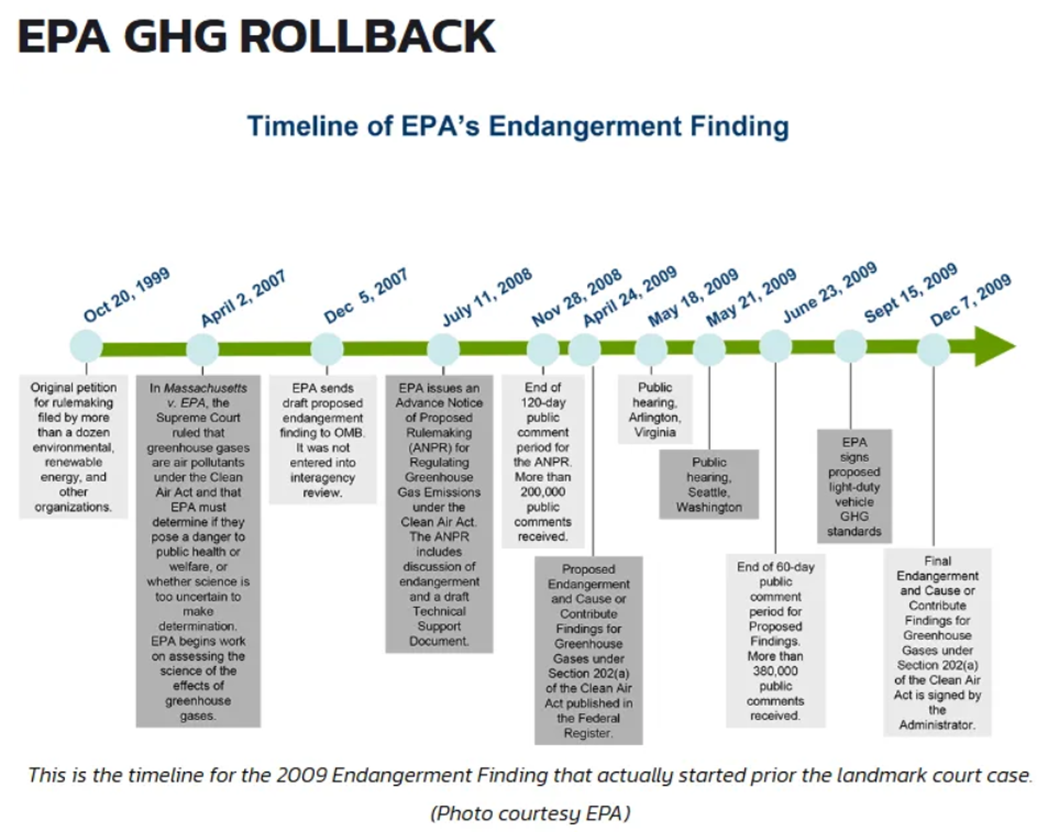
The 2009 “endangerment finding” has been the primary climate handbrake on American industry, forming the legal justification for increasingly punitive greenhouse-gas regulations.
Rescinding it would “save the American people $1.3 trillion in crushing regulations,” White House press secretary Karoline Leavitt said this week, with the EPA projecting an average saving of $2,400 per vehicle and further savings on farm machinery, soon to be freed from the complex extra circuitry required to restrict emissions.
Yay! It’s about time that common sense returned to energy policy.
During the recent bone-chilling winter storm that hit 200 million Americans across more than 35 states, it wasn’t wind and solar that kept the lights on but fossil fuels.
Fueling US prosperity
According to the Florida Municipal Power Agency, 90% of power generation in the country at the height of the storm was natural gas, coal, nuclear or oil.
Cheap, abundant energy fueled America’s prosperity, but charlatans citing pseudoscience have conspired to send us back to the dark ages with hyperbolic predictions that keep falling apart.
As we keep sailing past the various doomsday deadlines set by climate shucksters from Gore to Greta Thunberg, the public has been waking up to the hoax.
A Gallup poll found in 2024 only 2 percent of Americans cite climate change or the environment as their main concern.
It’s telling that green activists have been relatively silent in the face of a full-scale assault by Trump and his Cabinet on climate shibboleths the past year. He lauded EPA administrator Lee Zeldin and his rapid fire deregulation moves as the administration’s “secret weapon” in his war against the “war on coal.”
“Biden and the radical left wanted to abolish coal,” Trump told the assembled group of coal miners in hard hats and hi-vis vests in the East Room.
“They did everything they could . . . but on Day 1 of this administration I ended the war on coal. We terminated the green new scam and we withdrew from the unfair, one-sided Paris climate deal.”
He also boasted that he has saved 74 coal fired power plants from extinction and announced that the Tennessee Valley Authority has just taken two coal plants off the chopping board.
Meanwhile, buoyed by falling electricity prices, the first American aluminum smelter in 50 years is now slated to be built in Oklahoma.
Net-zero policies adopted by in Europe, Canada and Australia, with their blind reliance on wind and solar, have failed. Add the huge new demand for power by data processing centers underpinning artificial intelligence, and the climate fiction has become impossible to sustain.
Now, policymakers and powerful influencers are hoping they can sidle away from the disastrous decisions they forced on us with false pretenses.
Climate activism out
Billionaire activistBill Gates has renounced climate alarm, declaring quietly last October that climate change “will not lead to humanity’s demise” and “the global temperature doesn’t tell us anything about the quality of people’s lives.”
Thank you, Captain Obvious. Maybe there are more pressing problems in the world that we could more usefully spend his money to solve.
On Wall Street, ESG (environment, social and government) stocks have fallen out of favor.
Public disillusionment is happening as the underpinnings of the climate hoax have collapsed.
In congressional testimony last week Treasury Secretary Scott Bessent pointed to the “monumental retraction” of Nature magazine’s infamous paper on “The Economic Commitment of Climate Change” which claimed the cost of global warming would be $38 trillion per year by 2049. It was retracted two months ago because, Nature admitted, the errors were “too substantial for a correction.”
Bessent declared that the repudiation of the influential economic modeling “laid bare the radical left’s apocalyptic hyperbole on climate change . . .
“This fatally fraught paper, with errors far too substantial for correction, has been frequently used and abused to justify bad policymaking around the world, undermining both energy abundance and better living standards.”
These days, when Energy Secretary Chris Wright meets his European and Australian counterparts behind closed doors, they confide to him that he “may be right on the data,” but the public still “feels” climate alarm is real.
As he points out, that’s because they’ve been lied to for a quarter of a century.
The truth hurts, but it’s better than the alternative.
[Top] Comparison of the harmonic empirical global climate model under the SSP2-4.5 scenario with the HadCRUT4.6 record (1850–2021) alongside the burning ember diagrams representing the five primary global Reasons for Concern (RFCs) under low-to-no adaptation scenarios, as reported by the IPCC (2023) AR6. [Bottom] Summary and analysis of the projected impacts and risks of global warming for the 2080–2100 period compared to the climate “thermometer” projections from Climate Action Tracker (2024). Credit: Gondwana Research (2026). DOI: 10.1016/j.gr.2025.05.001
Current global climate models (GCMs) support with high confidence the view that rising greenhouse gases and other anthropogenic forcings account for nearly all observed global surface warming—slightly above 1 °C—since the pre-industrial period (1850–1900). This is the conclusion presented in the IPCC’s Sixth Assessment Report (AR6) published in 2021.
Figure 3: CMIP6 GCM ensemble mean simulations spanning from 1850 to 2100, employing historical effective radiative forcing functions from 1850 to 2014 (see Figure 1C) and the forcing functions based on the SSP scenarios 1-2.6, 2-4.5, 3-7.0, and 5-8.5. Curve colors are scaled according to the equilibrium climate sensitivity (ECS) of the models. The right panels depict the risks and impacts of climate change in relation to various global Reasons for Concern (RFCs) (IPCC, 2023). (Adapted from Scafetta, 2024).
Moreover, the GCM projections for the 21st century, produced under different socioeconomic pathways (SSPs), underpin estimates of future climate impacts and guide net-zero mitigation strategies worldwide.
The prevailing interpretation is that only net-zero climate policies can keep future climate change-related damages within acceptable limits. Yet such policies carry extremely high economic and societal costs, making it essential to assess whether these certain and immediate costs are fully justified by the current state of climate science.
On the other hand, a closer examination of observational datasets, paleoclimate evidence, and model performance reveals a more intricate picture—one that merits open discussion among students, researchers, and anyone interested in how climate science is evolving.
My study “Detection, attribution, and modeling of climate change: Key open issues,” published in Gondwana Research, examines several unresolved questions in climate detection, attribution, and modeling. These issues concern the foundations of how past climate changes are interpreted and how future ones are projected, and they matter because climate projections influence decisions that will shape economies and societies for decades. [My synopsis: Scafetta: Climate Models Have Issues. ]
A central theme is natural climate variability. Across the Holocene—the last 11,700 years—the climate system exhibited a Climate Optimum(6,000–8,000 years ago) and repeated oscillations: multidecadal cycles, centennial fluctuations, and millennial-scale reorganizations.
Some longer cycles are well known, such as the quasi-millennial Eddy cycle, associated with the Medieval and Roman warm periods, and the 2,000–2,500-year Hallstatt–Bray cycle. These patterns appear in ice cores, marine sediments, tree rings, historical documents, and in both climate and solar proxy records.
Current GCMs, however, struggle to reproduce the Holocene Optimum and these rhythms. They generate internal variability, but not with the correct timing, amplitude, or persistence. When a model cannot capture the natural “heartbeat” of the climate system, distinguishing human-driven warming from background variability becomes challenging. This is particularly relevant for interpreting the warming observed since 1850–1900, because both the Eddy and Hallstatt–Bray cycles have been in rising phases since roughly the 1600s.
Figure 1. Anthropgenic and natural contributions. (a) Locked scaling factors, weak Pre Industrial Climate Anomalies (PCA). (b) Free scaling, strong PCA Source: Larminat, P. de (2023)
A portion of the post-industrial warming could therefore stem from these long natural oscillations, which are expected to peak in the 21st century and in the second half of the third millennium, respectively.
Another key issue concerns the global surface temperature datasets that serve as the backbone of global warming assessment. These datasets are essential but not perfect.
Urbanization, land-use changes, station relocations, and instrumentation shifts can introduce non-climatic biases. Many corrections exist, yet uncertainties persist. Even small unresolved biases can influence long-term trends.
The study highlights well-known discrepancies: satellite-based estimates of lower-troposphere temperatures since 1980 show about 20–30% less warming than surface-based records, particularly over Northern Hemisphere land areas.
Recent reconstructions based on confirmed rural stations also show significantly weaker secular warming. These differences underscore the need for continued scrutiny of observational records.
Solar and astronomical influences represent another area where science is still evolving. The sun varies in ways not fully captured by the simplified irradiance reconstructions used in many models. Multiple lines of evidence indicate that the climate system responds not only to total solar irradiance but also to spectral variations, magnetic modulation, and indirect effects on atmospheric circulation.
These mechanisms are still under investigation, and their representation in models remains incomplete, even though empirical evidence suggests that they may play a dominant role—potentially more influential than the simple total-solar-irradiance forcing currently implemented.
Moreover, despite ongoing controversy surrounding long-term solar variability, current GCMs are typically forced with solar reconstructions that exhibit extremely low secular variability. This helps explain why these models attribute nearly 0 °C of the observed post 1850–1900 warming to solar changes and simultaneously fail to reproduce the millennial-scale oscillations evident in paleoclimate records.
Direct comparisons between GCM global surface temperature simulations and observations also show that the models do not reproduce the quasi-60-year climatic oscillation associated with the 1940s warming period, and they tend to overestimate the warming observed since 1980. This “hot model” problem has been documented in several studies and appears to affect a substantial fraction of current GCMs.
All of this connects to a key parameter in climate science: equilibrium climate sensitivity (ECS). The canonical estimate—around 3 °C for a doubling of CO₂, with a likely range of 2.5–4.0 °C according to the IPCC—derives largely from model-based assessments.
Empirical studies, including those that account more explicitly for natural variability, often suggest lower values, sometimes around 2.2 ± 0.5 °C, or even as low as 1.1 ± 0.4 °C if long-term solar luminosity varies significantly and if additional solar-related mechanisms influence the climate system—mechanisms not included in current models. If ECS is lower than commonly assumed, projected 21st-century warming would be substantially reduced under all SSP scenarios.
These graphs use Hadcrut4 and include the 2016 El Nino warming event. The exhibit shows since 1947 GMT warmed by 0.8 C, from 13.9 to 14.7, as estimated by Hadcrut4. This resulted from three natural warming events involving ocean cycles. The most recent rise 2013-16 lifted temperatures by 0.2C. Previously the 1997-98 El Nino produced a plateau increase of 0.4C. Before that, a rise from 1977-81 added 0.2C to start the warming since 1947.
The interplay between natural and anthropogenic factors is definitely more nuanced than often portrayed. When empirical models that include natural oscillations are used to project future temperatures, the result is typically moderate future warming rather than extreme trajectories. This raises important questions about the scientific basis for the most aggressive mitigation pathways.
The figure compares the warming expected from GCMs, as assessed by the IPCC, with the associated relative risks, alongside the expectations derived from the empirical modeling proposed in the paper. While net-zero pathways such as SSP1 are considered necessary to meet the Paris Agreement target of limiting global warming to below 2 °C by 2100, empirical considerations suggest that the same target could also be achieved under the far more moderate SSP2 scenario.
This distinction has major global economic implications, because the
prevailing climate-crisis narrative does not appear to be fully supported by the evidence, and far less costly adaptation strategies could be
more appropriate than highly aggressive mitigation policies.
The study stresses the importance of addressing the key open questions of climate science. Climate policy should be informed by the full spectrum of scientific evidence, including uncertainties and alternative interpretations.
The arctic ice extents are now reported through mid-February 2026, showing rising refreezing rates bringing Arctic ice extents within 200k km2 of the 20-year average. Remarkably, the last two days virtually matched the 2025 annual extent maximum of 14.48M km2 on day 80 of that year, compared to 14.44 on day 43 in 2026.
The chart below shows the 20-year averages for Arctic ice extents mid-Febrauary along with 2026 and 2025, as well as SII v.4.
As stated previously, likely due to a wavy polar vortex, MASIE 2026 refroze slowly in January reaching a deficit of 622k km2 on day 26. Since then ice grew at a higher rate, ending this period 176k km2 below average, or 1% down. Note that compared to day 44 last year, 2026 ice is more than half a Wadham greater, 656k km2. And as mentioned above, 2025 will not match yesterday until day 80. Note SII v.4 tracks lower than MASIE throughout, on average in deficit by 242K km2.
Region
2026044
Average day 44
2026-Ave.
2025044
2026-2025
(0) Northern_Hemisphere
14427481
14603337
-175856
13771518.64
655962
(1) Beaufort_Sea
1071070
1070384
686
1071000.73
69
(2) Chukchi_Sea
966006
965785
222
965989.12
17
(3) East_Siberian_Sea
1087137
1087132
5
1087137.23
0
(4) Laptev_Sea
897845
897838
7
897844.8
0
(5) Kara_Sea
935023
909437
25586
911762.37
23261
(6) Barents_Sea
649606
566421
83185
434920.5
214686
(7) Greenland_Sea
772110
625671
146439
635758.41
136351
(8) Baffin_Bay_Gulf_of_St._Lawrence
1040295
1429059
-388764
1335264.28
-294969
(9) Canadian_Archipelago
854931
853531
1399
854877.96
53
(10) Hudson_Bay
1260870
1260595
276
1260903.34
-33
(11) Central_Arctic
3235930
3204874
31056
3195022.33
40907
(12) Bering_Sea
689769
671512
18256
333643.58
356125
(13) Baltic_Sea
155657
88990
66666
35593.84
120063
(14) Sea_of_Okhotsk
742439
914421
-171982
720462
21977
The table shows that most regions are close to or above the 20-year average. Two major deficits are in Baffin Bay and Sea of Okhotsk, partly offset by several smaller surpluses, mostly in Greenland Sea, Barents and Bering seas.
Some thoughts from my browser AI. My Question: What are the legal matters, such as major questions requiring congressional action, that favor ending EPA CO2 Endangerment Finding?
Search Assistant Reply:
The legal matters surrounding the repeal of the EPA’s CO2 Endangerment Finding involve the major questions doctrine, which suggests that significant regulatory authority should not be assumed by agencies without clear congressional authorization. This doctrine has been reinforced by recent Supreme Court rulings, indicating that the EPA may need explicit legislative backing to regulate greenhouse gases under the Clean Air Act, thus favoring the argument for ending the Endangerment Finding.
Legal Matters Surrounding the EPA CO2 Endangerment Finding
Major Questions Doctrine
The major questions doctrine is a legal principle that limits the authority of executive agencies, like the EPA, to make significant regulatory decisions without clear congressional authorization. This doctrine has been increasingly applied by the Supreme Court to ensure that major political or economic issues are addressed by Congress rather than delegated to agencies.
Definition: The doctrine asserts that agencies must have explicit congressional authorization to regulate matters of significant economic or political importance.
Recent Cases: The Supreme Court’s decision in West Virginia v. EPA (2022) emphasized that agencies must point to clear congressional authorization for their regulatory actions, particularly when those actions have broad implications.
Implications for the Endangerment Finding
The repeal of the EPA’s CO2 Endangerment Finding could be supported by arguments based on the major questions doctrine:
Lack of Clear Authorization: Opponents of the Endangerment Finding may argue that the Clean Air Act does not provide the EPA with the authority to regulate greenhouse gases based on global climate change concerns, as these gases are not traditional air pollutants.
Historical Context: The Endangerment Finding was established following the Massachusetts v. EPA (2007) ruling, which recognized greenhouse gases as pollutants. However, the current administration may argue that the regulatory framework established under this finding lacks explicit congressional backing for such extensive regulatory power. [Note: AI got this wrong. Mass v. EPA only ruled EPA could itself decide GHGs are pollutants subject to its regulation. That judgment by EPA regarding auto emissions in 2009 is now rescinded by EPA in 2026.]
Potential Legal Challenges
Court Challenges: Environmental groups are likely to challenge the repeal in court, arguing that the EPA’s authority to regulate greenhouse gases is well-supported by the Clean Air Act and previous Supreme Court rulings.
Future Regulations: If the Endangerment Finding is repealed, it could undermine existing regulations on vehicle emissions and other sources of greenhouse gases, leading to further legal disputes over the EPA’s regulatory scope.
The intersection of the major questions doctrine and the Endangerment Finding highlights the ongoing legal debates regarding the EPA’s authority and the role of Congress in environmental regulation.
From SCOTUS Blog June 30, 2022
The Supreme Court on Thursday truncated the Environmental Protection Agency’s power to regulate greenhouse gases. The ruling may hamper President Joe Biden’s plan to fight climate change and could limit the authority of federal agencies across the executive branch.
By a vote of 6-3, the court agreed with Republican-led states and coal companies that the U.S. Court of Appeals for the District of Columbia Circuit was wrong when it interpreted the Clean Air Act to give the EPA expansive power over carbon emissions. The decision, written by Chief Justice John Roberts, was handed down on the final opinion day of the 2021-22 term.
Turning to the merits of the case, Roberts wrote that the EPA’s effort to regulate greenhouse gases by making industry-wide changes violated the “major-questions” doctrine – the idea that if Congress wants to give an administrative agency the power to make “decisions of vast economic and political significance,” it must say so clearly.
Section 7411 of the Clean Air Act, Roberts reasoned, had been “designed as a gap filler and had rarely been used in the preceding decades.” But with the CPP, Roberts observed, the EPA sought to rely on Section 7411 to exercise “unprecedented power over American industry.” “There is little reason to think Congress assigned such decisions to” the EPA, Roberts concluded, especially when Congress had previously rejected efforts to enact the kind of program that the EPA wanted to implement with the CPP.
“Capping carbon dioxide emissions at a level that will force a nationwide transition away from the use of coal to generate electricity may be a sensible ‘solution to the crisis of the day,’” Roberts wrote. But only Congress, or an agency with express authority from Congress, can adopt a “decision of such magnitude and consequence.”
Roberts’ full-throated embrace of the major-questions doctrine – a judicially created approach to statutory interpretation in challenges to agency authority – likely will have ripple effects far beyond the EPA. His reasoning applies to any major policymaking effort by federal agencies.
In a concurring opinion that was joined by Justice Samuel Alito, Justice Neil Gorsuch emphasized that the dispute before the court involved “basic questions about self-government, equality, fair notice, federalism, and the separation of powers.” The major-questions doctrine, Gorsuch wrote, “seeks to protect against ‘unintentional, oblique, or otherwise unlikely’ intrusions on these interests” by requiring federal agencies to have “clear congressional authorization” when they address important issues. Whether coal- and gas-fired power plants “should be allowed to operate is a question on which people today may disagree, but it is a question everyone can agree is vitally important.”
Kathryn Porter deconstructs the zero carbon mantra in the above video The Electrification Delusion. For those who prefer to read, below is a transcript with my bolds and added images.
The starting point that people make is that we have to decarbonize. They take that position without actually having examined the costs and the benefits of doing that. What’s happening is that our emissions are just moving to somewhere else and are increasing as a result.
People say, oh, well, nuclear is expensive. It is, but it’s expensive because we chose to make it expensive. We invented a whole load of rules and regulations around it that actually are not useful and not beneficial.
We started subsidizing wind farms in 1990. If they were economic, they would not require subsidies. You hear people like Dale Vince saying, oh, yeah, we should all have renewables or be so much cheaper. And I always ask him on social media, if renewables are so much cheaper, why are ecotricity tariffs higher than the price cap? Never once has he responded to that.
LW: Hello and welcome to this special episode of The Skeptic. I’m your host, Laurie Wostel, an associate editor at The Daily Skeptic.
Now, electrification, can the grid cope? Well, that’s the title of a new report by the independent energy consultant and the woman behind WhatLogic, Kathryn Porter. And I’m very pleased to be joined by her today. So electrification is the big crusade of the policymaking classes, the green blob, as we might call it. Why write this report, Kathryn, and why is it so important for us to know about the impacts of this?
KP: So I was commissioned to write this report. And the brief was to examine what the impact of electrification would be on the British power grid if government targets were met. So, you know, I set out what the targets are. I look at what I think the chances are that they will be met. I look at what the impact on the grid would be if they were met.
I throw in a bit about AI data centres, because although that’s not formally part of electrification, it could have a significant impact on power demand and therefore the state of the grid. And I do a few case studies as well over the European countries. So I looked at Norway, the Netherlands and Germany to see how things are looking there as well.
LW: And so before we get into the specifics of the report, I mean, to begin with, we’re always told, aren’t we, that electrification is going to be this panacea for the economy and the green transition, so-called. Why is it believed to be such an unqualified good?
KP: Well, the starting point that people make is that we have to decarbonise. And they take that position without actually having examined the costs and the benefits of doing that. So there’s a uniform response to anything that has a carbon content, which is we need to get rid of it. But obviously, not all sources of carbon dioxide are equal. And some of the things that you might do instead could turn out to be more harmful than those carbon emitting activities are in the first place.
LW: So, you know, this is why they’re being promoted the way they are, because there’s been a lack of analysis as to, first of all, the extent to which a thing should be decarbonised. It’s just assumed that it should be. And secondly, that the electrification route isn’t more harmful than the original action was in the first place. And so with that justification, there are these extremely ambitious targets, even if in some cases they do keep being pushed back. But I suppose outline for us, Kathryn, how far the green zealots want to go.
KP: Well, I mean, they fundamentally want to electrify everything, but they also want us to reduce our consumption. This tends to be buried in the small print, but you can infer it from the data that are presented. So you have, for example, hidden assumptions within NISO forecasts that suggest we might heat our homes less or travel less. Things that really just don’t have any basis in any sort of evidence and data. Nobody’s ever asked people if they’re willing to travel less or heat their homes less. It was just assumed. Now, NISO has actually rolled back on some of its explicit assumptions in those regards.
But it’s interesting if you look at its future energy scenarios, that it’s not actually consistent across the scenarios on its underlying assumptions of things like comfort levels and distance travelled, which is something of a problem. And it does suggest that the analysis isn’t being done on an equal and fair basis. Certainly when you look at the more recent report they put out in December on the economics of the future energy scenarios, you see them making all sorts of asymmetrical assumptions, very unrealistic cost of capital for things like solar and hydrogen.
They treat the falling behind scenario as a counterfactual when it’s explicitly in the scenarios not a counterfactual. But a lot of the other cost elements are expressed in relation to that scenario rather than on their own basis. It’s just not a fair and even treatment of the analysis.
LW: And then, of course, you have to ask the question, why? Why are they not able to put together a fair and unbiased assessment of cost? And I suppose the answer would be that, well, they can have these grand visions for where we’re supposed to get to. But actually, if you had a proper debate about this, if you really inform the country, you’re going to have to travel less. You’re going to have to heat your home less and so on, then, well, people would start rejecting it.
KP: Yeah, of course. And it would cost more and be less reliable. And also, fundamentally, it might be less good for the environment.
And this is the thing that, you know, one of the worst aspects of it. You look at, for example, the push for renewable generation is making electricity very expensive because this renewable generation is intermittent. You have to create all sorts of backups. It has low energy density. So it has much higher grid costs than the alternatives, as well as using more land. It requires more wires.
It’s intermittent. So it has much higher balancing costs. And all of that makes energy more expensive.
So what’s the outcome of that expensive energy is we have deindustrialisation. So industrial output moves from Britain, not just and that’s bad, not just in terms of the economic impact, but also the environmental impact, because then stuff is being made in countries that have dirtier energy, higher emissions. And you also incur transportation emissions and shipping sort of low value bulk items like steel bars halfway around the world.
It’s actually an incredibly dumb thing to do. But that is the outcome of our energy policy. And so there’s this blind push for a certain objective. Let’s build lots of renewables. We have to decarbonise. But actually, that’s not what’s happening. What’s happening is that our emissions are just moving to somewhere else and are increasing as a result. In the meantime, we are destroying large swathes of other countries, for example, in South America, where we’re mining a lot of the minerals that we need for these transition technologies. And you need huge amounts of metal for renewables.
But wind only works less than a third of the time. The capacity factor for wind is less than 30 percent. Now, the government has higher numbers, but they’re just not borne out by actual real data. I looked at the capacity factors for the past year. They’re about 28 percent on average. So, you know, you’re consuming all of these financial and natural resources for something that works less than a third of the time. And there’s never been any debate about whether that’s actually sensible, whether it’s actually environmentally sustainable or not. And there’s just this assumption that because it’s low carbon, everything else is worse. And I don’t believe that.
I think if you really wanted to have a serious effort at decarbonisation, you would be much more serious about nuclear. And people say, oh, well, nuclear is expensive. It is, but it’s expensive because we chose to make it expensive. We invented a whole load of rules and regulations around it that actually are not useful and not beneficial. We should be doing the way South Korea does it, which is faster and vastly cheaper. They’ve built their reactors. They’ve got eight of them now, four in South Korea, four in UAE, at an average cost of five to six billion U.S. dollars. Hinkley Point is going to cost us about 32 billion pounds. So it’s multiples cheaper to build it the way the Koreans are doing.
We could do it in the same way. Certainly on the nuclear side, there’s a few issues around sort of employment rights that would be a little bit different, but that wouldn’t have that much cost or additional time. They’re also building them in eight and a half years, you know, and we’re taking two decades.
This is just it’s a self-inflicted wound. We don’t have to do it that way. We could do it the same way that they do at the same cost and in the same time frames. We just choose not to. So there’s nothing fundamentally, inherently expensive about nuclear. It’s just the way that we do it.
LW: And Kathryn, why is it working so badly?
Oh, well we create all sorts of unnecessary complexities like the fish disco at Hinkley, for example. EDF has got to spend millions of pounds to prevent the deaths of half a trawler’s worth of fish every year. I mean, that’s insane. In the fishing industry, they throw more than that amount of fish back in the sea every year. Just because it’s being killed as a nuclear site doesn’t mean it’s any different outcome for the fish. And also people are more important than fish.
If you look at what the way they treat worker radiation exposure, each new plant is supposed to have a lower worker radiation exposure level than the last one. And that sounds very nice in theory, you know, continuing improvements. But the old advanced gas cooled reactors that are coming to end of life have lower internal radiation levels than you have outside on the street.
So workers going to work in that plant get more radiation exposure in the car park than they do inside the plant. So then what’s the useful benefit of reducing that exposure further? All it does is create costs and engineering challenges that are difficult to solve and pointless. Because if the workers get more radiation exposure in the car park, then, you know, and they can’t.
It’s just it’s just a nonsense. And it just makes everything expensive because somebody on paper thought, oh, yeah, that sounds great. We’ll have a continuing improvement. But they don’t think about what it means in real life. And when you think in terms of what it means in real life, you think, no, that doesn’t make any sense and we shouldn’t do it. And so it’s all these types of things that have crept in over the years when nuclear wasn’t a priority.
The nuclear regulator has an objective to reduce deaths from radiation. Well, you can easily do that by closing all your nuclear reactors and not building any new ones. But that kind of defeats the purpose.
So we need to get away from this risk avoidance mindset. We shouldn’t be seeking to avoid risk. We should be seeking to manage risk in an appropriate way. Lowering the radiation inside the plant to a level lower than on the street outside is not sensible.
LW: And to bring us back to the central contradiction here and muddled thinking. I mean, you’ve mentioned that in terms of nuclear and in terms of where the emissions are going, the total amount of them in the world. But of course, the central one really seems to be that, well, actually, we’re going to be switching over to electricity. We’re going to be electrifying everything, electric cars and all these new technologies at the same time that we’re actually making electricity much, much more expensive. I mean, it’s mad, isn’t it?
KP: It is. We’re making electricity more expensive and less reliable. The cost element is an obvious deterrent to electrifying your heating and transports. And, you know, some of the people who’ve seen my reports, they say, oh, well, I have an electric car and I can charge it at home and it’s way cheaper. Well, well, lucky you. But that’s not the reality for a lot of people. They’re like, oh, yeah, well, I have a heat pump and it works just fine in the winter. Again, lucky you. Right. You probably have a well insulated house. Other people don’t.
So my report looks at what’s correct and true on average, not in specific cases. Anecdotes and data are not the same thing. And unfortunately, too many people critiquing my report are confused between what’s data and what’s an anecdote. And if you look at the data, which is what I do look at in my report, you can see that in most cases it’s more expensive to own an electric car than it is to own a conventional car. And it’s more expensive to own a heat pump than it is to have a gas boiler.
And so these are the facts that the data show. And just because for some people, some people, that’s not the case doesn’t mean it’s not true overall. In the same way, if it was genuinely cheaper to have an electric car, don’t you think that people would just go buy electric cars? You wouldn’t need to have subsidies and mandates and penalise car makers for not selling enough electric cars.
Just a couple of days ago, somebody senior at Volkswagen, I think, or Vauxhall, was saying that there’s just no natural demand for electric cars. It’s not a product that people want to buy. They only buy it through compulsion or subsidy. So if electric cars were desirable and cheaper because cost is something that’s obviously a big motivator for people, then you wouldn’t need to have subsidies or compulsion. People would just go and buy this stuff and they don’t.
Look at wind farms. We’re just signing up new subsidies for wind farms that are not only more expensive than the previous ones, but are now going to be for 20 years. We started subsidising wind farms in 1990 and we’re now offering 20 year subsidies after 35 years of subsidising. We’re now going to offer them 20 year subsidies locking in. So that’ll be more than half a century of subsidies for wind farms. If they were economic, they would not require subsidies. Right.
So all of this just makes energy more expensive and less reliable and less appealing for people. It’s very model thinking. And it’s what happens when you put ideology ahead of data.
LW: And so you mentioned the subsidies. We very recently had allocation round seven of the contracts of difference for renewables generation over the coming years. How did that go? Was it looking good for Ed Miliband and his claims to be bringing down energy bills?
KP: No, it’s the exact opposite. So £94 is where it cleared for offshore wind for 20 year contracts. So last year it cleared £83 for 15 year contracts. So if you were to transpose that £94 onto a 15 year basis, it would probably be around £104. So you should be comparing the £104 with the 83 from last year. Now, last year, Orsted cancelled Hornsea 4, which was the flagship project and by far the biggest volume component of AL6. They cancelled it because £83 wasn’t enough.
They said the economics weren’t good enough. So now you’ve had AL7 coming in at a much, much higher price and for 20 years. So now that’s locking in this high level of cost for 20 years. So it doesn’t matter what happens to wholesale prices. These wind farms will get guaranteed index linked £94 per megawatt hour for the next two decades or for the two decades after when they open.
LW: And just remind us, how does that compare with gas at the moment?
KP: OK, so the wholesale cost of generating gas in 2025 was £80 per megawatt hour. But although we saw a reduction in gas prices, we saw carbon prices more than doubled. And so carbon prices went from being about 11% of the wholesale price a year ago to now being about 28%. And this is because Keir Starmer wants to harmonise UK and European carbon prices. So they’re almost harmonised now.
But there’s been this huge increase in carbon costs over the past year. As I said, it’s more than doubled.
It was £35 a megawatt hour a year ago and now it’s around 73. So even with all this playing around with the prices, the underlying cost would be considerably cheaper if we were all on gas. The underlying cost would be far cheaper if we were all on gas and didn’t have carbon taxes.
Because the carbon taxes don’t achieve anything. When there was a choice between gas and coal, which was more carbon intensive, you could argue there was some point to it. But there’s no point to it now.
Nobody’s switching to renewables because of carbon taxes. First of all, nobody chooses renewables on their tariff. There’s a small number of 100% so-called 100% green tariffs. They are actually more expensive than the price cap. So you hear people like Dale Vince saying, oh, yeah, we should all have renewables, it’ll be so much cheaper. And I always ask him on social media, if renewables are so much cheaper, why are ecotricity tariffs higher than the price cap? Never once has he responded to that.
LW: Now, Kathryn, you’re, of course, an expert on all this. But was there anything that surprised you as you were carrying out the report that you hadn’t known before?
KP: I was a little bit surprised at the magnitude of the risk within the generation fleet. I think everybody knows that we’ve got the advanced gas called reactors will be closing. That’s just under five gigawatts. Now we’ve obviously got Hinkley Point going to open and I think we’ll probably have some new gas generation opening. So that will offset the nuclear closures that we’re going to see.
But nobody’s really talking about the risks of the gas fleet. Now, NISO, the system operator, says that it expects we should have all 32 gigawatts of the existing gas fleet available to run in 2030 under the Clean Power Plan. But it only thinks it’ll run 5% of the time. Now, the trouble with that is that there’s probably about 12 gigawatts of that 32, which is at risk of closing in the next five to seven years. A third of the gas fleet was built in the 1990s. Another third was built in the 2000s.
And a lot of those assets haven’t really had the type of upgrades and so on that would really extend their lives. So these and some of them are showing really degraded reliability. So the idea that you will keep all of these assets on the grid into the next decade just seems a bit far-fetched to me.
And the other problem is that 5% utilization is just not how these assets were designed to be run. They were actually designed to run baseload. So baseload is extremely rare. Nobody really runs baseload for a gas plant now. They do what’s called two-shifting or they don’t run at all. And two-shifting means that they fire up in the morning and then they go off overnight. Now, if you don’t run your CCGT for a couple of weeks, you start getting all sorts of operational problems with them that are difficult to solve. So the idea that you’re going to take end-of-life assets that were designed to run in a particular way, baseload, and expect them to run only 5% of the time and that they actually will all run when you need them, to me, it’s for the birds. This is just not realistic.
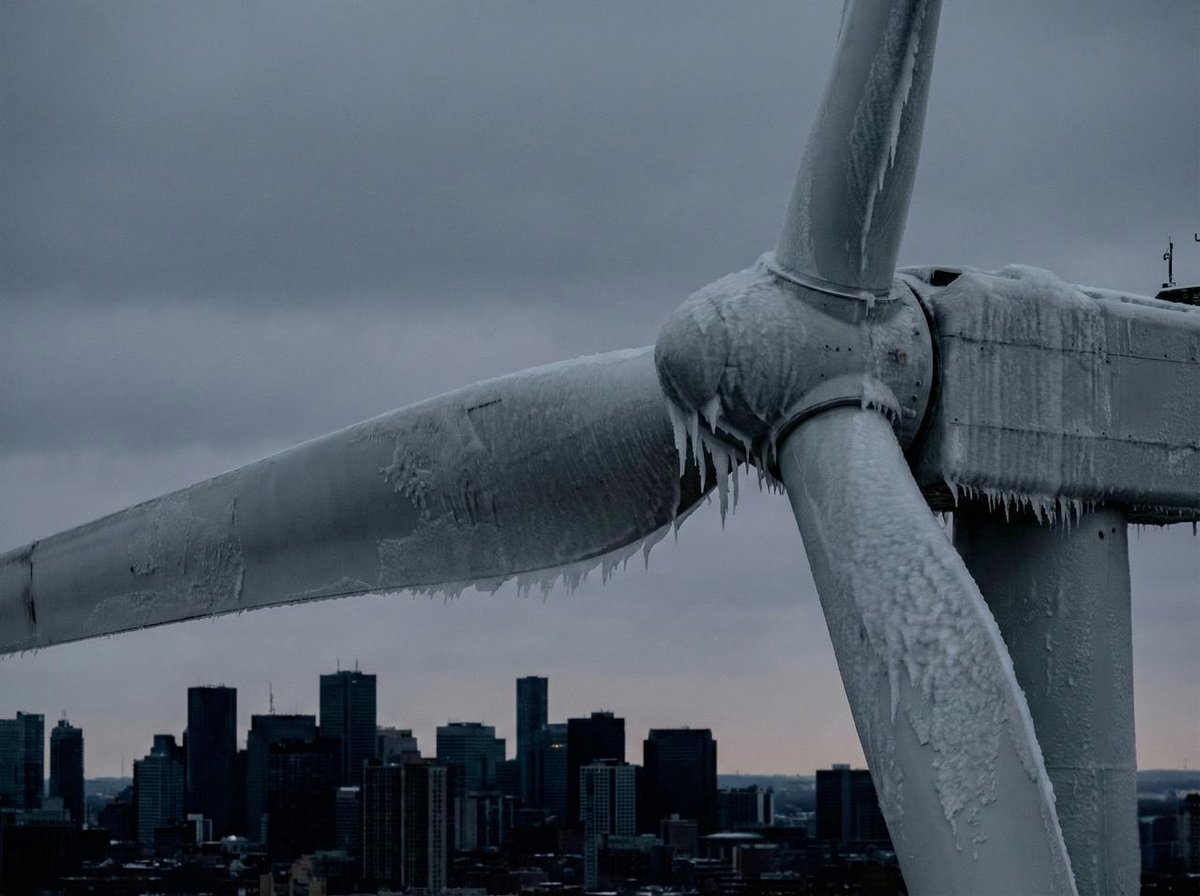
Defrosting wind turbine in Sweden
Any old asset is going to have a risk of not turning on when you need it. And when are we going to need it? We’re going to need it on cold winter days when it’s not windy. So in the winter, during our peak demand, there is no contribution from solar at all. It is zero. The sun sets around 4 p.m. Peak demand is at 6 p.m. So there is no sun in the winter peak. And it’s astonishing how few people realize this. And even during the day, it can be almost nothing at lunchtime. But in the evening peak, there is literally nothing because it’s at nighttime. So zero solar contribution to energy security in winter.
Number two, wind can be almost nothing as well. Wind can go down to megawatts. So if you have to meet 50 gigawatts of demand, which we had the other week, it peaks at 51 in the cold weather a couple of weeks ago, and you’ve got no wind and you’ve got no solar, and you’re relying on your old gas power stations that haven’t maybe fired up for a couple of weeks, what are the chances that not enough of them come on when you need them to? And if that happens, we’ll just have blackouts. If we know it’s going to happen, we’ll ration.
And if we don’t know it’s going to happen, it’ll be a blackout. And we saw in Iberia, 11 people died, and that was really benign weather conditions. So I think a winter blackout in Britain, particularly an unscheduled one, would be significantly more dangerous. So my whole report really says that we should not be complacent about these risks. We need to recognise that these assets might close.
And the reality is right now, the lead times for either extending the lives of these plants or replacing them is long, because the supply chains are very constrained. So if you want a new gas turbine, that’s seven to eight years, a new rotor is about five years. Even the equipment that you’d use for major maintenance is about a year and a half to come to site. So we don’t have that much time to act. We need to be ordering this equipment now to be sure that it’ll be in place when we need it.
But nothing’s happening. There isn’t a plan for this. And there are other risks as well. We have risks around our transmission infrastructure and our distribution infrastructure, old equipment on the grid that’s not being replaced at the rate that it potentially needs to be replaced.
We have serious risks with our offshore gas infrastructure where we might have shortages of gas. Now, NISO put out a report in November, actually published the same day of the autumn budget, so it didn’t really get much attention, saying that some of these offshore pipeline systems are at risk of closure because there’s not enough gas going through them. And if that happens, we won’t have enough gas on cold winter days to meet demand unless we do something about it.
So what are the things we can do about it? One is, well, don’t prematurely close down the North Sea. So if you reverse the ban on drilling and you relax the fiscal regime to make it more accommodating, we could keep producing much more oil and gas than we currently expect. And that would extend the lives of these pipelines.
The other alternative is to put in floating liquefied natural gas regasification terminals. This is what Germany did. You can do it reasonably quickly, but not overnight. It will still take you a couple of years, really, potentially to do that, because even if you’ve got the entry capacity onto the gas network, which we do have at a couple of places around the coast, you still need to build the ship handling. You need to build storage tanks. There’s going to be additional pipe infrastructure that you need to build.
So it’s not something that you can just do just like that overnight. It takes time. And so this is the concern I have, is that we have all of these risks, but we’re not factoring in the time that could be needed to actually address them. And if we run out of time, then we will have an insecure system.
LW: Indeed. And so finally, then, do you think that the political class are waking up to these realities at all?
KP: Well, as for political class, it depends. Right. So you look at the conservatives. Claire Coutinho had a plan to build more gas power stations under the previous conservative government. Labour ditched it. So both the conservatives and reform. And I think realistically, one of those two parties will form the next government. And they both want to take a different approach on net zero, a much more pragmatic approach. And neither of them really, to my understanding, is saying, oh, let’s just, you know, just kill the environment. We don’t care about the environment at all.
What they’re saying is we need a more measured approach and that people are more important. And so it’s counterproductive if you push people into poverty or if you harm them through energy and security and put their lives at risk. These things are not better than the risk that they might face through climate change.
So it has to be a balanced approach that examines the costs and benefits of different types of actions. And the trouble is, at the moment, what we have is an ideology that says that the worst evil that anybody can imagine is carbon dioxide. And that must be removed at all costs.
But this is not correct. It’s not democratic. The public hasn’t ever said that’s what they want. And because this has never been laid out to them. And if you ask people, do they want to do something about the environment? They say yes. But if you ask them how much they’re willing to spend on it, then they say something ridiculous like 10 pounds a year or something completely unrealistic.
So there’s a democratic deficit here. This actually has some commonalities with Brexit or with EU membership, where, you know, there was certainly a section of people that felt that there’d been a democratic deficit there. And this is and I think this is one of the arguments that Nigel Farage makes, that there’s a similar democratic deficit around net zero to what there was around EU membership.
Not that I want to get into the Brexit debate, but when people feel that their views haven’t been sought and that things have been imposed on them and that those things worsen their quality of life, then they tend to get upset about it. And I think that’s why we’re seeing some of the pushback is when people see that their energy is getting more expensive. They can see it’s getting less reliable. They can see they’re being pushed into things they don’t want, like electric cars and heat pumps that will degrade for the most part their quality of life. And nobody ever asked them if that was a good thing.
In this Net Zero Watch video, Colin Brazier takes us on a journey through Britain’s energy transformation as he looks at how energy abundance spawned the modern world. For those who prefer reading, below is a transcript with my bolds and added images. H/T Not a Lot of People Know That.
How did Britain get to where it did? How did this damp little corner of northwestern Europe become the economic superpower of the Victorian age? A lot of people point to our temperament, our system of government, our heritage, our scientific tradition. But I’d offer a rival explanation. It’s because of this.
This battery, like coal before it, represents energy and Britain’s story is a story of energy, a story of how people climbed out of the cold and darkness and built a girdle around the earth. And it’s a story which began here.
This is Ironbridge Gorge, the Silicon Valley of the 18th century, where coke was first smelted with iron and where the industrial age really began.
For centuries, life was fragile. Families lived by candlelight, worked the land, subject to storm and famine. In this truly organic green economy, energy was provided by muscle, by wind, water and wood. And life was constantly on the brink of collapse.
Then came something extraordinary, coal. Dense, powerful, reliable. Unlike wood or wind, coal delivered more power, more consistently and with a surplus. That surplus transformed Britain. It wasn’t just fuel, it was freedom.
One of the early steam engine locomotives.
Coal powered factories, cities and ships. It broke the stranglehold of the aristocracy because land was no longer the source of all wealth. Energy abundance spread prosperity, dignity and opportunity far beyond the manor house.
Life expectancy rose, death rates fell, cities grew. Children left fields, found trades, found schools, found new futures. Coal wasn’t just about energy. It was the very beginning of the modern world. Energy abundance spread opportunity, dignity and choice. Energy is the fuel of civilisation.
Freedom requires means, the ability to travel, to act, to think, to choose. All of it depends on energy. Energy is not just another input to the economy. It is the foundation of every input. It’s the key to every human action. This was the way up.
But from the late 20th century onwards, something changed. A new philosophy took hold. Instead of celebrating energy as the lifeblood of prosperity, it was recast as the villain. Coal was demonised. Oil and gas became suspect.
Energy abundance, once a mark of progress,
was rebranded as a threat to the planet.
Net zero requires us to make big changes today. “Net zero is our best chance for a sustainable future.” The logic of net zero spreads into almost every aspect of daily life. What cars we drive, what we eat, how we heat our homes, even how many children we are encouraged to have. Petrol and diesel cars banned. Gas boilers ripped out. Smart meters to ration our use of power. Meat consumption cut. Families told to fly less, to travel less, to live with less.
This is not abundance. This is managed decline. Think about it. Not power when you need it, but when the state sees fit. That’s not freedom. That’s rationing. Net zero isn’t about emissions. It’s about control. It is central planning extended into every aspect of life.
The state tells you what you can and what you can’t eat, how to travel, when to use power. They call it green, but to me it feels like a command economy. And like all command economies across the world, it ends up in the same way, in poverty and in misery.
We cannot let it happen here. Claire Coutinhowas Secretary of State for Energy Security and Net Zero and retains the brief in opposition. She knows just what effect such a policy will have on the country. Claire, what does net zero mean for growth overall?
The problem with net zero is it’s making us all poorer. Every time a business leaves this country for another country with more polluting energy regime, we are losing jobs, we are losing growth. And for what? So we can become more reliant on other countries for the products that we used to make here.That means fewer jobs here, but higher carbon emissions. It simply doesn’t make sense. And if we carry on down the route that we’re currently travelling, what does the future from a pessimistic position begin to look like? Higher energy bills, fewer jobs. I mean, it simply is not the right path for this country.
Sometimes this whole conversation can be so steeped in declinism. What is the positive vision if we change direction on net zero?
Look, for the last 200 years, Britain has been at the forefront of every industrial revolution. And we can do that again, whether it’s AI, whether it’s robotics, whether it’s space. There are so many things that this country could do if we have access to cheaper energy. Britain is there. We can do this. But we need ministers and governments to focus on providing that cheap energy the country needs.
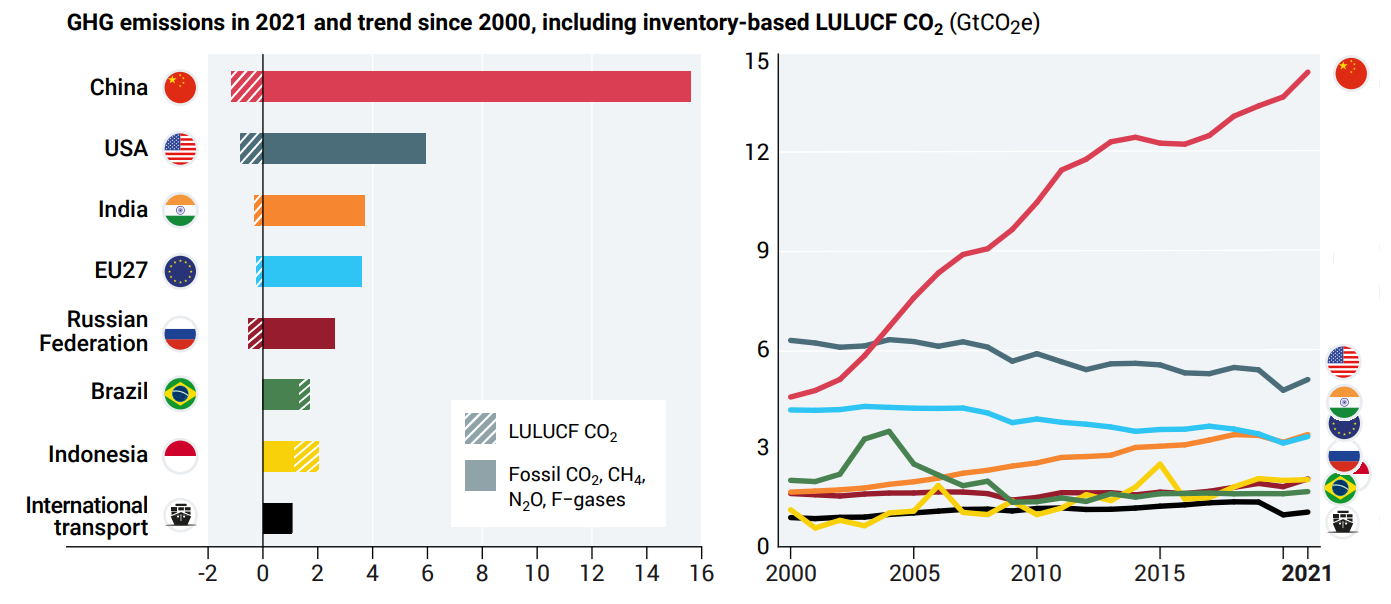
And here is the twist. Britain gets to make the sacrifice while others get to race ahead. Our emissions in the global scheme of things are negligible. China’s annual increase alone dwarfs our entire output. We get to pay the cost. They get to enjoy the growth. What we’re left with is the worst of both worlds. Economic decline at home. No meaningful effect on the climate abroad.
And yet we’re told this is virtuous. That living with less is noble. That accepting decline is moral. But ask yourself, is poverty moral? Is coldness in winter moral? Is telling working families they cannot afford to travel or eat moral? This is not morality. This is coercion dressed up as compassion.
And this is the way down. But decline is not inevitable. We can choose the way up again. Britain has the resources, the ingenuity and the history of leading the world in energy innovation. Coal, oil, gas, nuclear. These are not enemies. They are the foundation stones of modern life. And yes, new technologies can play a part. But they must serve freedom and prosperity, not restrict them.
We need energy abundance, not energy rationing.
Competition, not central planning.
Innovation, not authoritarian diktats.
Britain’s national story really is a story all about energy. Abundance built our freedom. Scarcity may well yet destroy it. We now face a choice. Energy prosperity the way up, or energy poverty the way down. Which future will we choose?
Dr. Wielicki explains at his blog Irrational Fear Excerpts in italics with my bolds and added images.
The most important climate decision in modern U.S. history is quietly being dismantled.
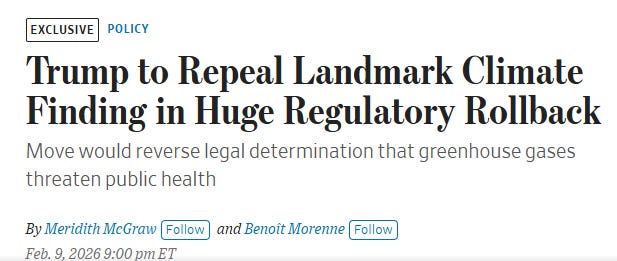
According to reporting by The Wall Street Journal, the Trump administration is moving to repeal the EPA’s 2009 Endangerment Finding — the regulatory keystone that enabled fifteen years of climate rules, vehicle mandates, power-sector controls, and trillions of dollars in compliance costs.
And yet, remarkably, almost no one is talking about the science.
The public conversation is almost entirely about process: whether the repeal will survive legal challenges, whether agencies followed the correct procedures, whether industry benefits too much, and whether courts will intervene. What is missing, again, is a serious discussion of whether the Endangerment Finding was ever scientifically or legally justified in the first place.
That omission is not accidental. It is the defining feature of modern climate policy.
A Decision Made First, Justified Later
The EPA’s Endangerment Finding followed the Supreme Court’s Massachusetts v. EPA decision, which merely allowed greenhouse gases to be considered under the Clean Air Act. It did not require the EPA to declare carbon dioxide a danger to public health or welfare. That judgment was left to the agency.
And the agency chose its answer early.
A recent investigation by the Government Accountability & Oversight Office confirms what many of us suspected at the time: the Endangerment Finding was built around a conclusion that had already been reached. The scientific process that followed was not designed to test whether CO₂ posed an endangerment, but to defend a regulatory outcome deemed politically necessary.
Oversight finding:
“…the Endangerment Finding was treated internally as a ‘decision ready to go,’ with scientific review structured around defending the outcome…”
To enlarge, open image in new tab.
This is the core argument I laid out in my earlier Irrational Fear piece, “Mr. Zeldin, Will You Rescue America From the EPA’s Climate Fraud?”, where I traced how a single bureaucratic determination metastasized into economy-wide control over energy and mobility. I expanded that case in “Climate Lawfare”, showing how courts later shielded massive climate spending programs rooted entirely in the Endangerment Finding’s authority.
None of this was hypothetical. It was documented.
It was observable. And it was ignored.
What the Endangerment Finding Never Confronted
A genuine scientific assessment of endangerment would have required confronting inconvenient facts. The 2009 finding did not.
It never seriously addressed the role of natural recovery from the Little Ice Age, a period of unusually cold global conditions that peaked well before industrial CO₂ emissions and from which the planet has been rebounding for more than a century. Treating all post-19th-century warming as unprecedented and dangerous required quietly discarding that context.
It also failed to grapple with the net benefits of modest warming to human societies. Cold is far deadlier than heat. Agricultural productivity improves with longer growing seasons. Energy access reduces vulnerability. These realities undermine the simplistic harm narrative embedded in the finding.
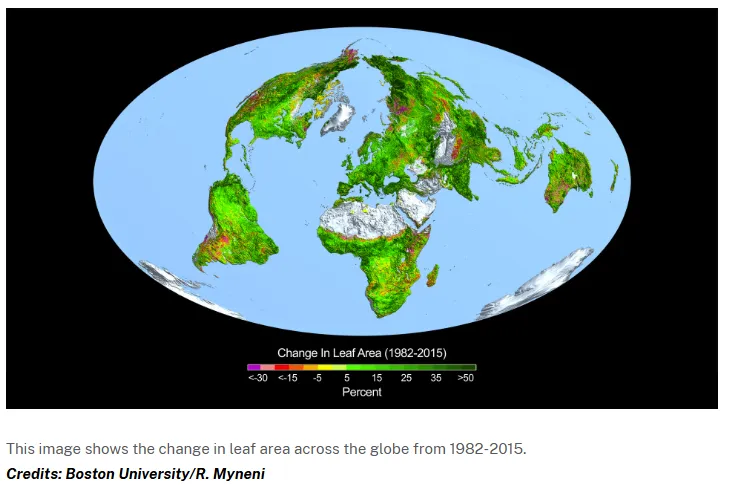
Most conspicuously, the EPA excluded the benefits of CO₂ fertilization, despite mounting observational evidence, now overwhelming, that higher CO₂ concentrations have increased global leaf area, improved plant water-use efficiency, and boosted crop yields. Satellite data did not support a story of planetary decline. They supported one of widespread greening.
The Absurdity of Calling 420 ppm “Unclean Air”
Perhaps the most fundamental flaw in the Endangerment Finding is conceptual.
For most of Earth’s history, atmospheric CO₂ levels were not 280 ppm or 420 ppm, but 1,000 to more than 4,000 ppm. Life did not collapse under those conditions. It flourished. Forests expanded. Biodiversity increased. Entire ecosystems thrived.
Against that backdrop, the claim that today’s atmosphere — at roughly 0.04% CO₂ — constitutes “unclean air” collapses under minimal scrutiny. Carbon dioxide is not mercury. It is not sulfur dioxide. It is not lead. It is an essential molecule for life.
The Relationship between Atmospheric Carbon Dioxide Concentration and Global Temperature for the Last 425 Million Years (Davis 2017)
This figure shows estimates of the changes in carbon dioxide concentrations during the Phanerozoic. This is not an ideological statement. It is basic chemistry. The Endangerment Finding required redefining that chemistry to make regulation possible.
Years of Writing, One Conclusion
At Irrational Fear, I have spent years examining these issues from multiple angles: disaster statistics, sea-level records, hurricane data, climate costs, adaptation, and the repeated failure of model projections to match observations. I submitted those findings formally to the EPA in my public comment supporting reconsideration of the Endangerment Finding, drawing directly on hundreds of prior analyses.
The conclusion has remained consistent: the evidence never supported a finding of endangerment.
What has changed is not the data. What has changed is the legal and political tolerance for pretending otherwise.
in the video above, Ron Barmby joins Angela Wheeler to discuss Sunset on Net Zero and the why green energy schemes fail. He questions the scientific, economic, and engineering basis of global net-zero policies. Drawing on physics, real-world observations, and decades of experience, he argues that CO2’s warming effect is small and diminishing. He also challenges climate models that rely on unverified assumptions. Barmby warns that many green energy solutions are impractical and that net-zero policies disproportionately harm the poor.
For those preferring to read, I provide below a lightly edited transcript in italics with added images. AW refers to Angela Wheeler and RB to Ron Barmby. H/T Climate Change Dispatch.
I think [Net Zero] is insane. It is pointless to pursue it because it will make no difference to the climate or to climate change. The climate will change as it wants to change, no matter how much CO2 we put in the air. So it’s a pointless thing to do. It is unachievable. And in the end, as always, it’s the poorest among us that will pay the highest price proportionally.
AW: This is Climate Debrief, brought to you by the CO2 Coalition. I’m Angela Wheeler. There’s a recently published book, Sunset on Net Zero, a heretics guide to the futile CO2 target. You’re going to hear from the author, CO2 Coalition member Ron Barmby. Ron is a professional engineer with a master’s degree from the University of Alberta and a four-decade career that’s taken him to over 40 countries across five continents. Ron’s adventures have shown him firsthand how societies really are adaptable to shifting climates.
Thank you for taking the time, Ron. Thank you for having me, Angela. Part one of your recent book is titled How I Learned to Stop Worrying and Love Carbon Dioxide. Did you have a moment of clarity where this all made sense or did this happen over a period of time?
RB: It sort of happened over a period of time when the Al Gore movie came out. At first, I was impressed with it and I thought, well, this all makes sense. And then as other writers started pointing out the flaws in that movie, I decided I should look into this more too.
Al Gore with a version of the Hockey Stick graph in the 2006 movie An Inconvenient Truth
And as an engineer, I have a background in physics and I realized that a lot of the physical characteristics that Al Gore was talking about simply aren’t true. So it developed over time. And as it developed over time, some of my friends said, Ron, you should write this down. And so I did. And that was my first book. The second book, the one that you just mentioned, is sort of an update of what’s happened since 2020 when the first book was published.
AW: What is your analysis of this global effort to reach net zero?
RB: Well, I think it’s insane. That’s what I think. It is pointless to pursue it because it will make no difference to the climate or to climate change.
I now declare the Paris Agreement for Climate Change open for signature. More than 170 countries signed the Paris Agreement. They are pledging to take steps to limit the rise of global temperatures to well below two degrees Celsius.
–Ban Ki-moon, UN Secretary-General
The climate will change as it wants to change, no matter how much CO2 we put in the air. So it’s a pointless thing to do. The second part of it, it is unachievable.
And that’s where my engineering background comes in and many of the engineers that are part of the CO2 coalition. What they want to achieve simply can’t be done in a reasonable time frame at a reasonable cost, and it can’t be done globally. And the third thing about it is the whole thing is unfair because it punishes those that are trying to reduce CO2 emissions to the benefit of those who are only paying lip service to CO2 emissions. And in the end, as always, it’s the poorest among us that will pay the highest price proportionally.
AW: Your book sums it up well in stating that warming from future CO2 is too trivial and too gradual to justify drastic policy. Could you explain that?
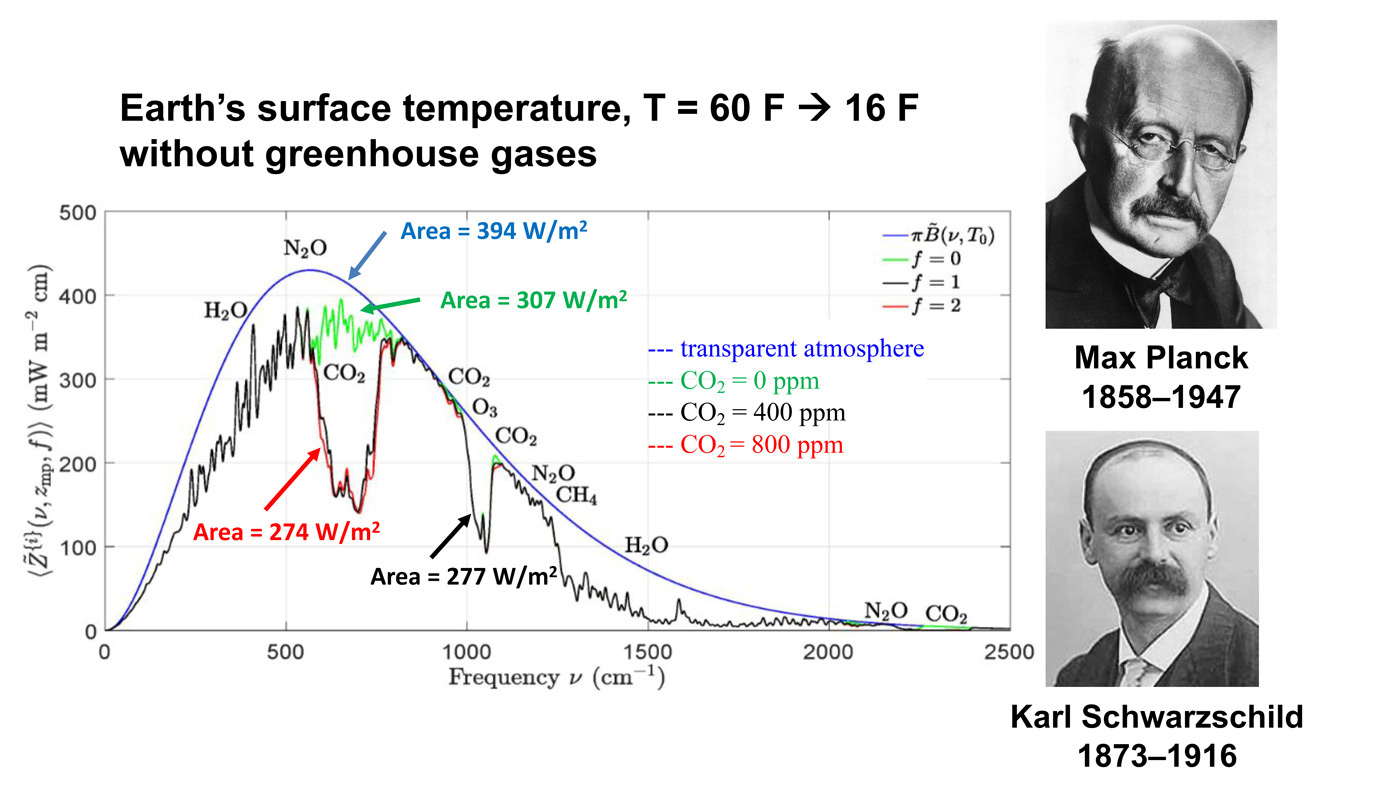
RB: Well, there was a paper written in 2019 by two coalition members, Dr. Wijngaarden and Dr. Happer.
That paper explained from physicist to physicist how we can actually measure the amount of CO2 warming that has happened. And by measuring that amount, it confirmed the equations that would predict what would happen if we doubled the CO2 emissions again, or came to a complete doubling. And looking into that paper, I tried to explain in everyday terms how valid it is and what it means. And so in that investigation, I came to the conclusion that this is understandable by many, many people. And if we got the word out, that might help shift the view on the alarmism of carbon dioxide induced global warming.
“Right in the middle of these curves, you can see a gap in spectrum. The gap is caused by CO2 absorbing radiation that would otherwise cool the Earth. If you double the amount of CO2, you don’t double the size of that gap. You just go from the black curve to the red curve, and you can barely see the difference. The gap hardly changes.”]
AW: Is it your position that the push for net zero stems from political exaggeration, followed by media amplification and not empirical science? Is that a fair assessment?
RB: I think that’s a fair assessment. And Margaret Thatcher is one person that I like to quote on that. Many people don’t realize that Margaret Thatcher was trained in Oxford as a chemist, as a research chemist. So she was one of the big people behind pushing for the Paris Agreement. And she wanted to reduce CO2 emissions because she was concerned. But she knew how the scientific method worked because she was trained in it. And when she saw the first reports come out, she changed her mind.
And she said, kind of paraphrasing Hamlet, that there isn’t method in their madness, there is actually madness in their method. And what Margaret Thatcher pointed out was that the desire to control CO2 emissions worldwide is something that would require a worldwide organization to organize and enforce. And so she saw it in that perspective, that it was a grand multinational global socialist effort to control the economy.
She was not far off. But I do think that on the other end of the spectrum, capitalists have found a way to exploit this energy transition and make money that they would otherwise not be able to make.
AW: Regarding net zero, your compelling argument cites the work of two other CO2 coalition members, our chairman, Dr. William Happer, and Dr. William Don Wingarden. Their work, as you mentioned, initially a series of academic papers by physicists for physicists, focuses on measuring thermal radiation transfer and had a truly profound effect because it undermines net zero. For one, they use real observations, not models. Can you please explain the difference and why is it worth noting?
RB: The scientific method is a way to make sure that we’re not fooling ourselves, that we think we understand something that we don’t really understand. And it was one thing that another CO2 member, Dr. Clauser, pointed out in his talk to Korean physicist students a couple of years ago. You have to go into science with an open mind and an unbiased mind. And you have to report faithfully what you observe. And it’s the observations of physical reality that is the link to truth in science.
So the computer models that the IPCC relies on aren’t based on observations that are linked to reality. They’re based on biases that the computer programmers put into their own models. And the brilliance behind the Van Wingarden and Happer study is that they found an existing public domain database that contained the observations needed to show that the effect of CO2 warming was very small and it’s diminishing rapidly. Another important thing to mention is that Dr. Happer and Dr. Van Wingarden’s math matches real world data from space. This follows the scientific method, observe, predict, test, repeat.
AW: What you’re saying, and especially in your book, that the scientific method is so important, do you feel it is being neglected and perhaps not followed at the university level today?
RB: Unfortunately, I think, Angela, it’s worse than that. It’s not followed, maybe not at the university level, but I think it’s the elementary, junior high, and high school level where it needs to be brought back into the curriculum and taught. It’s when 10 and 12 year old students come home and they’re convinced that CO2 is something to be afraid of. That’s where the problem starts. And I think that’s where the problem has to be fixed.
AW: Regarding the paper by Dr. Happer and Dr. Van Wingarden, they didn’t just claim CO2 impact is small. They measured it, verified it, and anyone can check their data. They replaced alarmist models with hard, observable facts. How can anyone argue that?
RB: Angela, I don’t think anyone has argued with that. I think the mainstream media and the IPCC have simply ignored it. They haven’t addressed it. Coming out in the United States is a presidential directive that all science backed by the federal government must meet the scientific method standards. And I think that’s going to be a huge change worldwide when organizations, both federal and international organizations, when they are held to the standard of the scientific method, I think their karmic alarmism is just going to melt away.
AW: As a former teacher and also as a mother and now a GG, I was gratified to see your chapter Stop Scaring the Children. What compelled you to write this chapter?
RB: I’m a grandfather, and my grandkids are very concerned about CO2. And so it takes me a long time to explain to them that there’s nothing to worry about. And unfortunately, in a more of a millennial generation, there’s been a lot of extreme anxiety among that generation about climate change. And unfortunately, there’s been some tragedies that have resulted because of that. So I think it’s important to stop scaring the children. If you want to deal with a scientific methodology or a proposition you want to promote, bring it forward to trained people who can discuss it intelligently with you. Don’t bring it into the classroom of an elementary school and scare children with it.
AW: Ron, the second part of your book is Engineering 101 is the doomsday book for net zero. Why is that?
RB: Well, because there are all of the green energy sources and the green machines that run on them, and many of them just simply fail when you try to build them. And I think I quote in my book, it was James Michener who said scientists dream of great things, but engineers build them. Well, you can have great dreams. You can dream of creating a solar guidance star like Dr. Hapur did, but it’s up to the engineers to build them. And everyone is crossing their fingers until the thing actually works.
And a lot of the propositions that are out in the mainstream media, how we can avoid or reduce our CO2 emissions are either uneconomic or they hurt the environment more than they help, or they simply don’t work. And that’s my engineering perspective coming into play.
AW: I see. And that makes me think of models, climate models. For example, you can create the model, but from an engineering standpoint, and with regard to net zero, is it impossible to come up with the conclusions that they do with models?
RB: In the case of climate, yes, it is. Now in engineering we use models for a number of things, because we have verified that the equations we’ve put into the model are correct, and they can predict what might happen. And you can see that in flight simulators.
In my own background, reservoir engineering models are based on the Darcy equation, and they’re quite good at predicting what will happen, because those equations stand up to the scientific method. And so when your equations can predict what happens in the future, and it actually happens, then you verified the equation, then you verified the model. The IPCC models, they have equations in there and assumptions that simply aren’t verified, and they don’t predict accurately.
One thing that came out of the Van Wintergaarden and Happer paper, and other papers that are associated with members of the CO2, is that the CO2 warming from the IPCC models has to be at least doubled, and some would claim quadrupled, in order to get the alarmist levels of warming that they predict. And so that factor of two or four just thrown in to cause more anxiety, that’s not science, that’s scare tactics. And it’s important to point out that the IPCC is a government organization, it’s not a science organization.
AW: And the other thing is, they say carbon dioxide is the control knob for temperature, and that’s not the case, correct?
RB: You’re absolutely correct. We run on an energy balance, and that energy balance coming from the sun has part to do with the climate on earth. And as Gregory Wrightstone pointed out in his book, 90% of the global warming effect of CO2 is already behind us. So the next 10% is going to be minimal. So the next 10% is not the control knob of temperature on earth. Now, if there was no CO2 on earth, as there is no CO2 on the moon, the first amounts of CO2 added would have a dramatic effect on temperature. But that’s way, way behind us.
AW: Well, in concluding our conversation, I would like to let our viewers and listeners know that they can get your new book, Sunset on Net Zero, A Heretic’s Guide to the Futile CO2 Target at Amazon. Ron, there are many excellent points in your book we didn’t get to. I hope you will join us again soon on Climate Debrief. I’d love to, Angela. Thank you very much.
Team in China finds that high renewable energy integration
could make power transformers age nearly a quarter faster
As US President Donald Trump continues to wage war against renewable energy, a new Chinese study revealing the strain that renewable integration places on power transformers could give him fresh technical ammunition.
The researchers discovered that high renewable energy integration could make power transformers, vital
components that regulate voltage in electricity grids, age faster than previously thought. High levels of wind and solar energy increased bidirectional power flow switching – the movement of electricity in both directions – causing additional stress that current standards did not account for, the Chongqing-based team found.
In a world grappling with transformer shortages and surging energy demand from electrification and the growth of artificial intelligence data centres, the findings suggest that renewables could place even greater strain on ageing grids, like those in the United States and Europe.
When testing their new proposed model, the team found that two-way flow caused transformers to age 23 per cent faster than accounted for by current standards, according to a paper published in the Chinese-language journal Power System Technology on January 16.
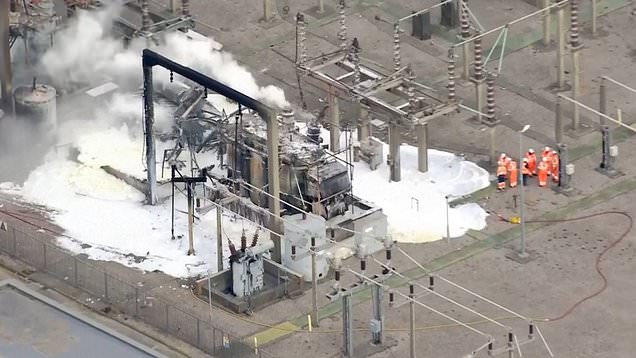
Aerial footage shows damage to burnt out power transformers near Heathrow
“This paper focuses, for the first time, on the impact of frequent bidirectional power flow switching caused by high‐penetration wind and solar integration on the operational characteristics and insulation lifespan of power transformers,” the team said.
The researchers, from the Chongqing University of Posts and Telecommunications and the State Grid Chongqing Electric Power Company, also built a “long-term lifetime loss accumulation calculation framework” – which could be used to assess the condition of transformers and guide operation and maintenance.
Speaking before the UN General Assembly in September, Trump said that renewable energy options were a “joke” and that wind turbines were “so pathetic and so bad” and expensive to operate. In January, in his address before the World Economic Forum in Davos, Trump said: “China makes almost all of the windmills, and yet I haven’t been able to find any wind farms in China. “They make them, they sell them for a fortune. They sell them to the stupid people that buy them.”
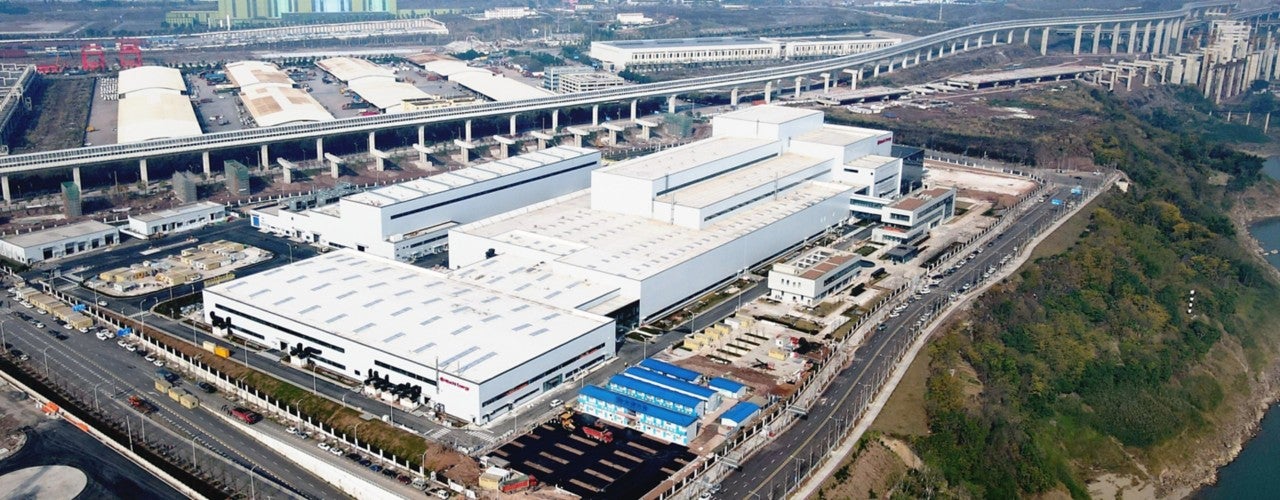
Hitachi Energy Chongqing Transformer Co. Ltd. is located in Chongqing City. As one of the largest transformer factories worldwide within Hitachi Energy, the company focuses on the design and manufacture of power transformer, shunt reactor and HVDC transformer (High Voltage Direct Current).
Traditional energy grids had a centralised, one-way flow of power from the producers to the consumers. This is shifting towards a two-way system where electricity can also flow back from solar, wind and energy storage sources into the grid.
Transformers are a basic and critical component of electric grids, adjusting the voltage of electricity so it can travel efficiently through the grid. They can either “step up” or increase the voltage so electricity can travel long distances through power lines without losing strength, or “step down” the voltage once it reaches its destination so it can be safely used by appliances.
Power transformers are large units which transmit high-voltage electricity over long distances, while distribution transformers are smaller units that help supply local areas.
As transformers age, their components can degrade, which can lead to higher maintenance demand, limit efficiency and reliability, and increase the risk of a major grid failure. The average age of power transformers in use worldwide is around 40 years, according to electrical equipment supplier Reinhausen.
In the US and Europe – home to the oldest power grids in the world – some transformers date back even further. Much of the US electric grid infrastructure was built 50 to 75 years ago, and nearly 70 per cent of power transformers in the country are over 25 years old, according to a report from the University of Wisconsin-Madison last May.
More than half of the transformers in this country are becoming too old to reliably function and can fail at any time. We not only need to build new transformers, but we also need to replace the ones that are ageing out. — US Department of Energy in 2024
But expanding and replacing transformer infrastructure is not only expensive, it could even be impossible in the short term due to long delivery times and a global shortage of power transformers, according to Reinhausen.
Average lead times for large power transformers had almost doubled since 2021, with securing transformers taking up to four years, the International Energy Agency (IEA) said in a report last February.
According to the IEA, the production of power transformers is technically complex and requires advanced facilities. China, South Korea, Turkey, and Italy accounted for 50 per cent of total global power transformer trade in 2023, it said, with China alone representing half that share.
Top 10 Power Transformer Manufacturers In The World
Both the US and Europe have more than doubled their import trade value for power transformers since 2018. The US primarily sources transformers from Mexico, Europe and South Korea, while China now accounts for over 60 per cent of the European Union’s imports, according to the IEA.
Imports account for an estimated 80 per cent of the US power transformer supply, and 50 per cent of the distribution transformer supply, according to a report by energy research and consultancy group Wood Mackenzie in August.
In the US, the supply shortage for power transformers hit 30 per cent in 2025,
while the shortage for distribution transformers hit 10 per cent, the report said.
“Imagine an argument so airtight about science so settled
over technology so reliable that you have to use censorship
to make sure nobody gives a dissenting opinion.” @ProctorZ
Finland has prided itself as a global leader in decarbonization, boasting the second-highest share of renewables in final energy consumption across the EU.
But the green utopia narrative has cracked under the strain of a brutal winter,
as cold weather has brought wind power generation to a near standstill.
Most of the country’s wind capacity is concentrated in western Finland, where temperatures are well below freezing, and these adverse weather conditions have led to dangerous ice buildup on turbine blades. According to Bloomberg, this forced the grid operator Fingrid Oyj to curtail wind power output.
Primary energy sources in Finland 2017. All fossil fuels should be replaced by clean energy sources.
“There are low fog clouds in Finland’s main wind power production area, roughly at the height of turbine blades, which are causing new ice to form,” Pia Isolähteenmäki, an adviser at industry consultant Kjeller Vindteknikk Oy, told the outlet.
Much of Finland’s wind fleet lacks blade-heating systems for extreme cold weather. How is that even possible, considering it’s a Nordic country? Even the thinnest ice buildup risks equipment damage and has led to shutdowns this week.
Bloomberg data show that Finnish wind output is expected to remain very low for the next two weeks. Meteorologists at MetDesk forecast that Nordic wind generation will remain as much as 20% below normal through at least the midpoint of the month.
The result of the green utopia pushed by Europe’s climate alarmists,
not based in reality whatsoever, is soaring power prices
that are crushing working poor households.
Wind tubine defrosting in Sweden
Helsinki Times wrote on Sunday:
“Electricity prices in Finland rise to the highest level of the winter on Monday, driven by severe cold, weak wind conditions and rising weekday demand,”
Finnish folks on X are questioning the government’s questionable decarbonization push:
Dana X post:
News from the “green garden”. In Finland, the blades of wind turbines froze. The electricity production of wind power stations in Finland fell from 9433 MW to about 430 MW. Thus, they produced no less than 5% of the nominal power. The culprit turned out to be Russian frosts, the possibility of which European energy companies did not take into account when implementing the “green” transition.
Zeaqi X post:
Finland literally has to use nuclear power to MELT frozen wind turbines and we live in darkness most of the year. How about focusing on reliable power like nuclear instead?
Mari Luukkainen X post:
Our electricity bill was 45 EUR yesterday alone.
Finland: nuclear power, hydroelectric, wind farms, one of the most technically advanced countries in the world.
Also Finland: people burning firewood because the electricity market is fucked. I am sitting next to the fireplace shitposting on LinkedIn (that’s why shitposting is very intense today). This is my energy strategy.
In the US, a historic cold snap in the eastern half of the country led to increased fossil-fuel power generation to prevent power grid collapse.
Across the West, years of grid mismanagement by climate alarmist policymakers have transformed what were once reliable grids into fragile messes where working poor households bear the brunt of some of the highest electricity costs in the world.
It is time to get back to basics and expand natural gas generators and nuclear power, the only proven large-scale source of clean and reliable electricity. And it is also time to hold accountable the climate alarmists whose policy decisions pushed power grids toward the edge of collapse while promising a green utopia that was never going to arrive. And one can only wonder whether the move to push power grids to the brink of collapse was intentional.
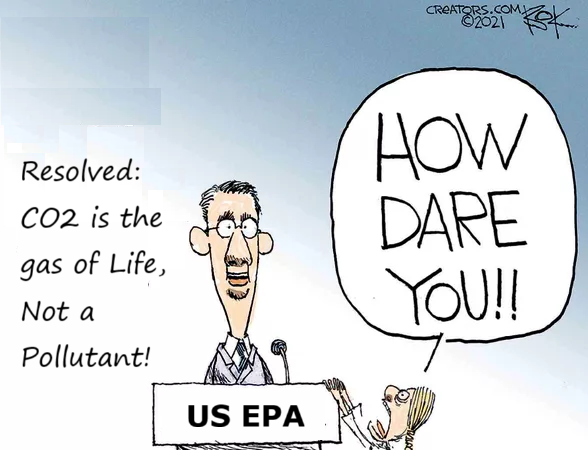
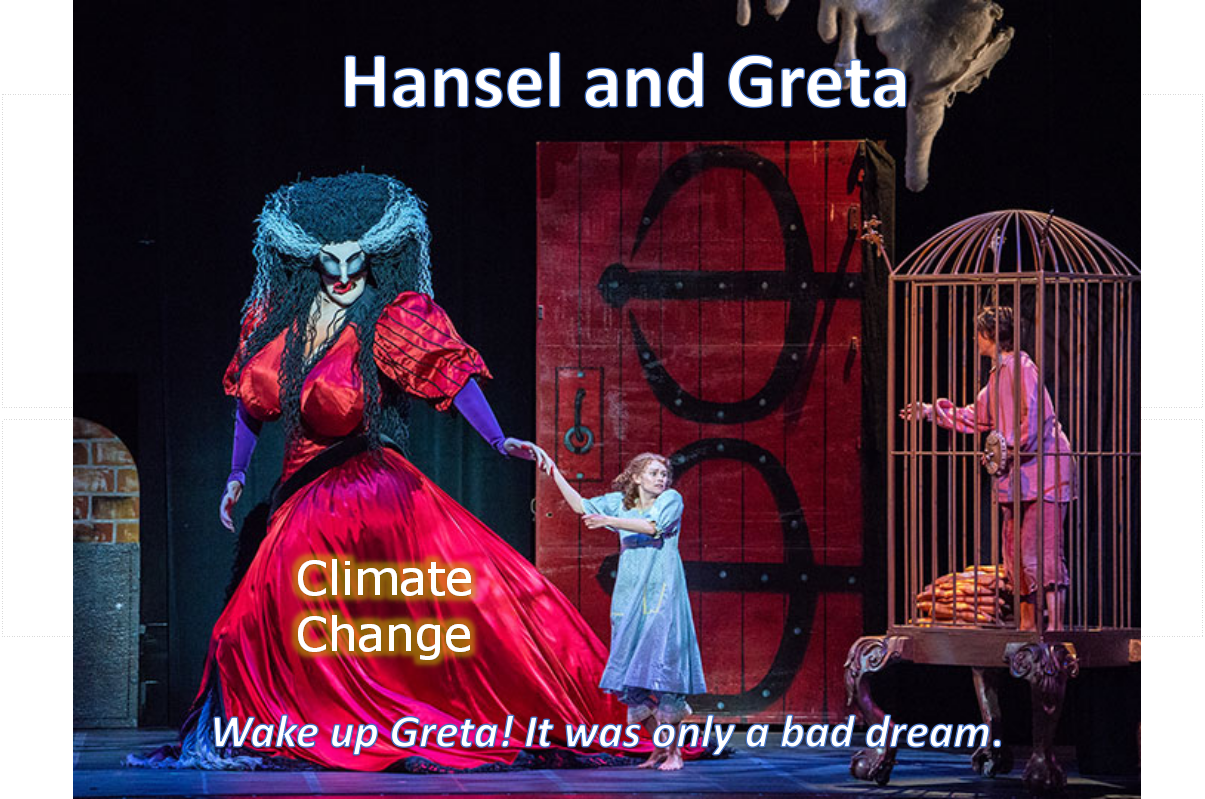


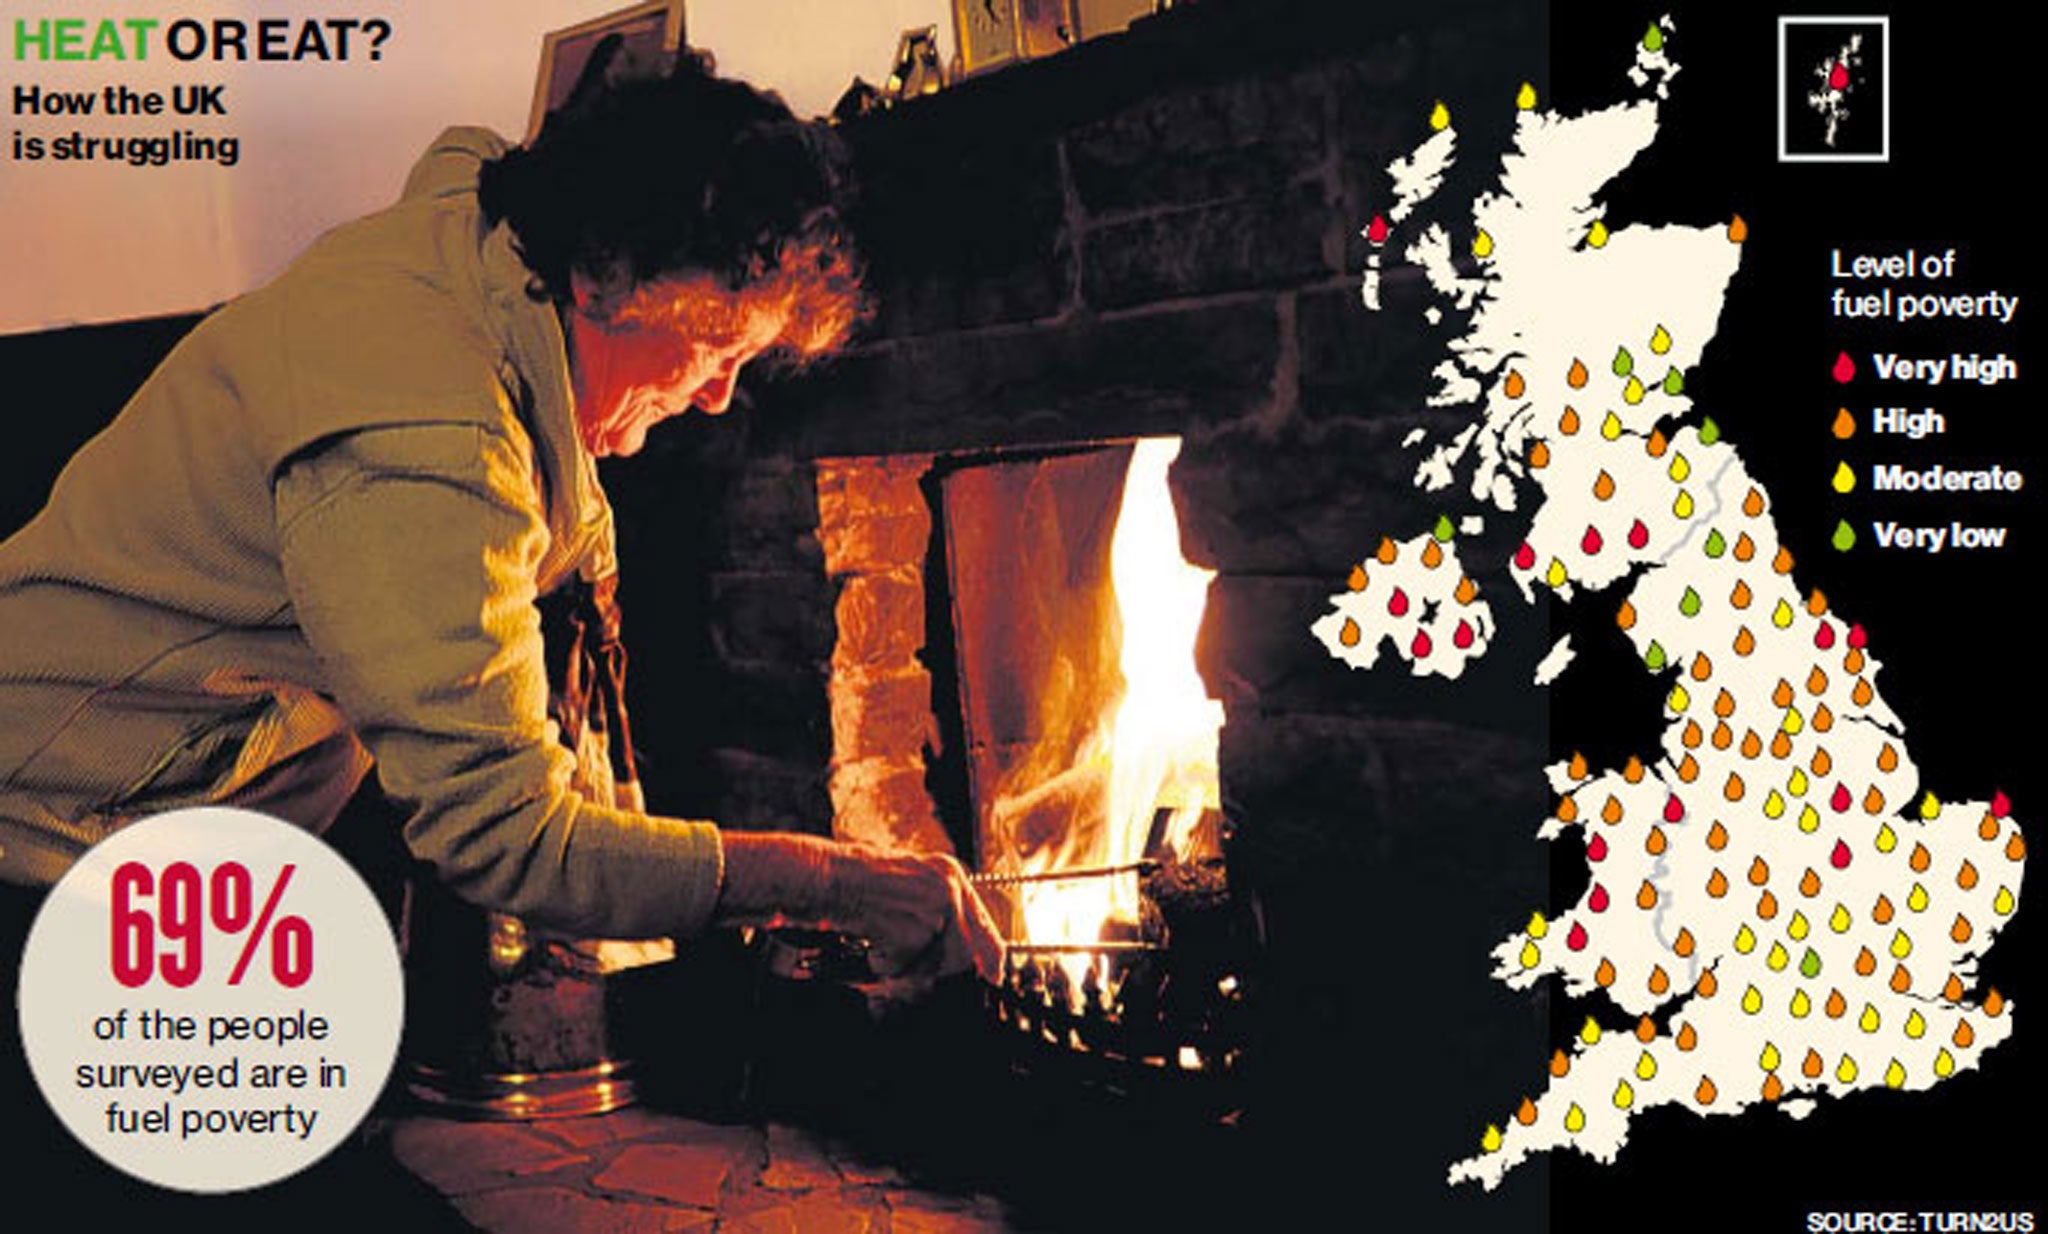
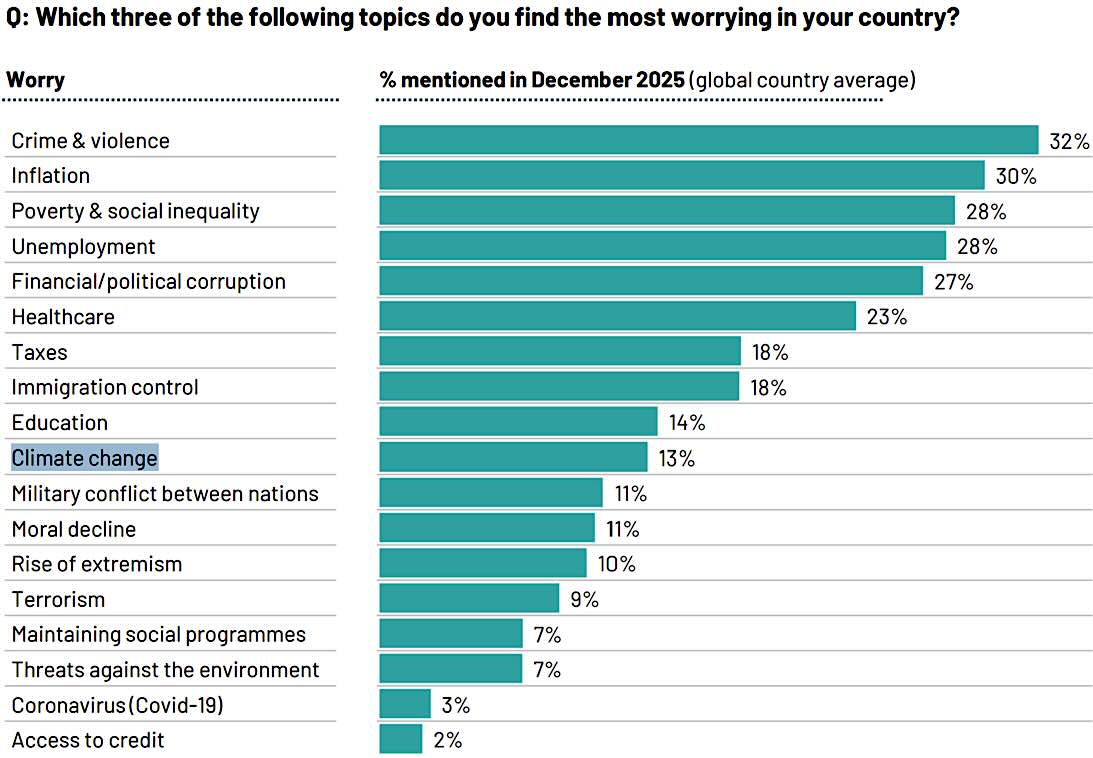

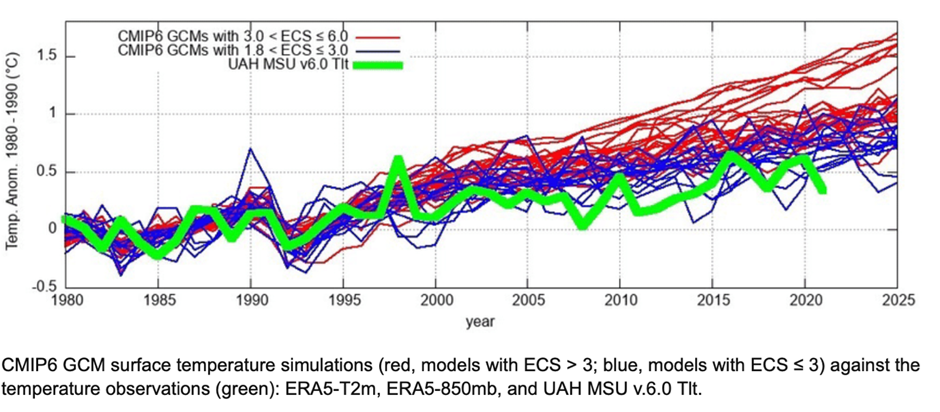
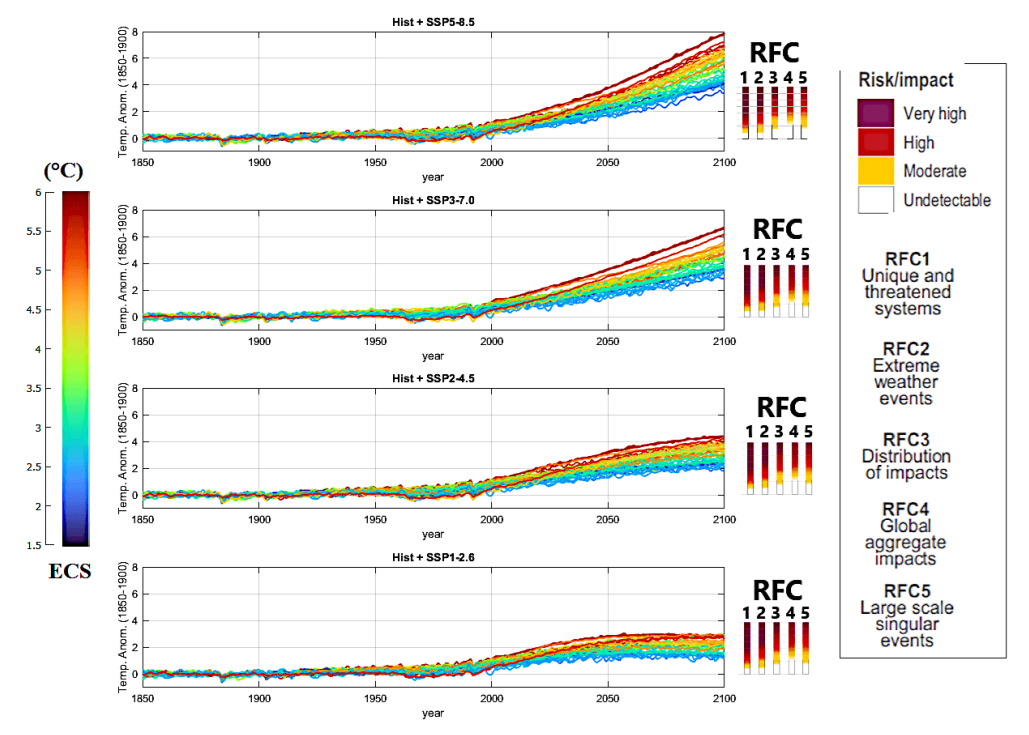


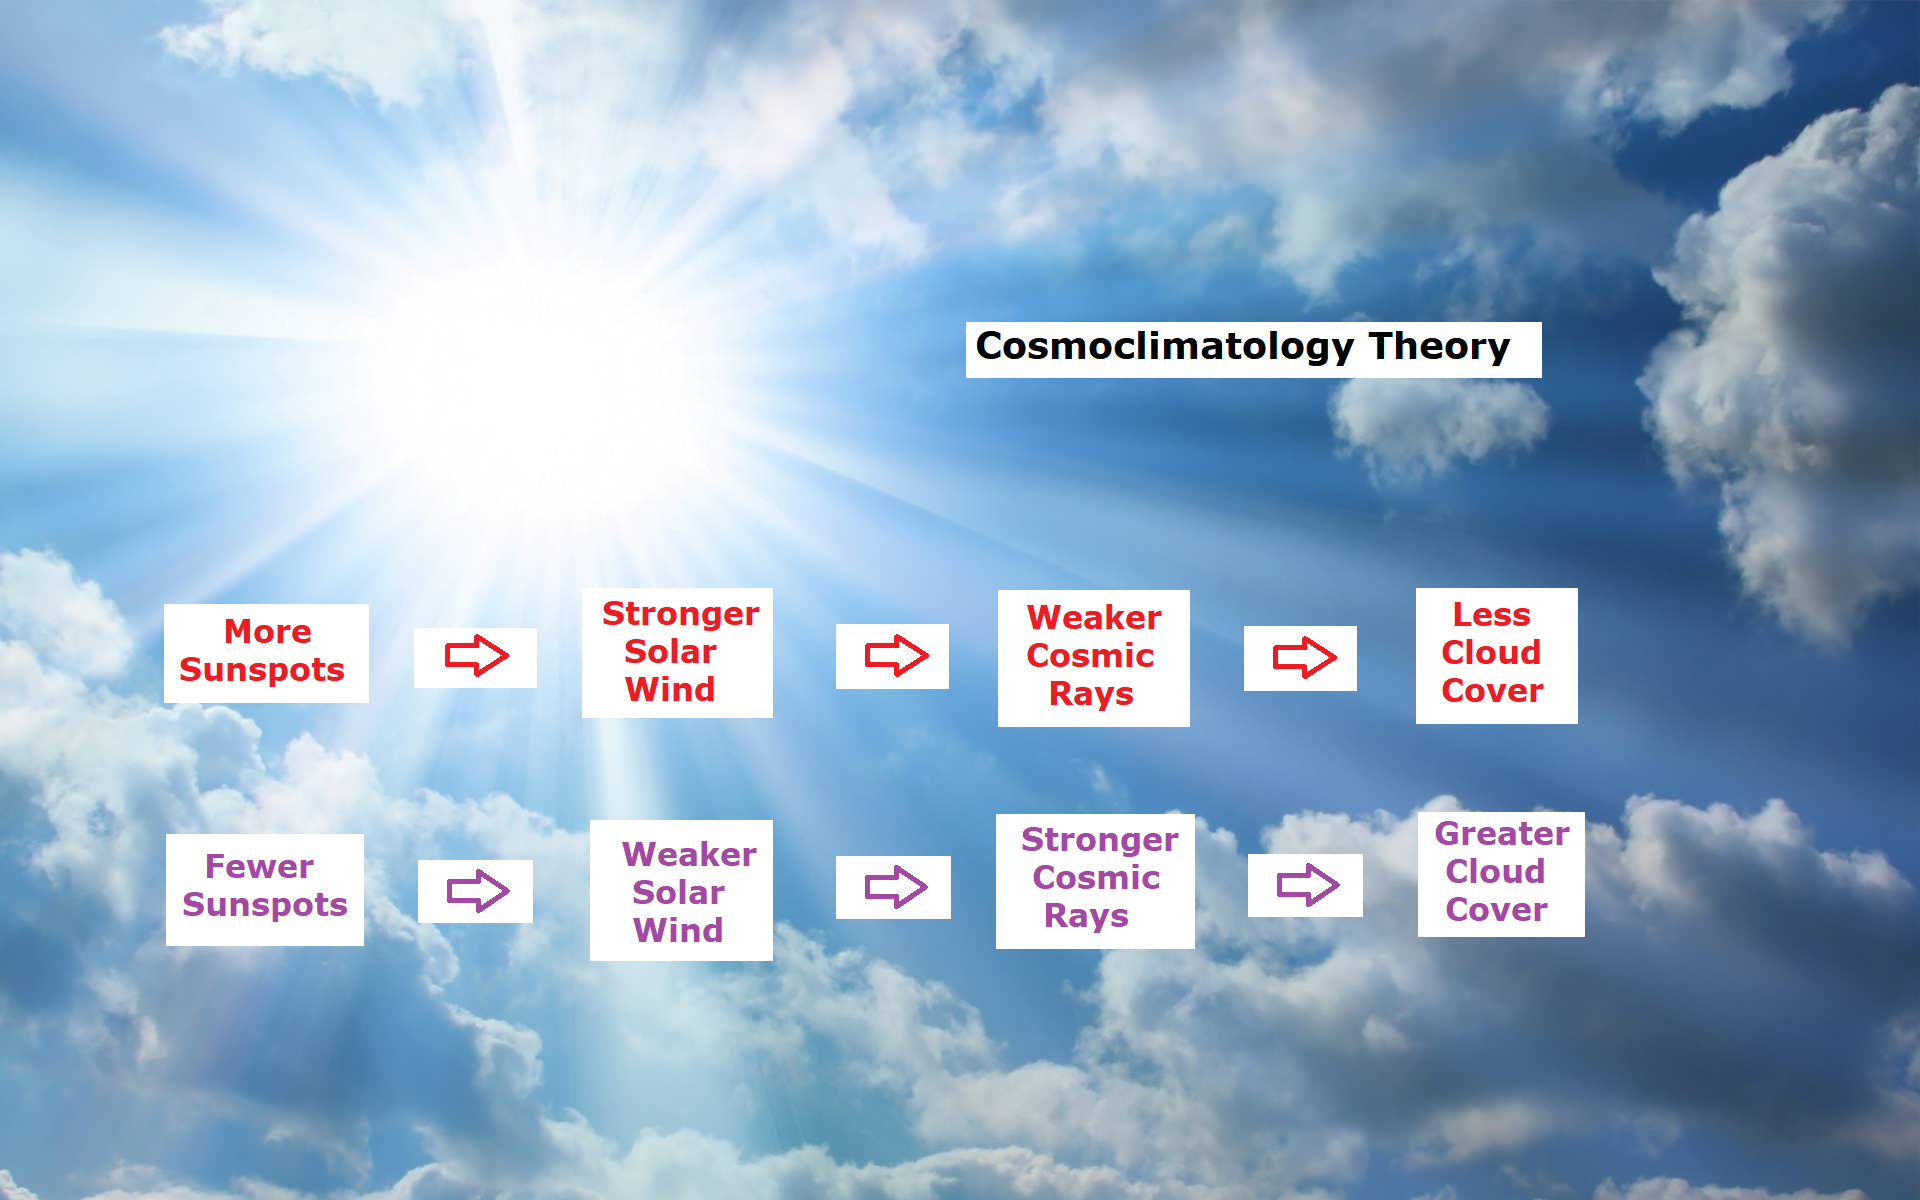
 Moreover, despite ongoing controversy surrounding long-term solar variability, current GCMs are typically forced with solar reconstructions that exhibit extremely low secular variability. This helps explain why these models attribute nearly 0 °C of the observed post 1850–1900 warming to solar changes and simultaneously fail to reproduce the millennial-scale oscillations evident in paleoclimate records.
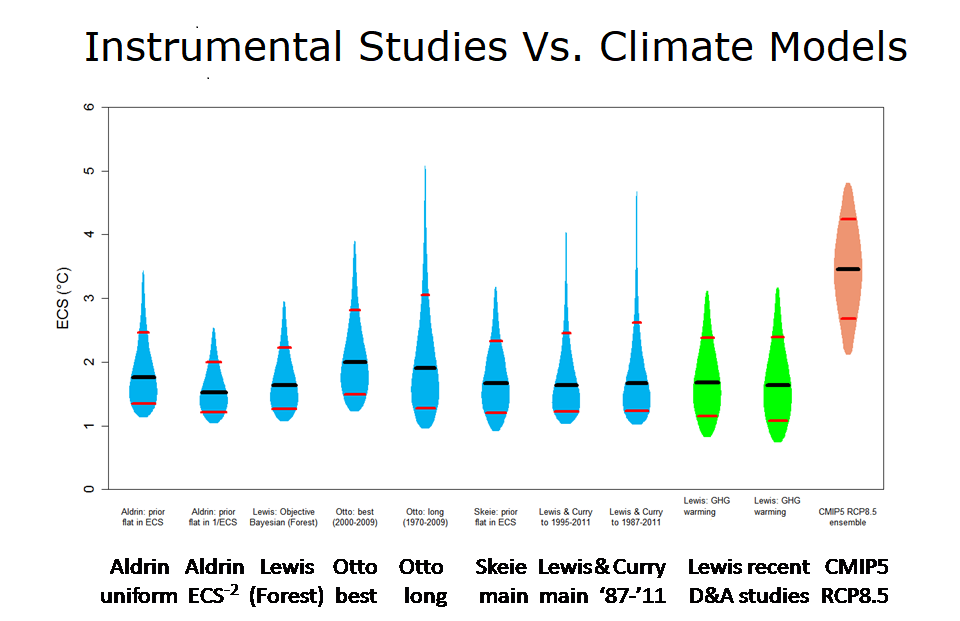

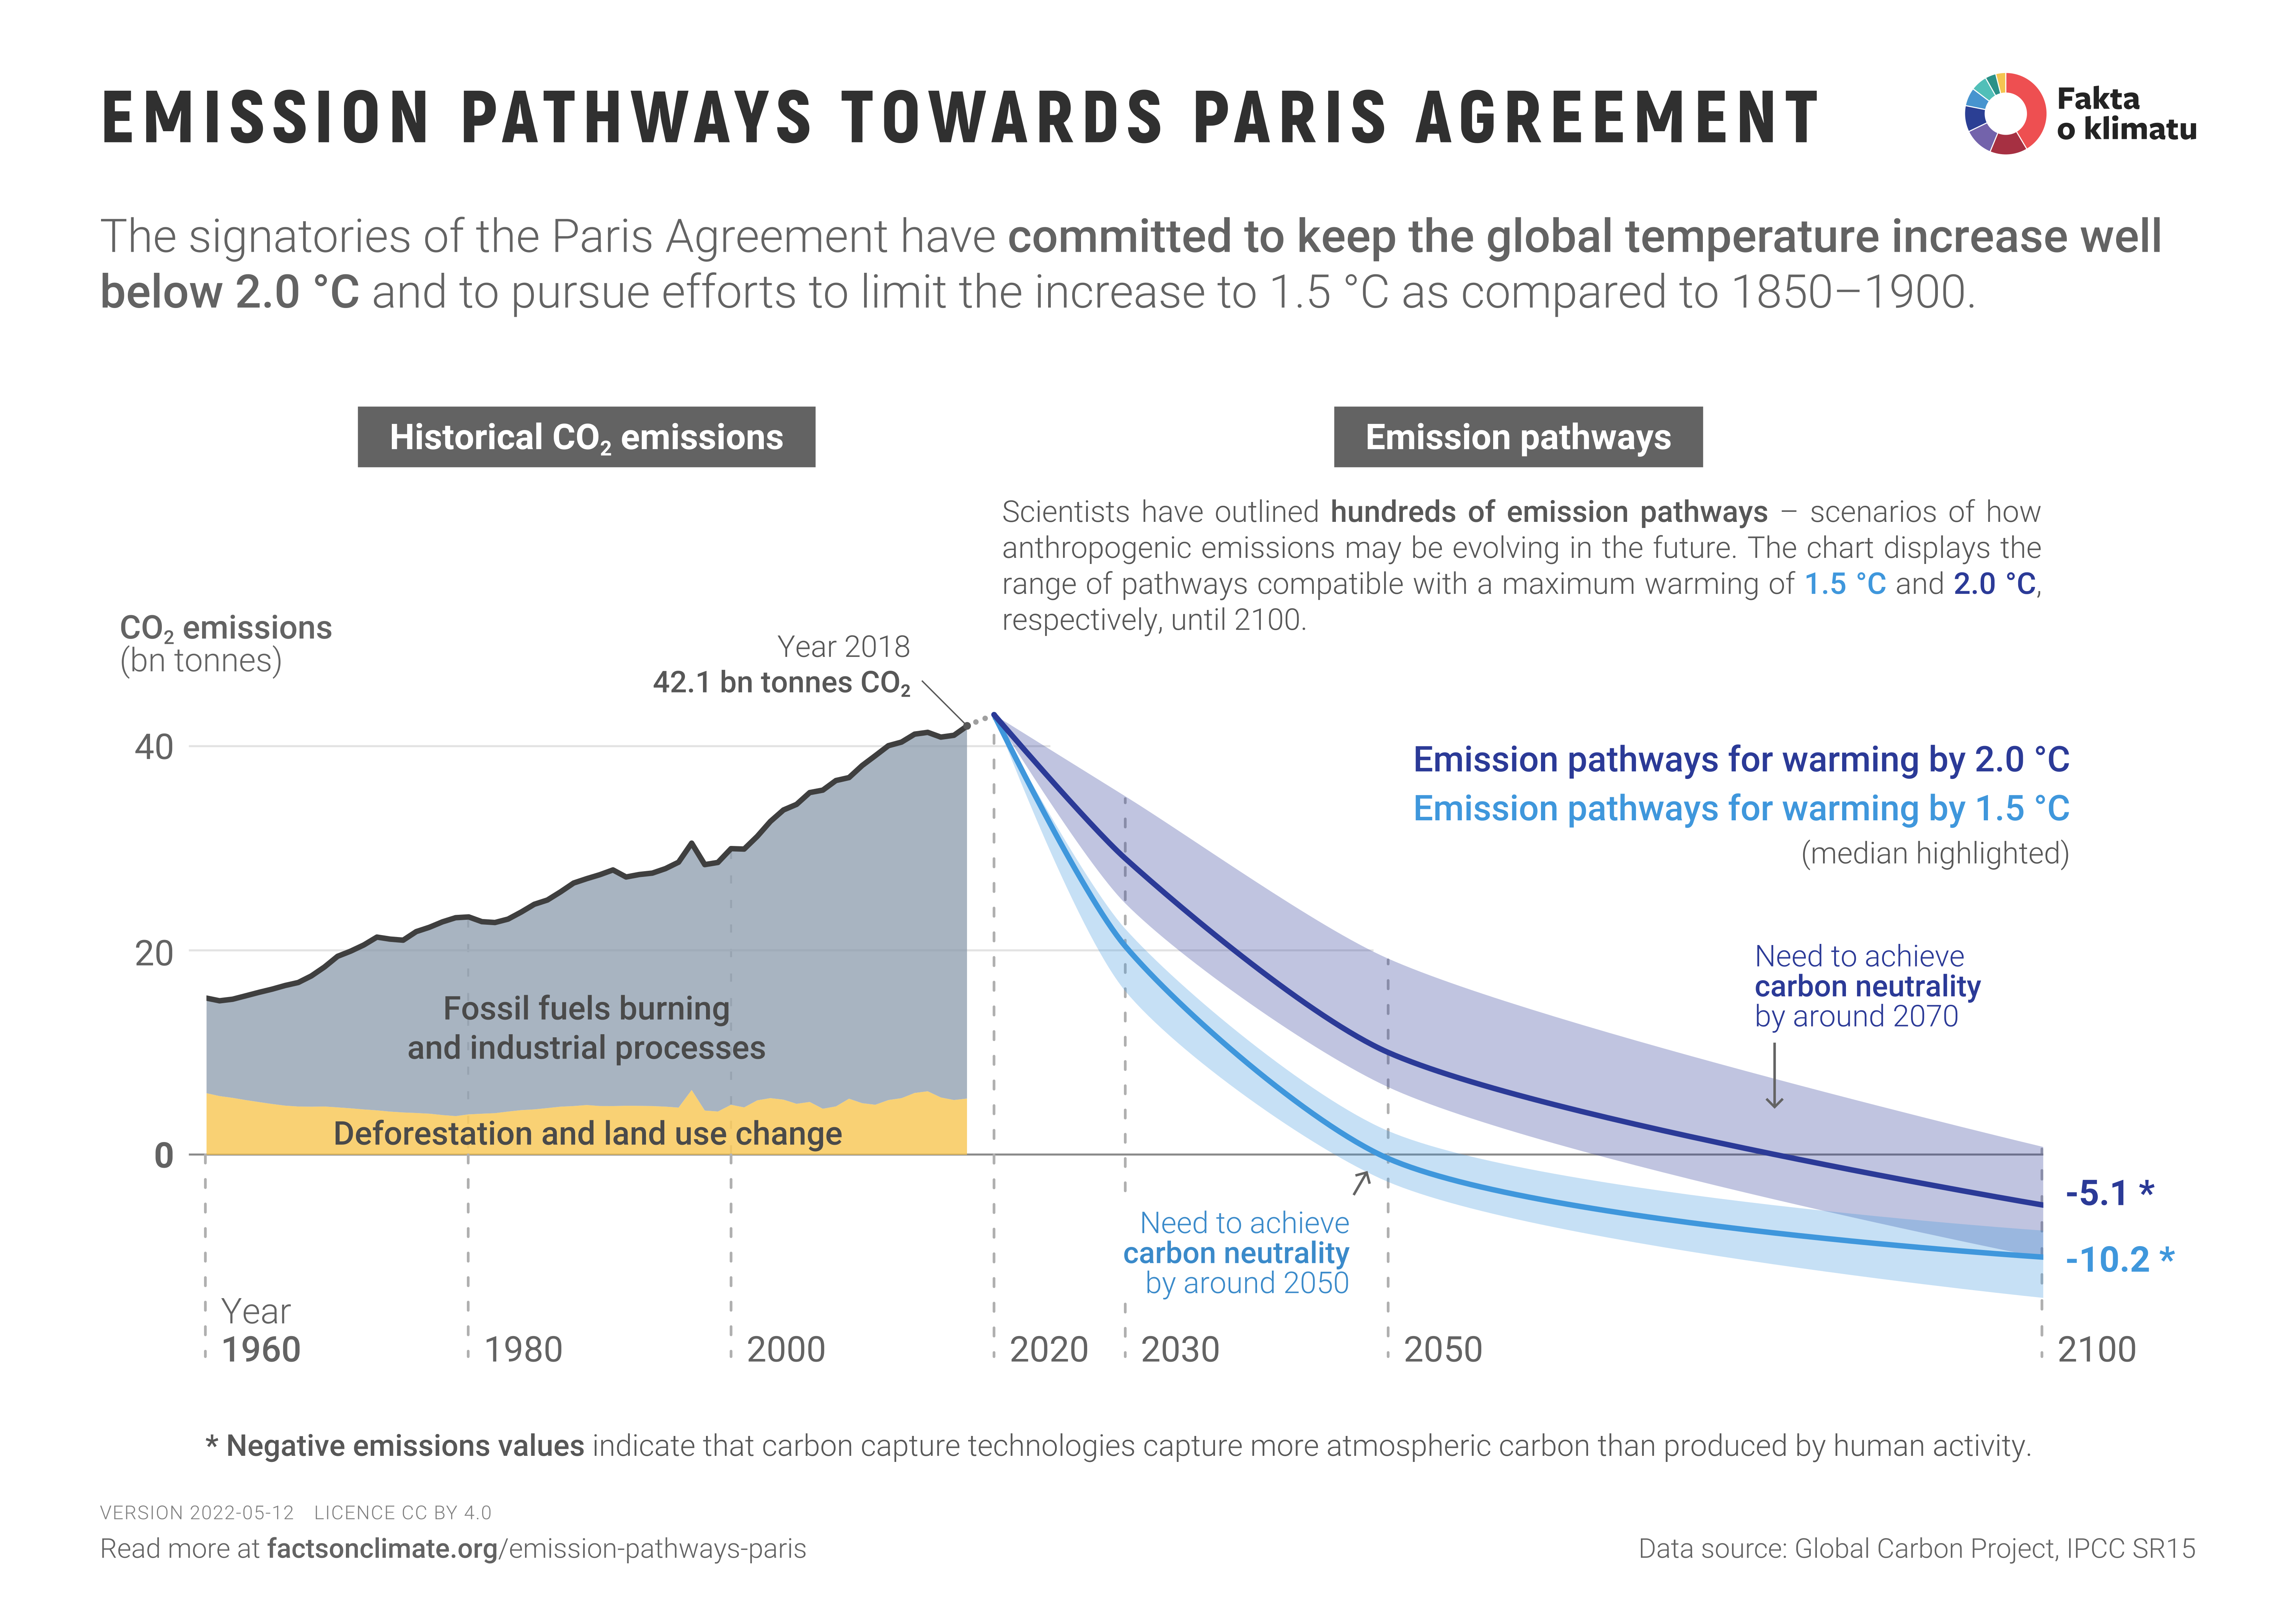


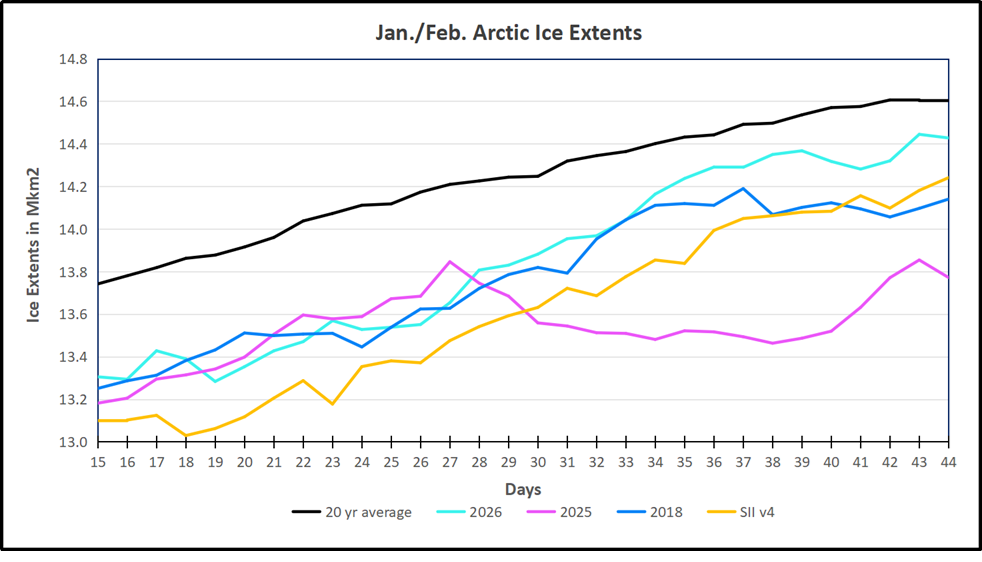


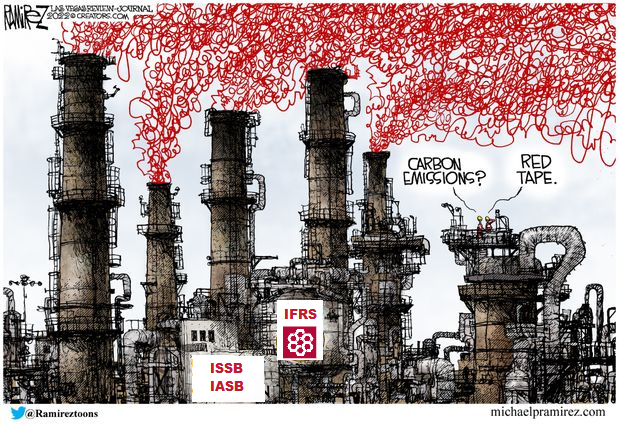
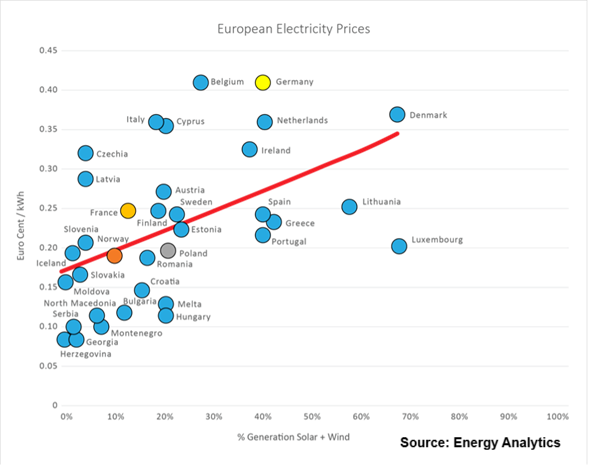


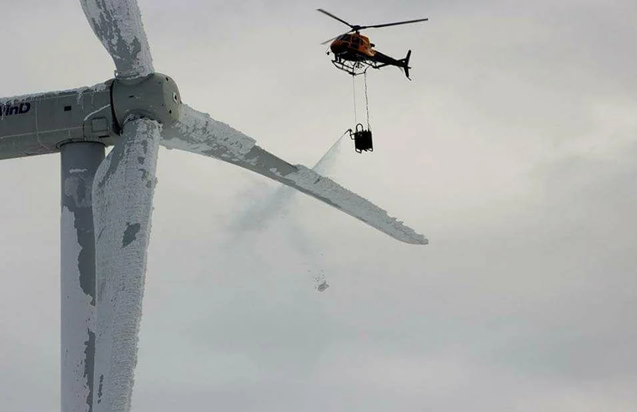


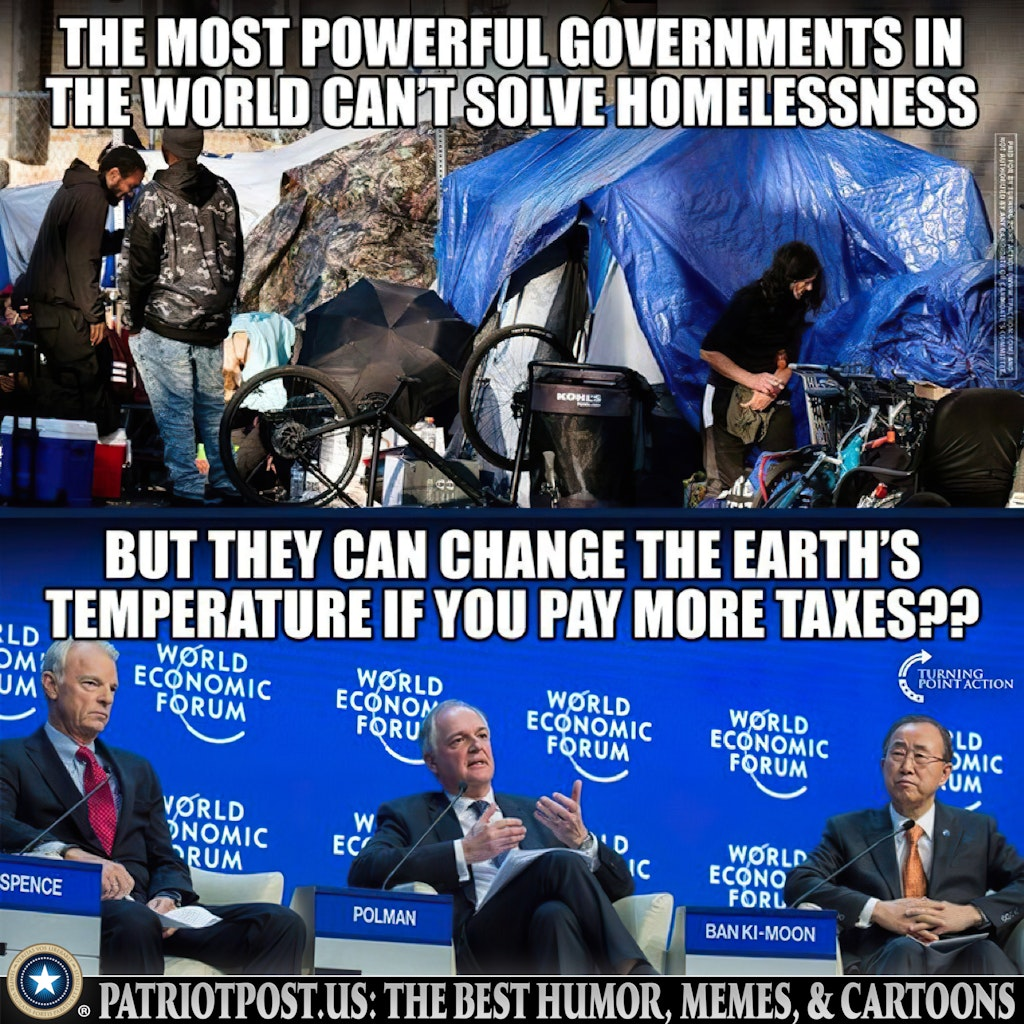

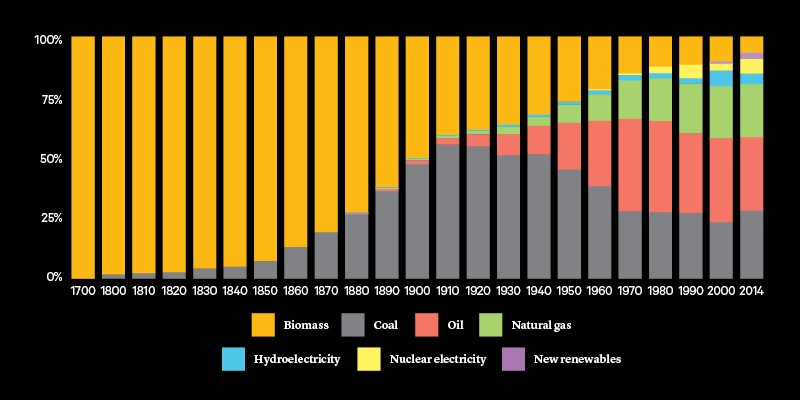

/cdn.vox-cdn.com/uploads/chorus_image/image/57806463/800px_RumfordFireplaceAlc1.0.jpg)