You’re probably seeing headlines like this one from The Hill Insurers pull back as US climate catastrophes intensify. H/T Mark Krebs. As usual, the Climate Card is a coverup for others who really are to blame for losses. The linked article starts to look under the carpet, and I will dig deeper in this post.
Firstly, they label weather events as climate castastrophes in order to blame them on everyone else.
From The Hill:
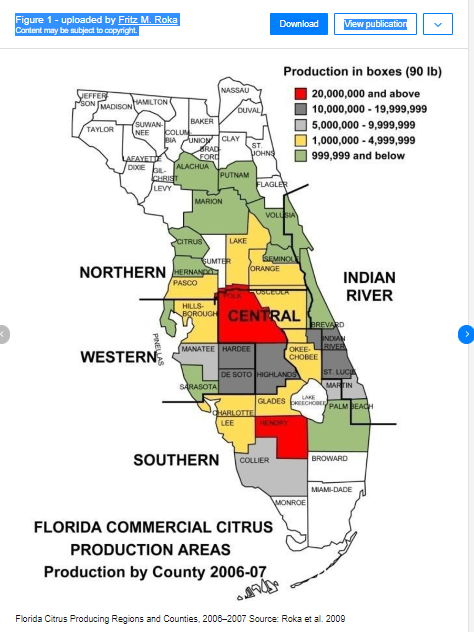
This month Farmers Insurance announced that it will no longer write new property insurance policies in Florida, citing “catastrophe costs … at historically high levels.” AIG also recently stopped issuing policies along the Sunshine State’s hurricane-vulnerable coastline.
State Farm, meanwhile, said in May, that it would impose a moratorium on new policies in California due to “rapidly growing catastrophe exposure.”
Mark Friedlander, director of corporate communications at the Insurance Information Institute, said that dozens of firms have reduced their presence in Louisiana, including 50 that have stopped writing new policies in the state’s hurricane-prone parishes.
Then in the article details, there are other factors causing claims, including bad governance
He noted that while Farmers made headlines, it’s the 15th insurer to stop writing new policies in Florida in the last 18 months. Although most of those companies have not pulled out of the state outright, he added, three have.
“Insurers are in many ways the first movers” in response to trends like extreme weather and natural disasters, Keys said. “They have a significant amount of money at stake, so they’re very exposed to the downside.”
Florida is in a unique position, Friedlander said, because of a combination of high fraud rates and widespread litigation, which both compound the cost of insurance on top of the climate risks. A state law enacted this year creates a backstop for property insurance in hopes of alleviating some costs, but it’s not yet clear how effectively it will counteract those factors, which have been building for years.
“The difference is in California and Louisiana, [insurance costs are] primarily climate-driven,” he said. “They don’t have the manmade factors we have here in Florida.”
“There isn’t an equivalent for wildfires in California, so the risks in California are borne much more directly. [Note: Refers to California wildfires, which are uniquely a problem in that woke state which refuses to apply forestry management best practices.]
Insurance Industry Intends to Leverage Climate Fear
“The industry’s taking the approach now of what’s called predict and prevent, meaning being proactive to address climate risk and make sure insurance coverage reflects that and make sure homes and business take preventative action,” Friedlander told The Hill.
Keys also noted that the decisions don’t mean the insurers will never write policies or operate in the state again. Rather, he said, they should be understood as a way for insurers to negotiate, both on what they can charge in premiums and what factors they can weigh.
“It’s not that [insurers] don’t want to do business in your state, it’s that [they]
don’t want to do business at the current premiums [they] can charge.”
Soaring School Insurance Costs Show How This Works
From Education Week Schools’ Insurance Costs Are Soaring—And Climate Change Isn’t the Only Reason. Excerpts in italics with my bolds.
School districts are just like homeowners, renters, drivers, and small businesses—they need insurance, even as it’s become prohibitively expensive.
The 900-student Davis district in southern Oklahoma spent $61,000, or roughly $68 per student, on liability insurance for the 2019-20 school year. Last school year, the cost for the same coverage was $150,000, or $167 per student. Next school year, it’ll be $261,000, or $290 per student. That’s a 328 percent jump just in two years.
Why is the cost of insurance rising so precipitously? Several factors provide clues.
For one, climate change is causing more frequent natural disasters that affect school district operations and require insurance companies to pay out. And it’s not only districts in hard-hit areas that see higher premiums as a result.
Districts’ coverage costs are increasingly determined by what’s happening nationally, not just in their own communities, said Kelli Hanson, executive director of the Schools Insurance Group, which provides insurance to schools in California.
“The more hurricanes we have in Florida, we’re impacted. The more flooding in the Midwest, we’re impacted,” Hanson said. [Cashing in on Climate?]
Meanwhile, new laws allowing more lawsuits over sexual abuse are putting school districts in an unflattering legal spotlight—while also contributing to higher insurance premiums because of the added legal liability. In California, for instance, a new law passed in 2019 dramatically extends the statute of limitations for plaintiffs to sue over child sexual abuse, including in schools.
The growing frequency of cybercrimes is another factor putting districts at risk. The Shanksville-Stonycreek district in southwestern Pennsylvania saw cybersecurity insurance costs triple after a hacker got access to some of the district’s files in 2019, said Sidney Clark, the district’s business manager and board secretary.
And some districts have adopted controversial policies that are alienating their providers altogether. In Iowa, at least two districts nearly lost insurance coverage recently after they announced that they would be allowing teachers to carry guns on campus. After consulting with other providers who also wouldn’t commit to coverage, both districts have since nixed the policy.
In Oklahoma, one of two main providers of school property and casualty insurance shut down during the pandemic. As a result, Moring said, he has no choice but to sign up with the Oklahoma School Insurance Group (OSIG), no matter what its coverage plan looks like.
In turn, OSIG has struggled to keep rates down for the hundreds of districts in its membership, said Rick Thomas, a retired superintendent who has served as OSIG’s executive director for the last school year.
Over the last three years, Thomas said, OSIG has raised from $14 million to $30 million the amount of money it pays out to districts directly before seeking reimbursement from re-insurers—external companies that charge higher premiums.
School districts aren’t entirely powerless to stop insurance costs from swelling. In many cases, providers want to see that districts are proactively preparing for the unlikeliest scenarios.
Schools with safety plans with details on how they’ll deal with wildfires—what they’re doing to keep shrubbery away from buildings, how they’ll evacuate if necessary, for instance—are more likely to receive favorable insurance coverage, Hanson said.

Background from Previous Post Banking on Climate Alarm
The media are again amping up claims of bad weather to be feared from “climate change.” It is Whack-A-Mole time again, so here is a complete debunking of such media reports, compiled to refute a particularly bad speech by Mark Carney Governor of the Bank of England. H/T Friends of Science
Fact Checking Mark Carney’s Climate Claims is a useful reference document written by Steven Kopits of Princeton Energy Advisors. A few examples below show his systematic dismantling of the alarmist narrative by referencing publically available sources, many of them on government or corporate sites.
Temperatures Rising
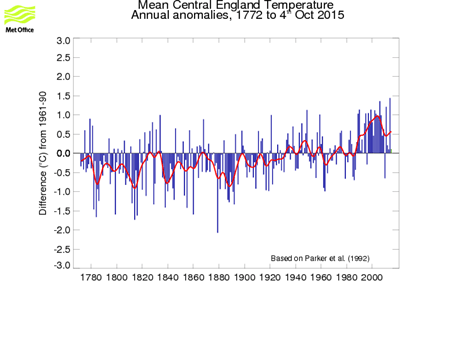
We do have long-time series data for Central England, extending back to 1772. To the extent this measurement is reliable and can be extrapolated to hemispheric averages, it shows a step-up of about 1 deg Celsius from 1980 to 2005, which supports Governor Carney’s assertions. On other hand, it also shows a drop of 0.5 deg Celsius from 2005 to the present—which does not.
Sea Levels
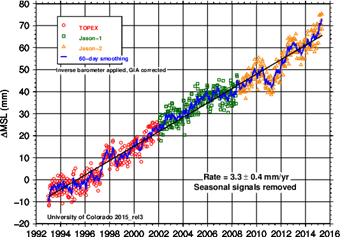
As with just about every other metric the Governor mentions, we have data. Sea level is measured by tide gauges, and also by satellites. Satellite measurements suggest that sea level has been rising steadily by roughly 3 mm / year, which equates to about 1 foot per century.
Weather-related Insurance Losses
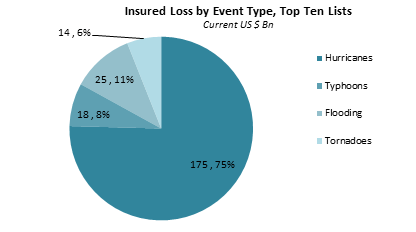
SOURCE: MUNICH RE NATCAT SERVICE
Hurricanes account for 75% of catastrophic losses, with typhoons representing an additional 8%. Thus, hurricanes and typhoons represent $6 of every $7 paid out in ‘top ten’ catastrophic weather-related insurance claims.
And this in turn tells us a great deal about the nature of insurance. Where do insured hurricane losses occur? Principally in the United States. Where do insured typhoon losses occur? Principally in Japan and Taiwan. Why these places? Because all of these are wealthy countries. Hurricane and typhoon losses will be greater where there is, first, a concentration of physical assets, and second, where those assets are valuable. In other words, in the advanced countries exposed to hurricanes and typhoons.
In this, no country is more exposed than the United States. Of overall losses due to top ten catastrophic weather events, nearly 2/3 occurred in the United States alone.
Insured Weather-related Losses

SOURCE: MUNICH RE NATCAT SERVICE
Indeed, if we restrict this to insured losses (including floods and tornadoes), the US accounts for 84% by itself. Thus, if we are speaking of insured weather-related losses, as a practical matter we are speaking of hurricane damage in the US. The rest is largely incidental. For example, Superstorm Sandy caused more insured losses in one event than the cumulative and collective top ten catastrophic, weather-related losses from Europe, China, and Japan since 1980. And Sandy was only the second worst insurance event in recent times.
Now, why are US losses so great? Is it due to the number or strength of storms making landfall in the United States?

GLOBAL HURRICANE FREQUENCY SOURCE: RYAN MAUE
In fact, there is no such pattern discernible in the data. Indeed, the last few years have seen fewer than average hurricanes globally, with a recovery to up-cycle numbers in the last year or so.
Rather, reinsurance data hints at the source of losses: higher payouts for assets in harm’s way.

INSURED LOSSES AS A PERCENT OF OVERALL LOSSES, TOP TEN LISTS, 1980-2014 SOURCE: MUNICH RE NATCAT SERVICE
Further, more and more expensive assets are exposed to hurricanes in particular. In the US, for example, ever more people are living on the coasts, and beach front property has become prized and expensive. One need only look out the window on a flight approaching Miami International Airport to be appalled at the sheer concertation of high-end housing built just above sea level on islands dotting Florida’s Atlantic Coast. How long until a hurricane wipes a good number of these off their foundations? And what kind of insurance losses will that involve?
Indeed, an examination of catastrophic losses suggests a decisive role for government policy. Hurricane Katrina, which destroyed New Orleans in 2005, represents alone more than one-quarter of all insured top ten losses globally since 1980. In just one event.
The article goes on to deal with other claims regarding Floods, Droughts, Tornadoes, and Wildfires before reaching this conclusion.
Summing Up
In his speech to London’s insurance community, Mark Carney, Governor of the Bank of England, asserted a series of claims about climate change. Some of these are widely accepted. The climate does change. The world has warmed. Atmospheric CO2 has increased, half of the increment due to human activities.
Beyond this, there is no consensus, and indeed, the available data in many cases directly refutes the Governor’s more extreme assertions. There is no consensus that humans are the primary drivers of climate change. As we can see, sea levels, for example, were rising well before the 1950s date Carney gives as the start of modern anthropogenic warming.
Importantly, the increase in losses since the 1980s is more likely to reflect expanded insurance coverage, increasing payouts as a percent of losses incurred, and an increased number of assets with higher values placed in harm’s way. Losses increases have not occurred due to increases in hurricane, tornado, flooding, drought or fire frequency or strength, at least not in the United States, which represents the lion’s share of insurance claims. In many cases, either frequency or intensity of weather-related events has actually declined. Sea level rise has not accelerated, not as measured by either satellites or tide gauges. Sea level has been rising for well over 100 years, and continues on that pace.
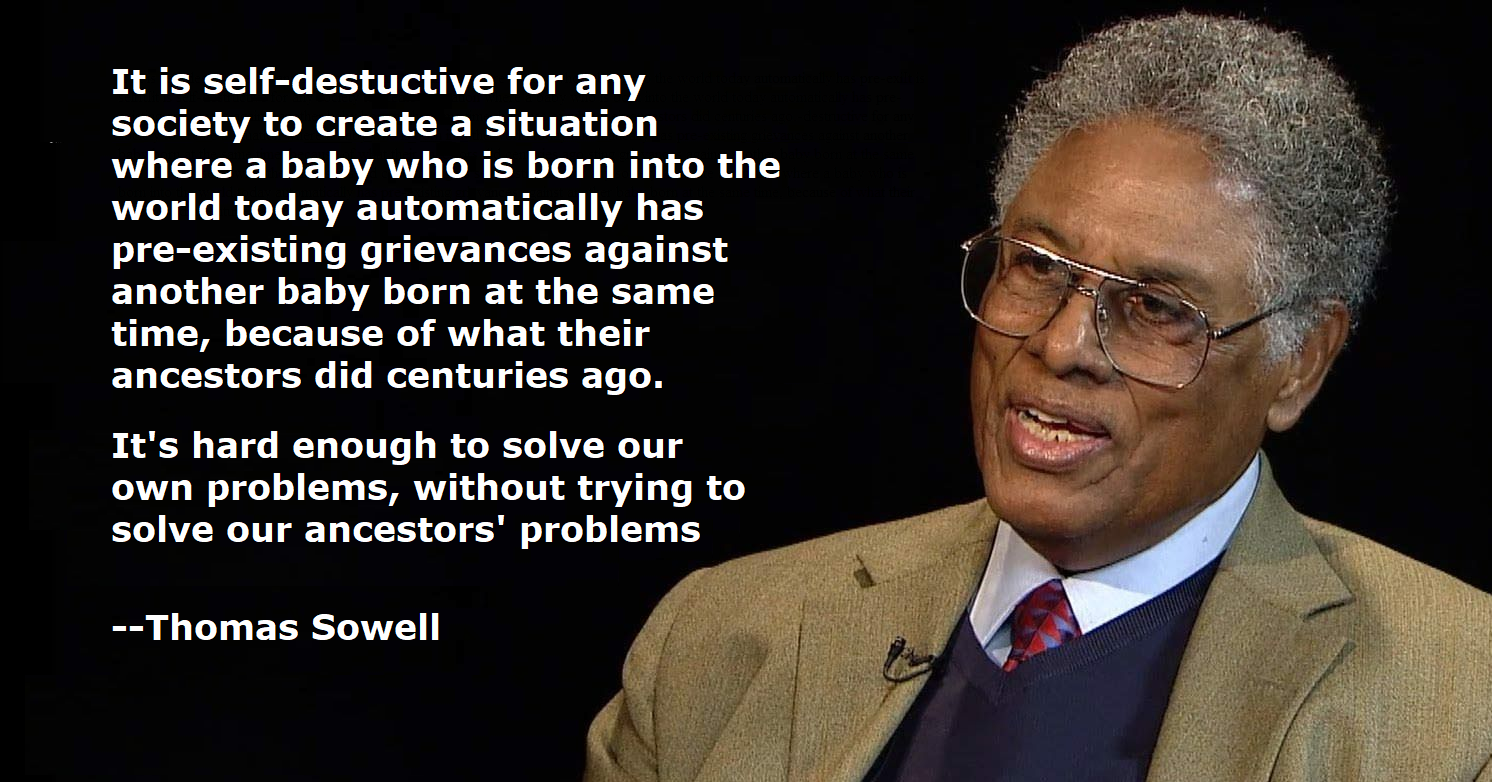
Like so many other economists, Governor Carney seems to operate under the assumption that current CO2 levels are just on the edge of some catastrophic acceleration. For some reason, 320 ppm of atmospheric CO2 is safe, but 540 ppm is not, because there is some precipice—an inflection point or boundary—between here and there. The limit is not 1,000 ppm, or 5,000 ppm, or 42,448 ppm, but right here, right now. A little more CO2, a trace more of a harmless trace gas, and we are doomed.
The climate is complex and the future uncertain. It is possible the worst fears may prove correct. Nevertheless, such an assertion is not supported by the historical data, not for US droughts, floods, tornados, hurricanes or fires. But it does show up. In politics. If sea levels were 20 cm higher in New York and this contributed to the damage from Superstorm Sandy, well, any middling analyst could have predicted the rise back in 1940, just as we can predict today that sea levels will be one foot higher a century hence. The failure was not of CO2 emissions, but squarely a failure of governance. And that goes doubly so for the fate of New Orleans. If Governor Carney wanted to make a constructive proposal, he should have called for Lloyds to create macro audits of risk zones and censure or refuse to insure jurisdictions where governance is not up to par. If insurers had refused to insure New Orleans unless the levees were sound, they could have saved themselves $30 bn in payouts and probably twice that in losses.
As an analyst, I find Mr. Carney’s speech is truly dismaying. For the Governor of the Bank to claim that climate change is leading to rapidly rising insurance claims is, at best, a critical failure of analysis. As discussed above, insurance claims are a function of a number of factors, including the type and country of the weather event, as well as the extent of insurance coverage and payout ratios. A hurricane in the US may see one hundred times the payouts of a major flood in India. Payouts will rise as a function of nominal GDP, as both inflation and the value and concentration of assets will play a crucial role in overall losses. The specific path of a storm can also be decisive for global averages. It goes without saying that a storm which strikes in Philadelphia, marches up the New Jersey coast, slams into the Manhattan and turns towards New Haven is going to cost a bundle. That same storm hitting, say, rural Mississippi would cause a fraction of the monetary damages. And this matters, because Superstorm Sandy caused more insured damages than all the leading weather events in Europe, Japan, and China combined. Single events can move long-term global averages.
If the Bank missed this, it is not because the necessary data is hard to find. Information on weather-related events is readily and publicly accessible on the internet. Almost every graph I use above relating to hurricanes, tornadoes, floods and droughts comes from the US government itself. Apparently, the Bank of England could not be bothered to consult the underlying climate data before making hyperbolic claims. Thus, at best, the Bank was careless with data analysis.
A worse interpretation of events suggests that Mr. Carney was willing to blindly accept the conventional wisdom, the ‘consensus of scientists’ regarding global warming, without any will or curiosity to dig deeper and form a personal view. One can only hope that monetary policy in the UK is not informed by such superficiality or passivity.
The very worst interpretation is that Mr. Carney is in fact aware of the source data, but chose to make hysterical claims to promote a personal political agenda. I cannot imagine a more ill-considered idea. For those of us who consider central bank independence sacred, the appearance of a national bank taking sides in a highly charged political debate—and doing so with scant regard for the underlying data—will establish the Bank of England as partisan and the political opponent of conservative politicians. Given that Janet Yellen, the Chairman of the US Federal Reserve Bank, hails from Berkeley, a hot bed of climate activism, should the Republican Party consider the Fed also its opponent? If so, I can assure you, the Republicans will find some support to ‘audit’ the institution.
At the end of the day, political neutrality is a pre-condition for central bank independence. If a political party deems the central bank to be an opponent, then it will take measures to gain political control over the bank, with the result that monetary policy itself may become politicized. If the Bank nevertheless feels compelled to champion a particular side in a political debate, its analysis must be water-tight and its communication, impartial. That Governor Carny violated both dictums is simply stunning and a huge blow to the prestige of the Bank of England. It was a very bad call indeed.
More anti-alarmist information at Climate Whack-A-Mole