September 2025 Arctic Ice Outlook
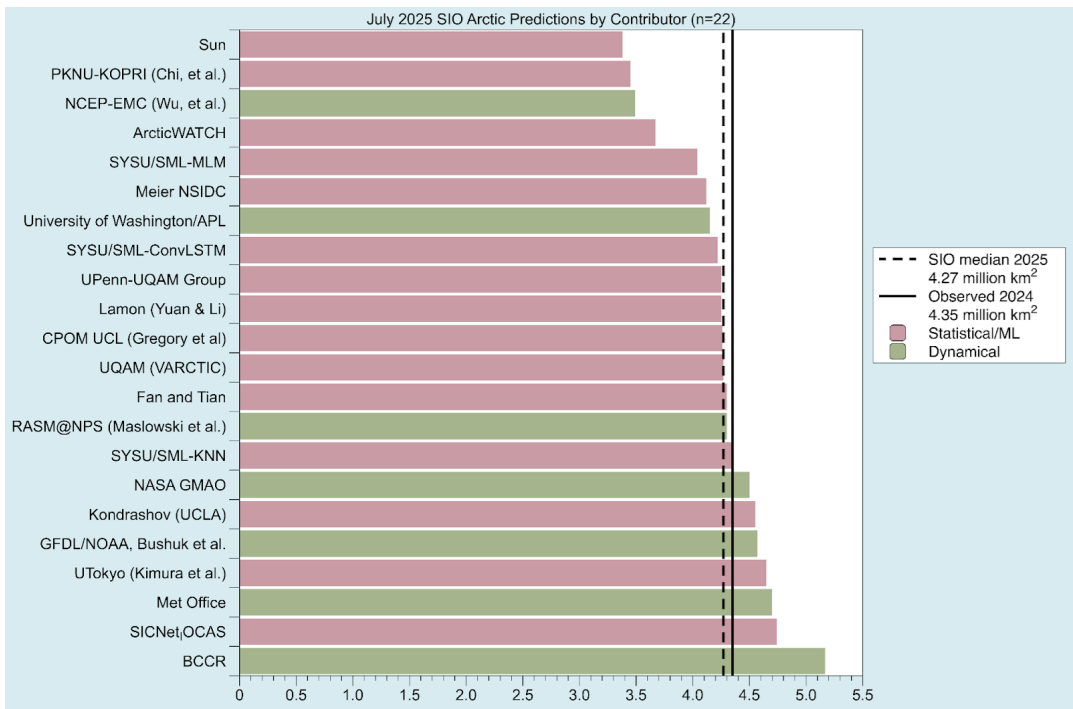
Figure 1. Distribution of SIO contributions for July estimates of September 2025 pan-Arctic sea-ice extent. Public/citizen contributions include Sun.
2025: July Report from Sea Ice Prediction Network
The July 2025 Outlook received 22 pan-Arctic contributions (Figure 1). This year’s median forecasted value for pan-Arctic September sea-ice extent is 4.27 million square kilometers with an interquartile range of 4.13 to 4.54 million square kilometers. This is lower than observed in 2023 (4.37 million square miles) and 2024 (4.35 million square miles) observed in September. The lowest sea-ice extent forecast is 3.38 million square kilometers, from Sun, which would be a new record low for the satellite period (1979-present); the highest sea-ice extent forecast is 5.17. . . The observed extent values are from the NSIDC Sea Ice Index (Fetterer et al., 2017), based on the NASA Team algorithm sea ice concentration fields distributed by the NASA Snow and Ice Distributed Active Archive Center (DAAC) at NSIDC (DiGirolamo et al., 2022; Meier et al., 2021).
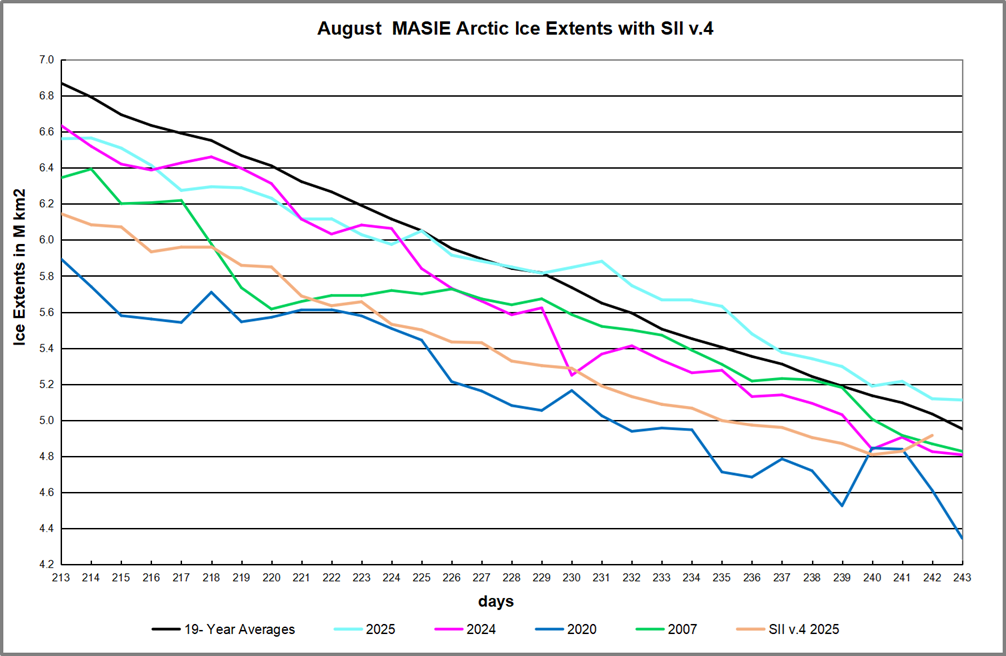
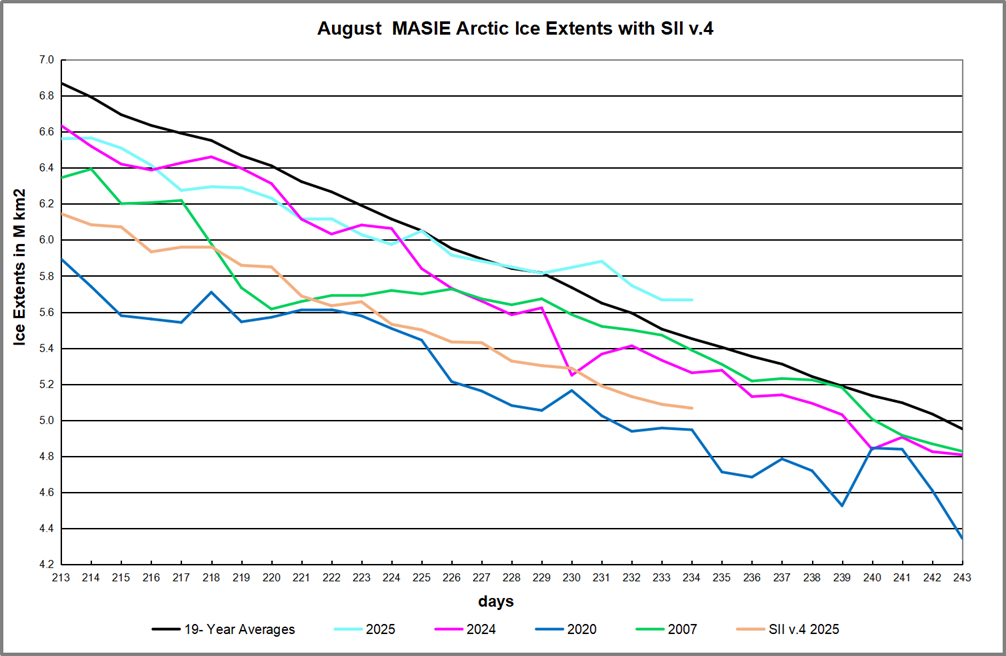
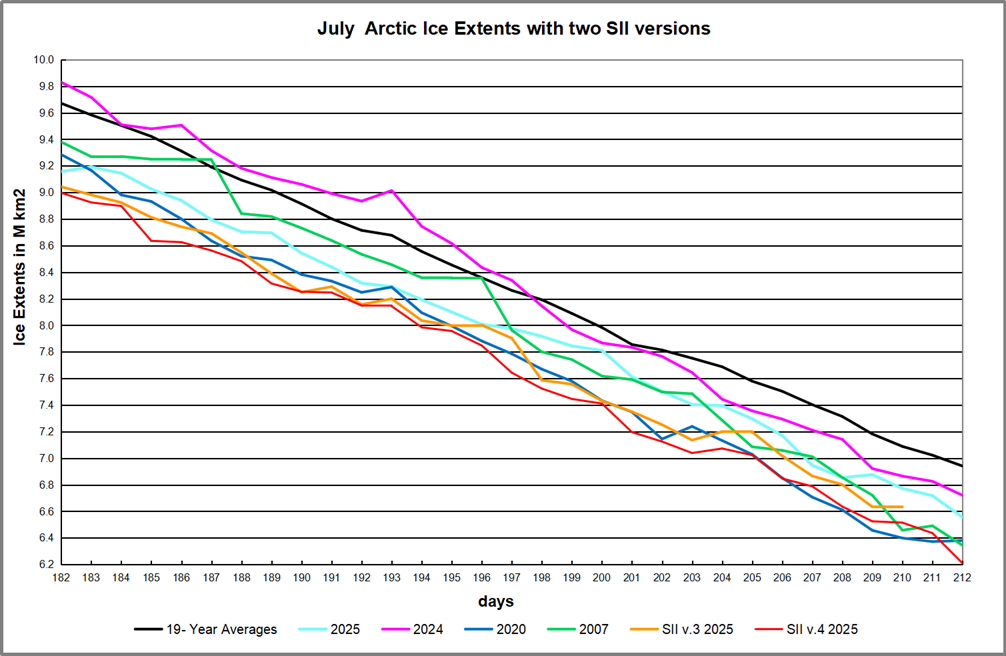
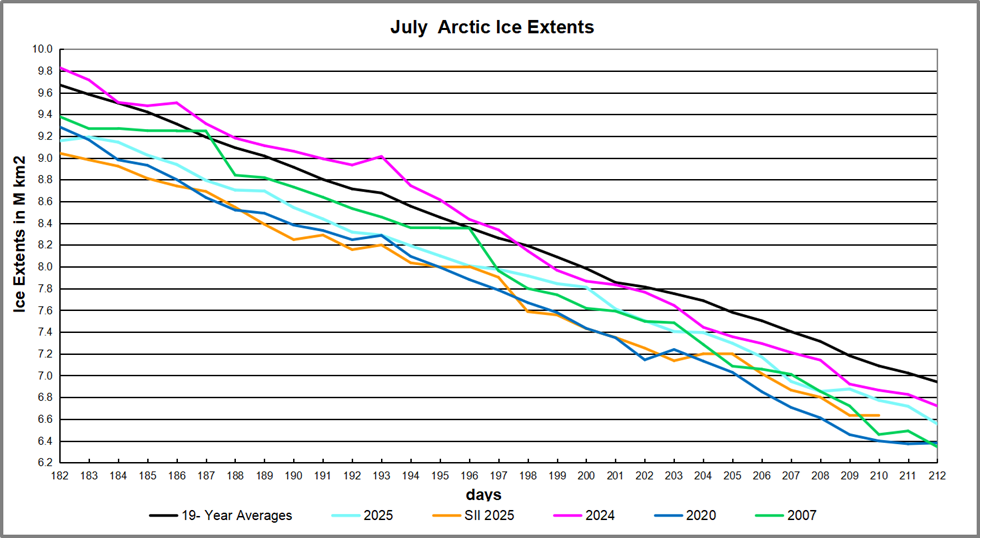
These are predictions as of August 20 for the September 2025 monthly average ice extent reported by NOAA Sea Ice Index (SII). This post provides a look at the 2025 Year To Date (YTD) based on monthly averages comparing MASIE and SII datasets. (19 year average is 2006 to 2024 inclusive).
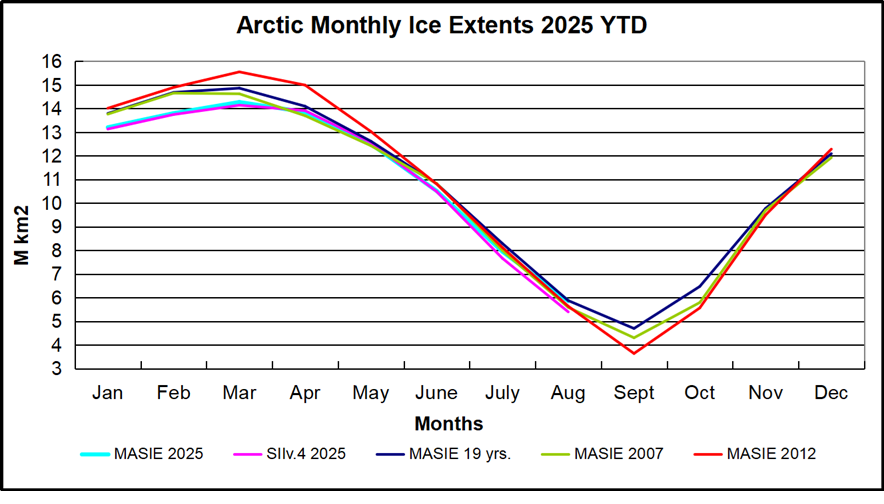
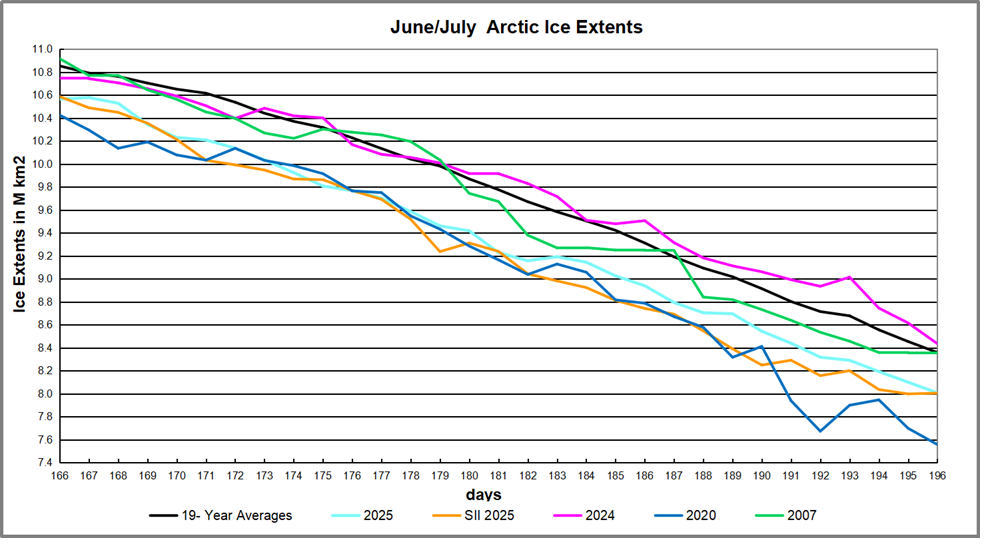
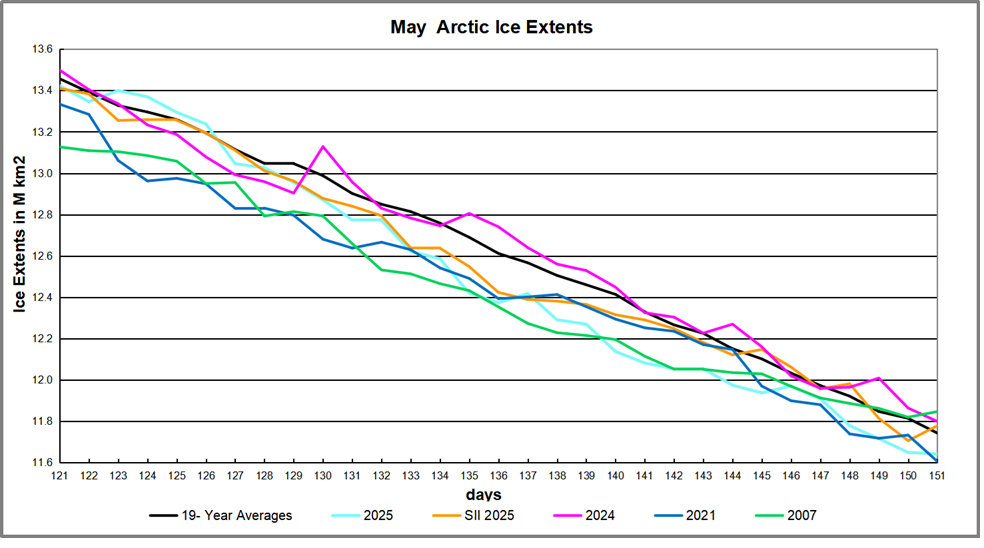
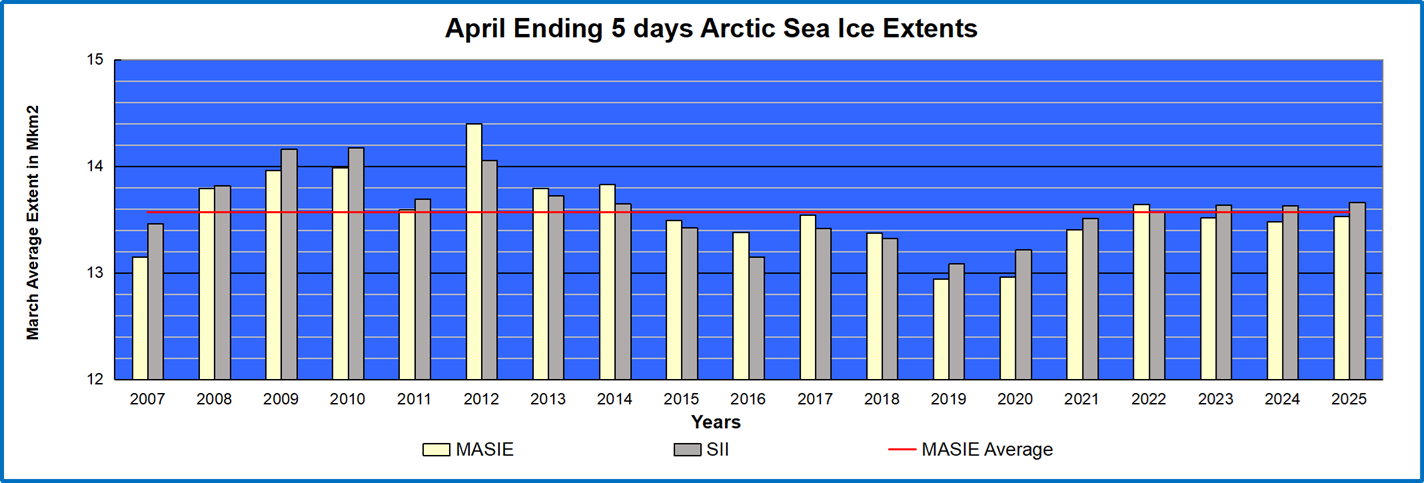
The graph puts 2025 into recent historical perspective. Note how 2025 was slightly below the 18-year average for the first 3 months, then tracked closely to average through August. The outlier 2012 provided the highest March maximum as well as the lowest September minimum, coinciding with the Great Arctic Cyclone that year. 2007 began the period with the lowest minimum except for 2012. SIIv.4 2025 tracked closely to MASIE the first 6 months, then dropped lower July and in August 459k km2 below MASIE 2025 and also lower than 2007 and 2012.
The table below provides the monthly Arctic ice extent averages for comparisons (all are M km2)
| Monthly | MASIE 2025 | SIIv.4 2025 | MASIE -SII | MASIE-19yr AVE | SIIv.4-19yr AVE |
| Jan | 13.206 | 13.131 | 0.075 | -0.583 | -0.470 |
| Feb | 13.802 | 13.745 | 0.057 | -0.878 | -0.715 |
| Mar | 14.274 | 14.140 | 0.134 | -0.587 | -0.545 |
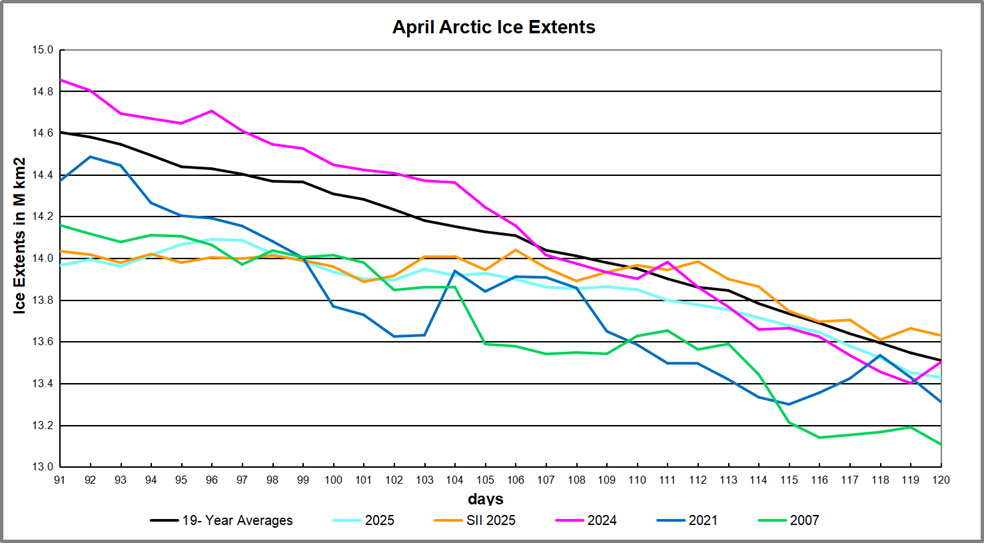
| Apr | 13.846 | 13.910 | -0.063 | -0.249 | -0.109 |
| May | 12.497 | 12.559 | -0.062 | -0.119 | -0.108 |
| June | 10.510 | 10.485 | 0.025 | -0.306 | -0.388 |
| July | 7.942 | 7.660 | 0.282 | -0.345 | -0.375 |
| Aug | 5.854 | 5.395 | 0.459 | -0.020 | -0.220 |
The first two data columns are the 2025 YTD shown by MASIE and SII, with the MASIE surpluses in column three. Column four shows MASIE 2025 compared to MASIE 19 year averages, while column five shows SII 2025 compared to SII 19 year averages. YTD August MASIE started the year in deficits to average but recovered in spring to virtually match average in August. SII was below its averages throughout and much lower than MASIE in July, and in August down by nearly half a Wadham.
Current Arctic Ice Extent Conditions
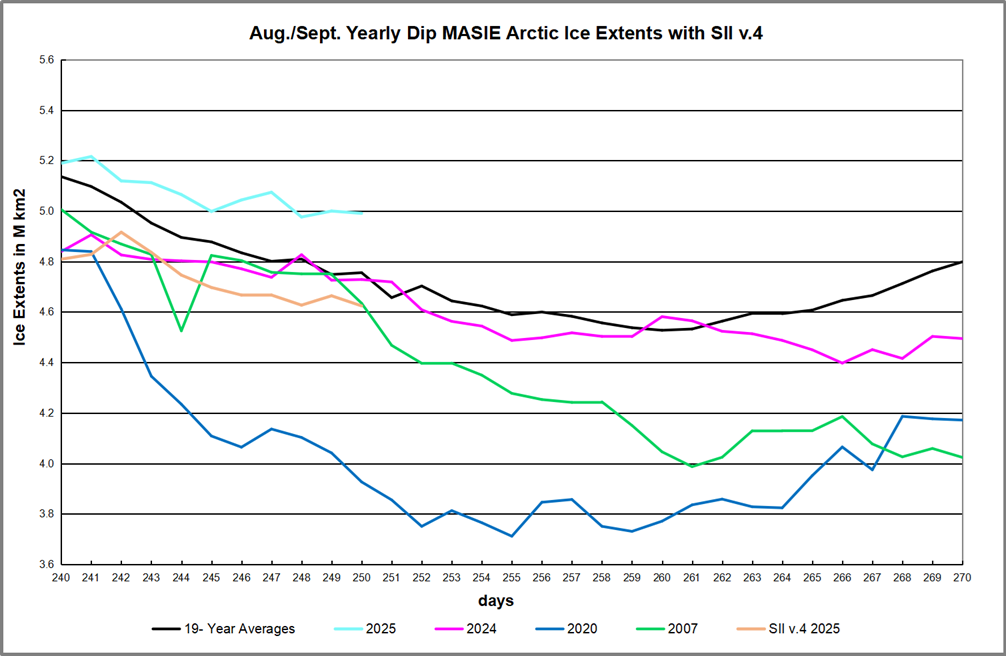
This 30 day period shows the annual dip in arctic ice extents, the daily lowest value coming on or about day 260, ten days from now. Currently MASIE shows Arctic ice tracking well above average with a surplus of 235k km2 yesterday. Both 2007 and 202 were much below average, while 2024 nearly average at the minimum. SIIv.4 has been reporting lower extents, in the range of 300 to 400k km2 less than MASIE, yesterday a deficit of 367k km2.
After the dip there will be continuing recovery of ice extent, with end of September usually higher than the beginning. The September monthly average will be interesting to compare.
Summary
The experts involved in SIPN are expecting SII 2025 September to be somewhat lower than recent years. The way MASIE is going, this September looks to be above its average, and much higher than SII. While the daily minimum for the year occurs mid September, ice extent on September 30 is typically close to the ice extent on September 1.
Footnote:
Some people unhappy with the higher amounts of ice extent shown by MASIE continue to claim that Sea Ice Index is the only dataset that can be used. This is false in fact and in logic. Why should anyone accept that the highest quality picture of ice day to day has no shelf life, that one year’s charts can not be compared with another year? Researchers do this, including Walt Meier in charge of Sea Ice Index. That said, I understand his interest in directing people to use his product rather than one he does not control. As I have said before:
MASIE is rigorous, reliable, serves as calibration for satellite products, and continues the long and honorable tradition of naval ice charting using modern technologies. More on this at my post Support MASIE Arctic Ice Dataset

MASIE: “high-resolution, accurate charts of ice conditions”
Walt Meier, NSIDC, October 2015 article in Annals of Glaciology.