Arctic Ice March Maximum 2025 in Perspective

The animation shows end of March Arctic ice extents on day 91 over the last 19 years (length of MASIE dataset). Of course central Arctic basins are frozen solid, and the fluctuations are visible on the marginal basins both the Atlantic side (right) and the Pacific (left). Note the higher extents in 2012, followed by lesser ice, then overcome by 2024.
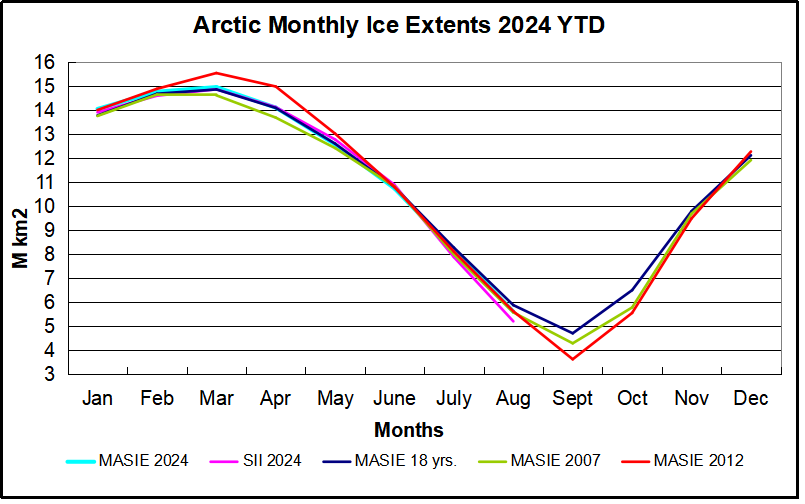
Climatology takes the March monthly average to indicate the annual maximum and September average as the minimum. Dynamically, the Arctic gains and loses ice extents in this pattern:
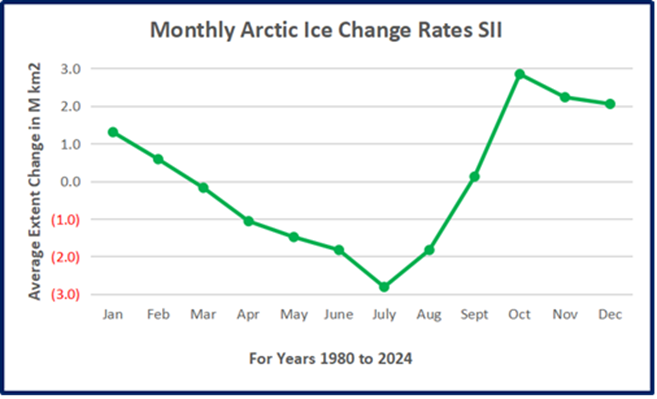
The values in the chart are the month ending ice extents (last five days average) minus the ice extents at end of the previous month. Thus positive numbers show ice gained each month, negative numbers ice lost in a given month. SII (Sea Ice Index) provides a data file calculating and updating these results since 1980. Note that the peak month of March on average declines very slightly, while the minimum month of September on average gains a little ice extent. Also the greatest average gain of ice is in October and the greatest loss of extent is in July.
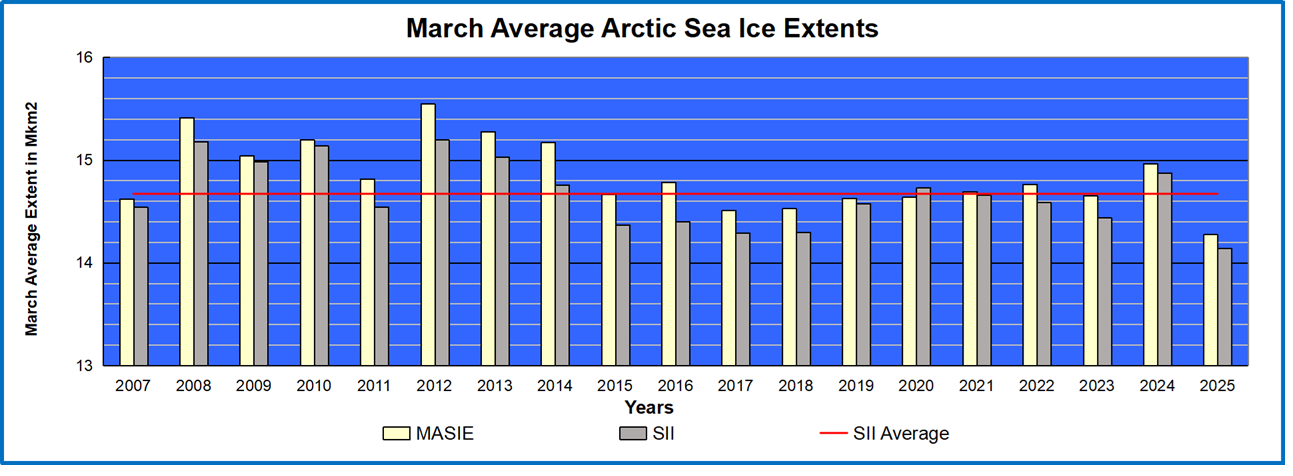
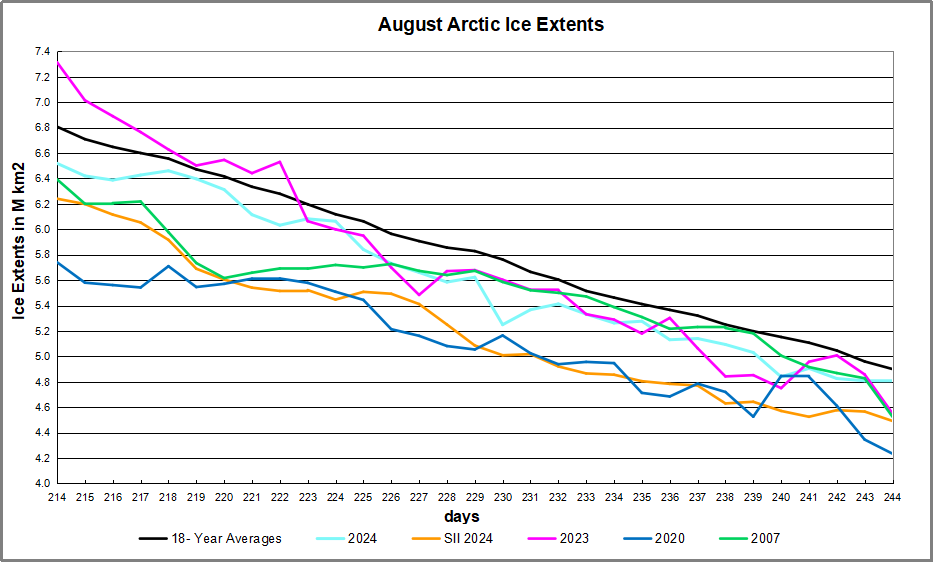
Above is a chart of March Monthly averages since 2007. The variability shows, including 2024 well above the 19-year average and 2025 well below.
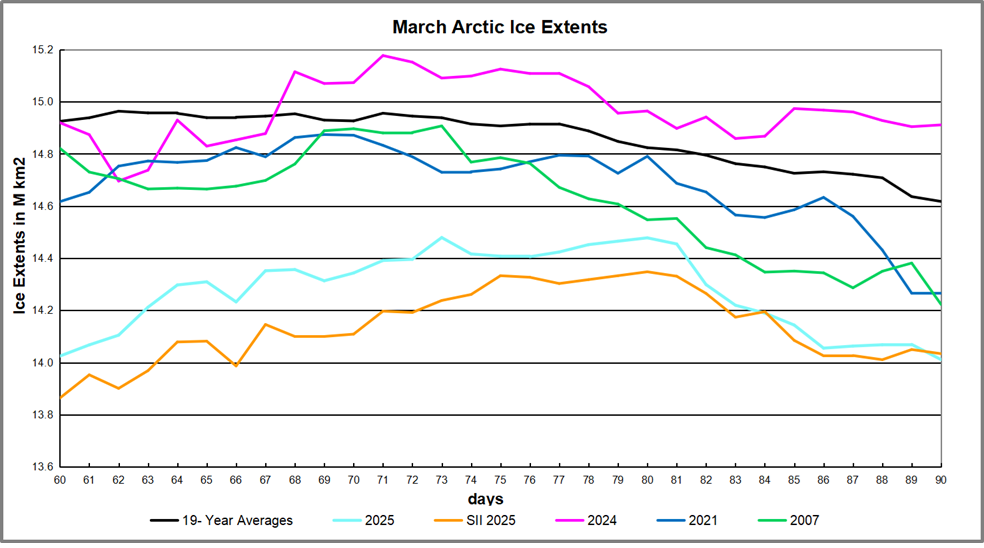
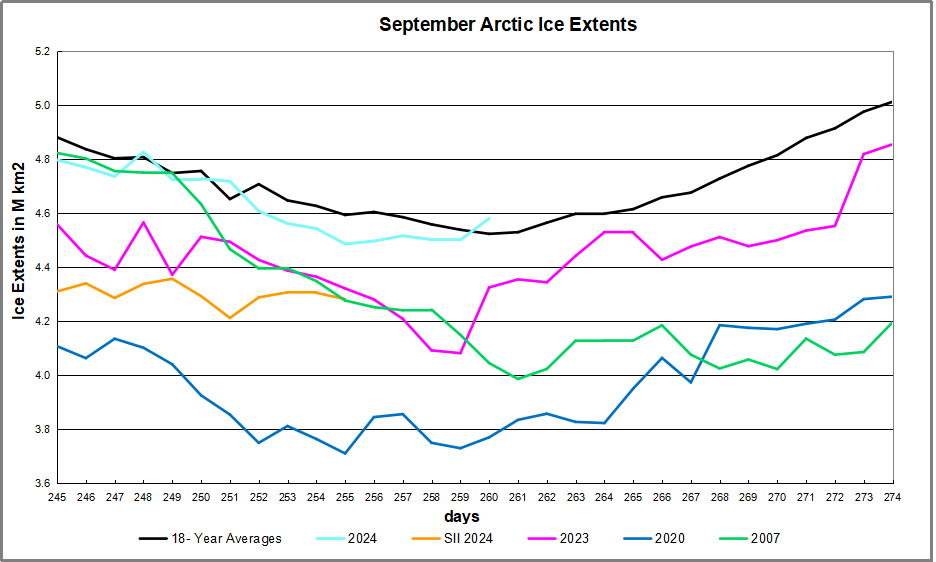
This graph shows variations of ice extents during March, on average and for some recent years along with 2007. The exceptional extents in 2024 stand out, along with the more typical 2021 and 2007. On average during March the Arctic loses about 400k km2 of ice. 2025 started March at 14M km2, about 900k km2 in deficit, and ended virtually the same 14M, 600k km2 below average on day 90. SII was slightly lower than MASIE for three weeks, then ended about the same.
The table below shows the distribution of ice extents across the Arctic regions.
| Region | 2025090 | Ave Day 090 | 2025-Ave. | 2007090 | 2025-2007 |
| (0) Northern_Hemisphere | 14011379 | 14617665 | -606287 | 14222916 | -211537 |
| (1) Beaufort_Sea | 1071001 | 1070241 | 760 | 1069711 | 1290 |
| (2) Chukchi_Sea | 965989 | 964237 | 1752 | 966006 | -17 |
| (3) East_Siberian_Sea | 1087137 | 1086266 | 871 | 1074908 | 12229 |
| (4) Laptev_Sea | 897845 | 897098 | 747 | 884340 | 13505 |
| (5) Kara_Sea | 885597 | 920703 | -35106 | 892157 | -6560 |
| (6) Barents_Sea | 450824 | 664324 | -213500 | 441970 | 8854 |
| (7) Greenland_Sea | 703578 | 665146 | 38433 | 686312 | 17266 |
| (8) Baffin_Bay_Gulf_of_St._Lawrence | 1350818 | 1386137 | -35320 | 1217467 | 133351 |
| (9) Canadian_Archipelago | 854878 | 853269 | 1609 | 850127 | 4751 |
| (10) Hudson_Bay | 1260903 | 1255273 | 5631 | 1229995 | 30908 |
| (11) Central_Arctic | 3237488 | 3234612 | 2876 | 3242236.7 | -4749 |
| (12) Bering_Sea | 593465 | 711340 | -117875 | 814787.71 | -221323 |
| (13) Baltic_Sea | 20341 | 62183 | -41842 | 45896.93 | -25556 |
| (14) Sea_of_Okhotsk | 628758 | 836750 | -207992 | 794657 | -165899 |
Overall 2025 Arctic ice is 4% below the 19 year average and 1% below 2007. About half of the 606k km2 deficit is in the Pacific basins of Bering and Okhotsk, typically the first to go to open water. The other major case of early melting is in the Atlantic Barents Sea.
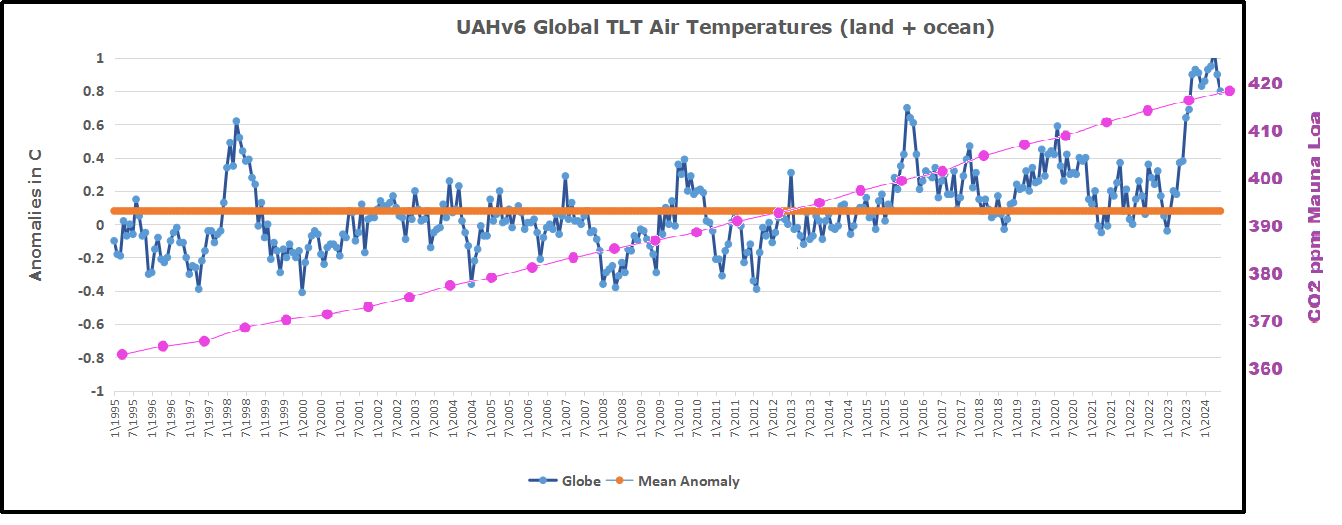
Why is this important? All the claims of global climate emergency depend on dangerously higher temperatures, lower sea ice, and rising sea levels. The lack of additional warming prior to 2023 El Nino is documented in a post Ocean Warms, Land Cools UAH February 2025.

The lack of acceleration in sea levels along coastlines has been discussed also. See Observed vs. Imagined Sea Levels 2023 Update
Also, a longer term perspective is informative:


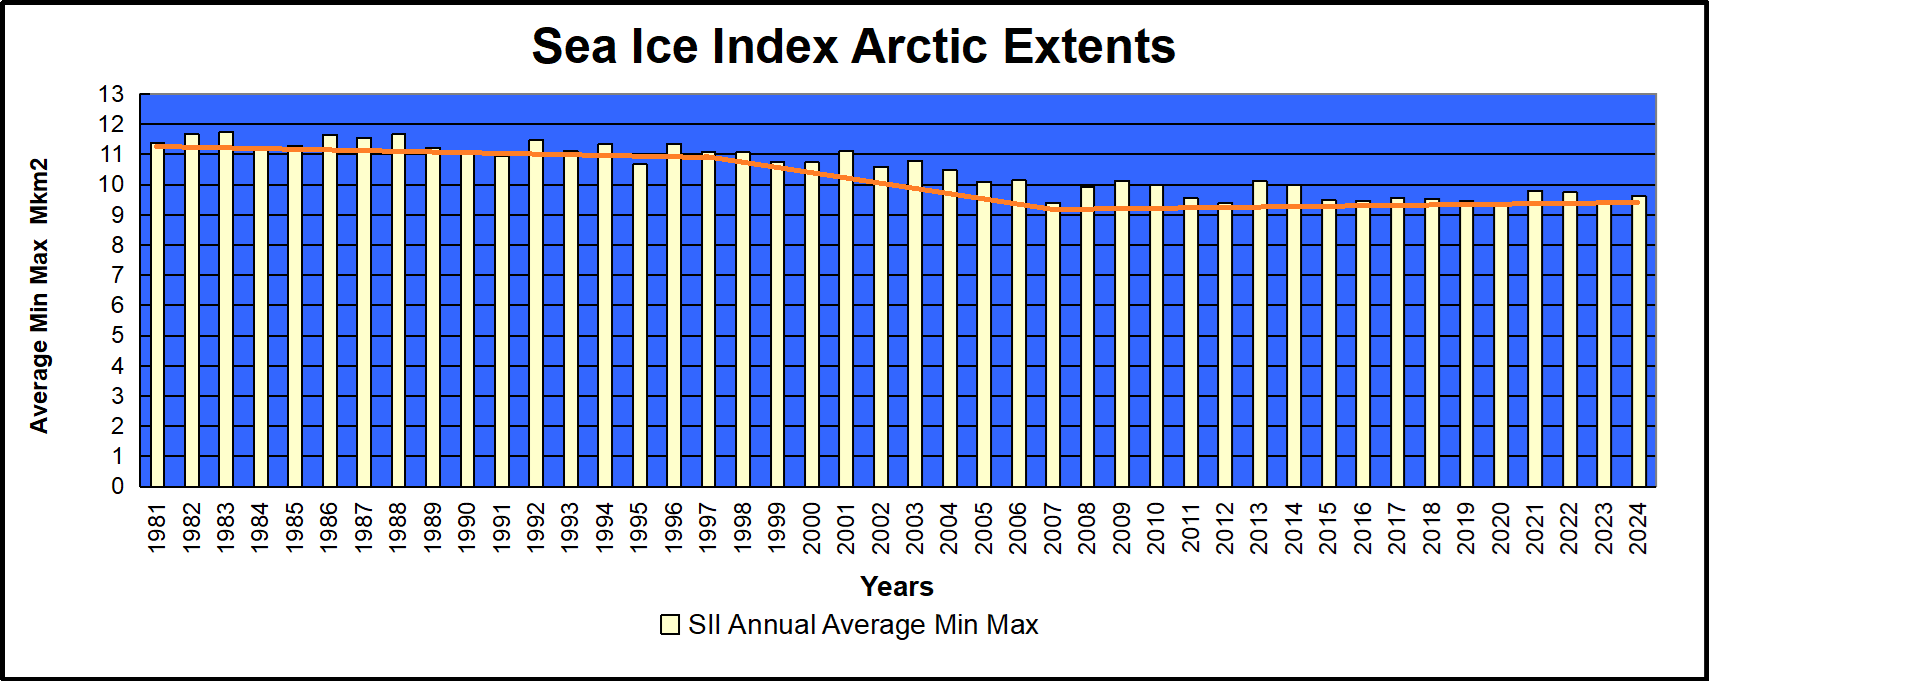


 The table below shows the distribution of Sea Ice on day 260 across the Arctic Regions, on average, this year and 2007. At this point in the year, Bering and Okhotsk seas are open water and thus dropped from the table.