Be Grateful for the Warming We Have

A reminder that we are presently in the icy end of the Holocene epoch comes in a CBC story Canada’s High Arctic was once a lush forest where unexpected animals roamed.  Excerpts in italics with my bolds and added images.

Camels and beavers that evolved in ancient forests in the Far North
were perfectly adapted for our world today

Modern camels descend from giant High Arctic camels that lived in Canada’s North before the Ice Age. (Global Mechanic/Courtesy of Handful of Films)

By Niobe Thompson, director of Frozen in Time

When you think of the Canadian High Arctic today, visions of frozen tundra, icefields and polar bears probably come to mind. But rewind the clock a little over two million years to before the last ice age, and that Northern tundra was a lush and vibrant forest paradise. It was also home to some surprising animal life, including one large mammal we now associate with scorching deserts: camels.

In Frozen in Time, a documentary from The Nature of Things, paleobiologist Natalia Rybczynski describes how a head injury in 2011 changed the way she had to live. It also gave her time to think about many fossils she and her team at the Canadian Museum of Nature have uncovered of the animals that once roamed the Far North.

A remarkable discovery

The Pliocene Epoch, spanning from 2.5 to 5 million years ago, was the warm period before the last ice age began. The Pliocene was the last time Earth’s atmosphere contained the same concentration of carbon dioxide that we see today: over 400 parts per million.

At the time, temperatures in the High Arctic were also about 22 C higher than today, Rybczynski says in the documentary — a climate much like we see in modern boreal forest in Canada. As a result, the Arctic was covered in birch, larch, pine and even cedar trees, blanketing the landscape all the way to the northern shores of Ellesmere Island and Greenland.

These dense forests were home to many of the animals we now associate with the Pliocene, such as mammoths and mastodons, but also those found in modern boreal habitats: beavers, bears, geese, horses and caribou.

From 2006 to 2009, a research team led by the Canadian Museum of Nature discovered 30 camel fragments on Ellesmere Island in Nunavut. Scientists dated the remains to 3.5 million years, the mid-Pliocene Epoch, a global warm phase when the region was cloaked in boreal forest. Collagen fingerprinting, a cutting-edge science pioneered at the University of Manchester in England, confirmed that the bones belonged to a camelid.

And in 2013, a team of scientists led by Rybczynski announced a remarkable discovery. At the site of an ancient Pliocene river on Ellesmere Island called Fyles Leaf Beds, they uncovered fragments of a leg bone belonging to a 3.5-million-year-old camel. The find made headlines around the world and suggested that modern camels descended from a High Arctic ancestor.

Evolved in the Arctic, perfect for the desert

High Arctic camels were giant versions of modern camels, and they evolved in a forest world unlike any we know today. Because they lived close to the North Pole, the sun would disappear for nearly half the year, before shining down for nearly 24 hours a day during the polar summer.

Many of the features of the camel that help them survive in deserts today may have originated as adaptations to this punishing environment, Rybczynski says in Frozen in Time.

Their hump — a specialized fat deposit — would have helped them through long, cold winters. Camels have excellent night vision, handy when it is dark for almost half the year. And their wide feet that work so well in sand today would have been perfect in snow 3.5 million years ago.

The desert camel, the habits of beavers, bear hibernation, fall colours — all features of the natural world today that may have evolved in the weird Arctic forest world that came to an end with the encroaching glaciers of the last ice age.

“For me, it’s hard to stop imagining all those natural features of our environment, all passed down from a hotter past when forests could grow in the Arctic,” Rybczynski says in the documentary.

“In so many ways, the lost forests of the High Arctic were kind of like a Garden of Eden — the cradle of our boreal forest ecosystem today.”

See Also

No Right to Stable Climate in Our Holocene Epoch


Alimonte Strikes Down Climate Alarms (Again)

Gianluca Alimonti, MS Physics, professor and senior researcher, University of Milan

Chris Morrison reports at Daily Sceptic Retracted by Nature, Traduced by Michael Mann – Gianluca Alimonti is Back and He’s Taking No Prisoners.  Excerpts in italics with my bolds and added images.

I’m calling it the ‘Revenge of Alimonti’. In 2023 a group of activists including ‘hockey stick’ inventor Michael Mann, Attribution Queen Frederike Otto and Marlowe Hood and Graham Readfearn from AFP and the Guardian respectively managed to get a paper led by Professor Gianluca Alimonti retracted by Nature because it had spoken the obvious truth that there was little scientific evidence that extreme weather events were getting worse.

It was the high point of ‘settled’ science, a time when it was acceptable
to trash the cherished free speech principles of the scientific process.

But as the Net Zero fantasy starts to collapse and most of the shonky science backing it is facing increasing ridicule, Alimonti 2 is back, bigger and better. In his latest paper on the non-existent climate ‘crisis’, he shows there has been no statistically worsening trends of climate impacts. Indeed there have been many improvements in humans adapting to whatever nature has thrown at them

The publication of the paper is well timed. It should be pinned on the wall of every climate reporting room in mainstream media, starting with the hopelessly biased BBC. Perhaps not the Guardian though, sadly a lost cause beyond redemption. In considerable but easily understood detail, the paper debunks many of the extreme weather claims that remain the mainstay of grossly misleading climate science reporting.

The new Alimonti blockbuster shows it is not difficult to find all the relevant climate data, while the education needed to understand it relies mainly on an ability to read words and comprehend numbers. This climate paper is not breaking new barriers of scientific understanding, rather it is a work of investigation and compilation from freely available sources, many of them to be found in the published output of the Intergovernmental Panel on Climate Change (IPCC). Most extreme weather events are not getting worse, with or without human involvement, whatever alarmists from the climate comedy turn Jim ‘jail the deniers’ Dale to the BBC say. Inconveniently, the IPCC says more or less the same thing.

There is of course no climate ‘crisis’ or ‘emergency’, or at least not one that is evident from current scientific observations. Compared to recent historical experience, the current climate is relatively benign. Slightly warmer, more carbon dioxide leading to higher biomass and no increase in most types of bad weather. The fear of some sort of ‘crisis’, usually prophesised for an ulterior purpose, is ubiquitous in human history. Hysteria rises and falls dramatically, sometimes over long sustained periods, and in the case of climate this is displayed by an interesting graph compiled by Alimonti.

Google searches for climate ‘crisis’ and ‘emergency’ reveal two recent hysteria peaks, namely at the time of the Al Gore agitprop film An Inconvenient Truth featuring the infamous Michael Mann temperature hockey stick, and the Greta Thunberg and Extinction Rebellion-led lunacy at the turn of the current decade.

Professor Alimonti proposes a data-focused toolkit to cut through the hype around a ‘climate crisis’. Instead of the alarmism, it is suggested that clear trackable metrics such as economic damages and health effects are tied to the key climate trends and events. Analysing these metrics shows no strong worsening trends. Any adaption plans for a changing climate should be based on real evidence, not one-size-fits-all panic.

The Article is Quantifying the climate crisis: a data-driven framework using response indicators for evidence-based adaptation policies.  Synopsis below from excerpts in italics with my bolds and added images.

Defining the Concept of ‘Climate Crisis’ Through Measurable Indicators

The paper proposes an analytical approach to the concept of climate crisis through a set of objective, measurable Response Indicators (RINDs), such as environmental anomalies, socio-economic and health impacts, driven by Climate Impact Drivers (CIDs) defined in IPCC AR6. By shifting the focus from subjective interpretations to a quantifiable metrics, this approach provides a critical framework for assessing the situation in an analytical manner. Policymakers can use these indicators to design targeted interventions that address specific environmental changes, ensuring that actions are data-driven and aligned with scientific evidence. This definition avoids alarmism while promoting practical, evidence-based solutions.

Climate Impact Drivers (CIDs)

Climate Impact Drivers (CIDs) are physical climate system conditions (e.g. means, events, extremes) that affect an element of society or ecosystems and are thus a priority for climate information provision. Depending on system tolerance, CIDs and their changes can be detrimental, beneficial, neutral or a mixture of each across interacting system elements, regions and society sectors. Each sector is affected by multiple CIDs and each CID affects multiple sectors. A CID can be measured by indices to represent related tolerance thresholds. (IPCC-AR6-WG1, Citation2021, p. 1770)

The latest IPCC AR6 process led to the development of 7 CID types (heat and cold, wet and dry, wind, snow and ice, coastal, open ocean, and other) and 33 distinct CID categories (CID, Citation2022): they are summarised in Table 12.12 (IPCC-AR6-WG1, Citation2021, p. 1856) which also presents CID emergence in different time periods based on multiple methods as provided by recent literature.

Table 12.1 | Overview of the main climatic impact-driver (CID) types and related CID categories with a short description and their link to other chapters where the underlying climatic phenomenon and its associated essential climate variables are assessed and described. https://www.ipcc.ch/report/ar6/wg1/chapter/chapter-12/#12.2

As shown in Table 12.12, most of the CIDs do not exhibit significant changes before the end of the XXI century even in the most pessimistic RCP8.5 scenario. It is important to note that the RCP8.5 scenario does not represent a typical ‘business-as-usual’ projection but serves instead as a high-end, high-risk scenario while the RCP4.5 scenario is approximately in line with the upper end of aggregate NDCs (Nationally Determined Contributions) emissions levels (Hausfather & Peters, Citation2020; IPCC-AR6-WG1, Citation2021, p. 250; IPCC-AR6-WG3, Citation2022, p. 317) as also confirmed by a recent JRC report (Keramidas et al., Citation2025): our analysis will thus focus on the observation of CIDs time series and not on future scenarios.

Examples of CIDs

Floods

Hurricanes

Response indicators (RINDs)

The number of natural disasters caused by weather-related events (e.g. hurricanes, floods, droughts, wildfires, wet mass movements, storms) can be used as a preliminary climate response indicator.

The number of recorded Meteo-Hydro-Climate disaster events and related deaths since 2000 is shown in figure 6 and no clear trend is found by the MK trend analysis, as reported in Table 1.

Natural Disaster Deaths

Diseases and Injuries

Disasters from Temperatures, Droughts, Wildfires

Discussion

An analytical approach to the ‘climate crisis’ concept based on CIDs and RINDs has been proposed enhancing the IPCC CID-based framework (CID, Citation2022). This approach is still provisional and reliant on some statistical scientific indicators. The initiative aims to move beyond the qualitative use of the term ‘climate crisis’ by establishing a broad, shared, and quantitative methodology. The final goal is to provide a robust, data-driven assessment through updated time series and standardised statistical analysis, supported by interdisciplinary collaboration.

To this end, we emphasise the importance of:

  • periodic (at least annual) series updates by operational organisations such as FAO, WHO or other international entities that collect and manage time series useful for this purpose;

  • – an alarm criterion based on predefined statistical methodologies (e.g. exceeding specific thresholds, significant trend variations, etc.);

  • multiscale analysis (global, national, regional). All systems on our planet – from the climate system to ecological and socio-economic systems – can be effectively approached from the global scale down to the microscale. While our work has been developed at a global scale with some exceptions, the analysis can be extended to smaller scales (United Nations Statistics Division, Citation2024).

We must emphasise that impact indicator time series often bear
the signature of adaptation, and that other human factors
tend to outweigh climate factors.

For instance, the influence of climate on conflicts is considered minor compared to dominant conflict drivers (IPCC-AR6-WG2, Citation2022, p. 2428; Mach, Citation2019). Similarly, the human footprint on vector-borne diseases may be more significant than climate change, as evidenced in the twentieth century by the decline in malaria endemicity and mortality despite rising global temperatures (Carballar-Lejarazú et al., Citation2023; Climate Adapt, Citation2022; Rossati et al., Citation2016). The reduction in deaths caused by extreme weather events can partly be attributed to improvements in civil protection systems. These examples demonstrate that adaptation often proves more effective than mitigation.

Another example of anthropogenic influence unrelated to climate concerns wildfires: many studies report increases in burned areas linked to a warming climate over recent decades across much of North America. However, the rate of burning sites in the USA in recent decades has been much lower than historical rates across most of the continent, a disparity attributed to aggressive fire suppression and disruption of traditional burning practices (Parks et al., Citation2025). Furthermore, global deforestation trends fit within complex land use patterns where climate plays a secondary role; more specifically, remote sensing data reveal an increase in forest areas at mid-to-high latitudes in the northern hemisphere, while deforestation driven by the expansion of intensive agriculture is observed in subtropical regions (FAO, Citation2022; Pendrill et al., Citation2022; Song et al., Citation2021; Winkler et al., Citation2021).

Most of the time series in Table 1 do not show signs of deterioration. This is important to highlight, as it suggests we still have sufficient time to develop effective and sustainable adaptation policies aimed at enhancing the resilience of socio-economic and environmental systems. For example, in the case of droughts, the use of dry farming techniques, which optimise the exploitation of water resources during periods of scarcity, and the creation of water reservoirs, which can also contribute to renewable energy production and flood mitigation and prevention, can be envisaged. Regarding forest fires, key adaptation measures include the rational management of forest litter, the establishment of firebreaks to prevent the spread of fire, and the maintenance of adequate firefighting services.

Since the observed emergence of most of the CIDs presented in IPCC Table 12.12, and confirmed by the analysed updated time series, as well as most of the RINDs in Table 1 do not exhibit worsening trends, our overall view is that the ‘climate crisis’, as portrayed by many media sources today, is not evident yet.

Nevertheless, it remains extremely important to improve
and standardise monitoring activities and to develop
adaptation strategies based on high-quality data.


Sea Level Rise Hype from Climatists Lying by Omission Again

From Inside Climate News comes this example, New Study Projects Climate-Driven Flooding for Thousands of New Jersey Homes.

Sea-level rise threatens coastal communities even if global emissions drop.

Of course the alarm is picked up everywhere:

As Summer Approaches, New Jersey’s Shore Towns Confront an Unrelenting Foe: Sea Level Rise Inside Climate News

US East Coast faces rising seas as crucial Atlantic current slows, New Scientist

Sea level rise creates a crisis at US coasts: What to know, USA Today

Map Shows US Cities Where Sea Level Rise Is Accelerating, Newsweek

Global sea levels are rising faster and faster. It spells catastrophe for coastal towns and cities, CNN

Etc., Etc., Etc.

Climatists Make Their Case by Omitting Facts

A previous post documented this pattern, of which we have this fresh example.  Let’s start with the tidal gauge at Atlantic City, New Jersey.

It presents a long record of steadily rising levels for more than a century.  The rate is 4.25 mm per year, or a rise of about 1 inch every six years.  The lie is in attributing all of that to sea level rising, and adding in burning of hydrocarbons as the cause.  What’s left out is the well known and documented subsidence of land along the US Eastern seaboard.

Vertical land motion (VLM) across the US Atlantic coast (a) Estimated VLM rate. The circles show the location of GNSS validation observations color-coded with their respective vertical velocities. (b) Histogram comparing GNSS vertical rates with estimated VLM rates. The standard deviation (SD) of the difference between the two datasets is 1.3 mm per year. (c) Land subsidence (representing negative VLM) across the US Atlantic Coast.

The black rectangles indicate the extent of study areas for Chesapeake Bay area and Georgia, South Carolina, and North Carolina (GA-SC-NC) area shown in Fig. 4. State Codes: ME Maine, NH New Hampshire, VT Vermont, MA Massachusetts, RI Rhode Island, NY New York, PA Pennsylvania, NJ New Jersey, WV West Virginia, OH Ohio, DE Delaware, VA Virginia, NC North Carolina, SC South Carolina, GA Georgia, and FL Florida. National, state, and great lakes boundaries in a, c are based on public domain vector data by World DataBank (https://data.worldbank.org/) generated in MATLAB.

Abstract from paper Hidden vulnerability of US Atlantic coast to sea-level rise due to vertical land motion

The vulnerability of coastal environments to sea-level rise varies spatially, particularly due to local land subsidence. However, high-resolution observations and models of coastal subsidence are scarce, hindering an accurate vulnerability assessment. We use satellite data from 2007 to 2020 to create high-resolution map of subsidence rate at mm-level accuracy for different land covers along the ~3,500 km long US Atlantic coast. Here, we show that subsidence rate exceeding 3 mm per year affects most coastal areas, including wetlands, forests, agricultural areas, and developed regions. Coastal marshes represent the dominant land cover type along the US Atlantic coast and are particularly vulnerable to subsidence. We estimate that 58 to 100% of coastal marshes are losing elevation relative to sea level and show that previous studies substantially underestimate marsh vulnerability by not fully accounting for subsidence.

A further reference to causes of land subsidence:

Land subsidence, in particular, deserves special attention because it can significantly magnify the relative sea-level rise (RSLR) to several times beyond the global average sea-level rise, which usually amounts to just a few mm/yr on its own (Shirzaei et al. 2021). Land subsidence results from various factors encompassing both natural processes and human activities that operate at local or regional scales (Ohenhen et al., 2023). Globally, groundwater extraction is the primary cause of land subsidence (Coplin and Galloway, 1999;Shastri et al., 2023).

Finally, we can observe that the Atlantic City sea level rise of 4.25 mm per year measured at the gauge is close to the subsidence rate shown in the right hand panel.  So yes, authorities in that area need to address the problem with hydro engineering and zoning laws.  But no, reducing CO2 emissions is not the solution.

See Also:

Observed vs. Imagined Sea Levels 2023 Update

Who Knew? Western Societies Growing More Equal, Not Less

Daniel Waldenstrom makes the case at Foreign Affairs The Inequality Myth.  Excerpts in italics with my bolds and added images.

Western Societies Are Growing More Equal, Not Less

Spend a few minutes browsing political commentary or scrolling social media and you will discover a seemingly settled truth: inequality in the West is soaring, the middle class is being hollowed out, and democracies stand on the brink of oligarchy. The idea is seductive because it fits everyday anxieties in many Western countries—housing has grown increasingly unaffordable, billionaire wealth mushrooms unfathomably, and the pandemic exposed yawning gaps in social safety nets. Yet the most influential claims about inequality rest on selective readings of history and partial measurements of living standards. When the full balance sheet of modern economies is tallied—including taxes, transfers, pension entitlements, homeownership, and the fact that people move through income brackets across their lives—the story looks markedly different. Western societies are not nearly as unequal as many believe them to be.

Getting the facts right matters because bad diagnosis breeds bad prescriptions. If governments assume that capitalism is inexorably recreating the disparities of the Gilded Age, they will reach for wealth confiscations, price controls, or ever-larger public sectors funded by fragile tax bases. If, instead, the evidence shows that free-market economies have enriched middle classes by expanding asset ownership, that entrepreneurs’ fortunes are associated with advances shared with the broader public, and that much of the post-1980 rise in recorded inequality reflects methodological quirks, then a different agenda follows: states should encourage ambition, protect competition, widen access to wealth-building, and ensure that public services complement—not smother—private prosperity.

In short, before treating inequality as an existential crisis,
it is worth double-checking the thermometer.

Conventional Wisdom Overturned by Evidence

The canonical data tell only part of the story, and the least flattering part at that. A growing body of scholarship reassesses the long-run distribution of wealth by adding what earlier studies neglected. Three findings stand out.

First, private wealth has exploded—but so has broad ownership of it.

Reconstructed national balance sheets for France, Germany, Spain, Sweden, the United Kingdom, and the United States show real per-adult wealth roughly tripling since 1980 and rising more than sevenfold since 1950. Crucially, an increasing share of that capital sits in the homes and pension funds of ordinary households. In 1900, assets held by the elite—agricultural domains and shares in industrial or financial corporations—dominated; today, residential property and funded retirement accounts represent the majority of private assets. That shift parallels mass homeownership: in most Western countries, 60 to 70 percent of households now own the roof over their heads—an equity stake unavailable to their great-grandparents. Most workers hold pension claims in mutual funds or index funds, granting them the high returns of stock markets at low risk—what amounts to financial democratization.

Second, wealth concentration has fallen—not risen—over the past century.

In Europe, the top one percent now owns barely a third of the share it held in 1910, right before the beginning of the transformative era of world wars, democratization, and the growth of governmental capacity, and since the 1970s that share has been essentially flat, even as real wealth—that is, wealth adjusted for inflation—has tripled with rising asset prices. The United States shows a clearer uptick beginning in the 1970s, most visible among the spectacular fortunes of tech and finance titans, whose gains have outpaced even the impressive wealth growth of the middle class. Yet U.S. concentration remains closer to its 1960 level than to its pre-1914 peak.

The dominant quantitative fact of the century, therefore,
is not a new Gilded Age but a dramatic wealth equalization
propelled by mass asset ownership.

Third, the fact that people move through different income brackets over the course of their lives should temper typical measures of inequality.

So, too, should the effects of welfare payments. Annual snapshots lump graduate students with retirees living off savings, making income and wealth gaps appear wider than lifetime consumption gaps. When studies in different countries instead follow individuals over time, they typically find that within only a few years, half the households in the bottom income decile have climbed to higher levels. Many top-decile households can drop to lower rungs of the ladder after business or investment setbacks. Government welfare programs further compress differences. In Sweden, when public pension entitlements are capitalized and added to assessments of personal wealth, this alone cuts the measured wealth inequality—known as the Gini coefficient—by almost half. In the United States, the market’s redistributive role is smaller, but when Social Security, Medicare, and employer-provided health insurance are treated as in-kind income, median households fare far better than raw wage data suggest.

Social Alarmists Out of Touch with Today’s Realities

These facts undermine the image of an inexorably widening chasm between a plutocratic elite and the rest. Yes, superstar entrepreneurs have amassed fortunes measured in tens of billions. But that outcome signals success, not failure: they furnished goods and services that millions freely bought. Their booming companies also supply jobs, higher wage earnings, and substantial tax revenue—directly through profits and payrolls and indirectly by raising the broader tax base. Over the past four decades, life expectancy in advanced economies (including in the United States despite the much-noted increase in “deaths of despair”) rose roughly six years, high school completion became nearly universal, and personal computers once reserved for elites went mainstream.

Those who typically bemoan the rise of inequality
don’t correctly weigh the size and division of the pie.

Rising real incomes and higher asset values are preconditions for mass prosperity and for a well-funded public sector. Even advocates of government intervention should champion efficient growth: every percentage point of GDP adds billions to tax revenue. The West’s most durable path to fairness, then, is to scale up the channels through which ordinary households acquire assets—including affordable housing supply, portable retirement accounts, and low-fee index funds—and to keep markets open so new firms can challenge incumbents.

That perspective should also moderate calls for annual taxes on the stock of net wealth, which have recently been proposed by some politicians and researchers, and have even been discussed officially at G-20 and UN meetings. These so-called wealth taxes are problematic because they hit illiquid assets, forcing entrepreneurs or farmers to borrow or liquidate. Scandinavian experience of such taxes shows that they produce meager revenues, come with high administrative costs, and encourage capital flight. If capital is to be taxed, a more efficient and equitable way is to tax capital income—such as dividends, realized gains, and corporate profits.

Evidence-based Priorities for Policymakers

Misreading inequality courts several risks. It diverts energy from the real challenges to Western economies, which include lax productivity growth, aging populations, and the imperatives of climate adaptation. These problems will strain public budgets. But excessive state-centrism and confiscatory wealth taxes impede capital formation and make financing those tasks harder, not easier. Misunderstanding inequality also breeds regressivity: taxing housing wealth indiscriminately can hit asset-rich but cash-poor retirees; taxing private firms can force sales to multinational giants with cheaper credit. And it corrodes trust: when citizens hear that capitalism benefits only the elite—even as their own living standards rise—they may grow cynical about official statistics and susceptible to populist cures worse than the disease.

A more accurate reading of the data supports a balanced agenda. To be clear, excessive wealth concentration poses risks—most notably to political integrity. Transparent rules for campaign financing and party contributions are essential to minimize the undue influence of money. Core welfare services, such as education and health care, should not become overly dependent on private funding, otherwise they would tie the quality of care to personal wealth—and in the process deepen inequality. The solution is not to curb wealth itself but to safeguard the integrity of political institutions and ensure equitable access to public goods.

States should celebrate entrepreneurial success and foster competition by reducing regulatory burdens—especially those that disproportionately affect smaller and younger firms. Taxation on labor income should be modest enough to incentivize hard work and also allow for the accumulation of new wealth, while capital taxation should target income rather than wealth or inheritances. Public investment should focus on building the capabilities that let households become stakeholders—education, infrastructure, and a rules-based climate that rewards risk-taking. Such an agenda accepts that inequality can coexist with, and even flow from, broad prosperity. Frustration with privilege should be channeled into reforms that expand opportunity rather than cap success.

This agenda advances neither laissez-faire complacency nor egalitarian maximalism. It is an acknowledgment that the West’s most remarkable achievement is not the fortune of a Jeff Bezos or Bernard Arnault but the mundane riches enjoyed by millions whose grandparents lived without antibiotics, central heating, or college degrees. Policymakers would do well to remember that progress before they diagnose calamity—and nurture the conditions that make it possible: secure property rights, open markets, and an efficient public sector powered by the very economic growth its advocates sometimes disparage.

Footnote: The issue of adapting to climate change, raised in the article, perfectly illustrates the dichotomy of social perspectives regarding equality.


Lacking Data, Climate Models Rely on Guesses

A recent question was posed on  Quora: Say there are merely 15 variables involved in predicting global climate change. Assume climatologists have mastered each variable to a near perfect accuracy of 95%. How accurate would a climate model built on this simplified system be?  Keith Minor has a PhD in organic chemistry, PhD in Geology, and PhD in Geology & Paleontology from The University of Texas at Austin.  He responded with the text posted below in italics with my bolds and added images.

I like the answers to this question, and Matthew stole my thunder on the climate models not being statistical models. If we take the question and it’s assumptions at face value, one unsolvable overriding problem, and a limit to developing an accurate climate model that is rarely ever addressed, is the sampling issue. Knowing 15 parameters to 99+% accuracy won’t solve this problem.

The modeling of the atmosphere is a boundary condition problem. No, I’m not talking about frontal boundaries. Thermodynamic systems are boundary condition problems, meaning that the evolution of a thermodynamic system is dependent not only on the conditions at t > 0 (is the system under adiabatic conditions, isothermal conditions, do these conditions change during the process, etc.?), but also on the initial conditions at t = 0 (sec, whatever). Knowing almost nothing about what even a fraction of a fraction of the molecules in the atmosphere are doing at t = 0 or at t > 0 is a huge problem to accurately predicting what the atmosphere will do in the near or far future. [See footnote at end on this issue.]

Edward Lorenz attempted to model the thermodynamic behavior of the atmosphere by using models that took into account twelve variables (instead of fifteen as posed by the questioner), and found (not surprisingly) that there was a large variability in the models. Seemingly inconsequential perturbations would lead to drastically different results, which diverged (euphemism for “got even worse”) the longer out in time the models were run (they still do). This presumably is the origin of Lorenz’s phrase “the butterfly effect”. He probably meant it to be taken more as an instructive hypothetical rather than a literal effect, as it is too often taken today. He was merely illustrating the sensitivity of the system to the values of the parameters, and not equating it to the probability of outcomes, chaos theory, etc., which is how the term has come to be known. This divergence over time is bad for climate models, which try to predict the climate decades from now. Just look at the divergence of hurricane “spaghetti” models, which operate on a multiple-week scale.

The sources of variability include:

♦  the inability of the models to handle water (the most important greenhouse gas in the atmosphere, not CO2) and processes related to it;
♦  e.g., models still can’t handle the formation and non-formation of clouds;
♦  the non-linearity of thermodynamic properties of matter (which seem to be an afterthought, especially in popular discussions regarding the roles that CO2 plays in the atmosphere and biosphere), and
♦  the always-present sampling problem.

While in theory it is possible to know what a statistically significant number of the air and water molecules are doing at any point in time (that would be a lot of atoms and molecules!), a statistically significant sample of air molecules is certainly not being sampled by releasing balloons twice a day from 90 some odd weather stations in the US and territories, plus the data from commercial aircraft, plus all of the weather data from around the World. Doubling this number wouldn’t help, i.e wouldn’t make any difference. Though there are some blind spots, such as northeast Texas that might benefit from having a radar in the area. So you have to weigh the cost of sampling more of the atmosphere versus the 0% increase in forecasting accuracy (within experimental error) that you would get by doing so.

I’ll go out on a limb and say that the NWS (National Weather Service) is actually doing pretty good job in their 5-day forecasts with the current data and technologies that they have (e.g., S-band radar), and the local meteorologists use their years of experience and judgment to refine the forecasts to their viewing areas. The old joke is that a meteorologist’s job is the one job where you can be wrong more than half the time and still keep your job, but everyone knows that they go to work most, if not all, days with one hand tied behind their back, and sometimes two! The forecasts are not that far off on average, and so meteorologists get my unconditional respect.

In spite of these daunting challenges, there are certainly a number of areas in weather forecasting that can be improved by increased sampling, especially on a local scale. For example, for severe weather outbreaks, the CASA project is being implemented using multiple, shorter range radars that can get multiple scan directions on nearby severe-warned cells simultaneously. This resolves the problem caused by the curvature of the Earth as well as other problems associated with detecting storm-scale features tens or hundreds of miles away from the radar. So high winds, hail, and tornadoes are weather events where increasing the local sampling density/rate might help improve both the models and forecasts.

Prof. Wurman at OU has been doing this for decades with his pioneering work with mobile radar (the so-called “DOW’s”). Let’s not leave out the other researchers who have also been doing this for decades. The strategy of collecting data on a storm from multiple directions at short distances, coupled with supercomputer capabilities, has been paying off for a number of years. As a recent example, Prof. Orf at UW Madison, with his simulation of the May 24th, 2011 El Reno, OK tornado (you’ve probably seen it on the Internet), has shed light on some of the “black box” aspects to how tornadoes form. [Video below is Leigh Orf 1.5 min segment for 2018 Blue Waters Symposium plenary session. This segment summarizes, in 90 seconds, some of the team’s accomplishments on the Blue Waters supercomputer over the past five years.]

Prof. Orf’s simulation is just that, and the resolution is around ~10 m (~33 feet), but it illustrates how increased targeted sampling can be effective in at least understanding the complex, thermodynamic processes occurring within a storm. Colleagues have argued that the small improvements in warning times in the last couple of decades are really due more to the heavy spotter presence these days rather than case studies of severe storms. That may be true. However, in test cases of the CASA system, it picked out the subtle boundaries along which the storms fired that did go unnoticed with the current network of radars. So I’m optimistic about increased targeted sampling for use in an early warning system.

These two examples bring up a related problem-too much data! As commented on by a local meteorologist at a TESSA meeting, one of the issues with CASA that will have to be resolved is how to handle/process the tremendous amounts of data that will be generated during a severe weather outbreak. This is different from a research project where you can take your data back to the “lab”. In a real-time system, such as CASA, you need to have the ability to process the volumes of data rapidly so a meteorologist can quickly make a decision and get that life-saving info to the public. This data volume issue may be less of a problem for those using the data to develop climate models.

So back to the Quora question, with regard to a cost-effective (cost-effect is the operational term) climate model or models (say an ensemble model) that would “verify” say 50 years from now, the sampling issue is ever present, and likely cost-prohibitive at the level needed to make the sampling statistically significant. And will the climatologist be around in 50 years to be “hoisted with their own petard” when the climate model is proven to be wrong? The absence of accountability is the other problem with these long-range models into which many put so much faith.

But don’t stop using or trying to develop better climate models. Just be aware of what variables they include, how well they handle the parameters, and what their limitations are. How accurate would a climate model built on this simplified system [edit: of 15 well-defined variables (to 95% confidence level)] be? Not very!

My Comment

As Dr. Minor explains, powerful modern computers can process detailed observation data to simulate and forecast storm activity.  There are more such tools for preparing and adapting to extreme weather events which are normal in our climate system and beyond our control.  He also explains why long-range global climate models presently have major limitations for use by policymakers.

Footnote Regarding Initial Conditions Problem

What About the Double Pendulum?

Trajectories of a double pendulum

comment by tom0mason at alerted me to the science demonstrated by the double compound pendulum, that is, a second pendulum attached to the ball of the first one. It consists entirely of two simple objects functioning as pendulums, only now each is influenced by the behavior of the other.

Lo and behold, you observe that a double pendulum in motion produces chaotic behavior. In a remarkable achievement, complex equations have been developed that can and do predict the positions of the two balls over time, so in fact the movements are not truly chaotic, but with considerable effort can be determined. The equations and descriptions are at Wikipedia Double Pendulum

Long exposure of double pendulum exhibiting chaotic motion (tracked with an LED)

But here is the kicker, as described in tomomason’s comment:

If you arrive to observe the double pendulum at an arbitrary time after the motion has started from an unknown condition (unknown height, initial force, etc) you will be very taxed mathematically to predict where in space the pendulum will move to next, on a second to second basis. Indeed it would take considerable time and many iterative calculations (preferably on a super-computer) to be able to perform this feat. And all this on a very basic system of known elementary mechanics.

Our Chaotic Climate System


Man-Made Climate Change A Good Thing?

Selwyn Duke writes at American Thinker Let’s say man is changing the climate. So what? Excerpts in italics with my bolds and added images.

The temperature is rising!” “The temperature is dropping.” “The temperature is staying the same.”

We argue the “facts” of climate change (even as parts of New Jersey were just buried under 11 inches of global warming). One side wants the facts to show that man is disrupting the climate, while the other wants them to show that he’s not. But an almost never posed question should be asked:

Let’s say, for argument’s sake, that our industry
is causing global warming. So what?

No, I’m not a guy who “just wants to see the world burn” (and that would be literally). Rather, if anthropogenic climate change were occurring, why should we assume it wouldn’t be beneficial?

Greening of the earth from CO2 and warming.

Oh, it’s not just that the Earth is greener and crop yields are higher when CO2 levels are greater; it’s not just that relative warmth breeds life. It’s also this:

Some scientists have said the Earth will soon enter, or has already entered, a significant cooling phase. Others even contend that another ice age is nigh. And if this is so, any man-caused temperature increase would merely mitigate this naturally induced but deadly phenomenon.

One of these scientists was the late Professor S. Fred Singer, an atmospheric and space physics expert who had been a founding director of the Science & Environmental Policy Project. “I have recently become quite concerned about ice ages and the dangers they pose to humans on our planet,” he wrote in 2015 — “and indeed to most of terrestrial ecology.”

Singer explained later in his article that there “are two kinds of ice ages”:

(i) Major (Milankovich-style) glaciations occur on a 100,000-year time-scale and are controlled astronomically. (ii) “Little” ice ages were discovered in ice cores; they have been occurring on an approx. 1000-1500-yr cycle and are likely controlled by the Sun.

The scientist then warned that the “current cycle’s cooling phase may be imminent….”

Now, this is a frightening prospect. Even the liberal New York Times admitted in 2017, reporting on a Lancet study, that “cold weather is responsible, directly or indirectly, for 17 times as many deaths as hot weather.” That’s in our relatively warm time, too. What would happen during a major ice age?

Well, “The coolings are quite severe,” informed Singer. “[T]he most recent one, ending only about 12,000 years ago, covered much of North America and Europe with miles-thick continental ice sheets and led to the disappearance of (barely) surviving bands of Neanderthalers; they were displaced by the more adaptable Homo Sapiens.”

In other words, another major ice age would likely be a Hollywood-like, apocalyptic disaster. In fact, Singer insisted that we should be prepared to use scientific interventions to mitigate such an eventuality (while Bill Gates wants to do the same to cool down the Earth). To be clear, though, while Singer said that another ice age could begin tomorrow, it could also be tens of thousands of years away. And my article isn’t about hashing out the details, assessing probability, or recommending mitigation measures. (you can read Singer’s work for that). It is about this: prejudice.

Again, accepting for argument that man is significantly warming
the planet (not my belief), why assume this is bad?

In reality, moderns’ thinking so often reflects a kind of misanthropism or, at least, a bias against Western-triumph-born modernity. People believing that extraterrestrials furtively visit our planet never assume the aliens’ matter-of-course environmental impact could be malign; they’re too advanced. People pondering a hunter-gatherer tribe (e.g., the North Sentinelese) generally assume they just must live “in harmony with nature” and be innocuous; they’re too primitive. Never mind that American Indians deforested stretches along, and caused the sedimentation of, the Delaware River long before Europeans’ New World arrival (to provide just one perspective-lending example). The activities of man, or modern man or Western man, depending on the precise prejudice, just must be harmful for the simple reason that he engaged in them. So, yes, racial profiling is a problem — against the human race.

In fairness, we can do and have done much to damage the environment. In fairness again, though, forested area in the U.S. is greater than it was a century back and our water and air are cleaner than they were 60 years ago. And in recent times the Great Barrier Reef has actually increased in size (this isn’t necessarily due to man’s activities). So we can also be good shepherds of the Earth.

The odd thing, though, about the misanthropic prejudice is that implicit in it is an idea that man is akin to some unnatural, artificial presence. This, coming from people who generally also believe man is himself only an animal, a mere product of evolution; in other words, just another part of nature. And, of course, whether the result of divine creation or evolutionary happenstance, part of nature (or Creation) is precisely what man is.

As for the world’s fortunes, 99.9 percent of the species of life that have ever existed are extinct, partially due to ice ages. So ironically, if man’s activities — either accidentally, intentionally or both — mitigate the coming ice age, we humans may be responsible for counteracting the next great extinction.

Source: Phanerozoic_Biodiversity.png Author: SVG version by Albert Mestre

Alarmists Attack IPCC Not Linking Disasters to CO2


Chris Morrison reports on the flap over Climate Crisis™ media tactics in his Daily Sceptic article Climate Activists Frustrated by IPCC’s Refusal to Link Extreme Weather With Carbon Emissions.  Excerpts in italics with my bolds and added images.

Last June, the state-reliant BBC reported that human-caused climate change had made U.S. and Mexico heatwaves “35 times more likely”. Nothing out of the ordinary here in mainstream media with everyone from climate comedy turn ‘Jim’ Dale to UN chief Antonio ‘Boiling’ Guterres making these types of bizarre attributions. But for those who closely follow climate science and the assessments of the Intergovernmental Panel on Climate Change (IPCC), “such headlines can be difficult to make sense of”, observes the distinguished science writer Roger Pielke. In a hard-hitting attack on the pseudo-scientific industry of weather attribution, he states:

“neither the IPCC nor the underlying scientific literature comes anywhere close to making such strong and“ certain claims of attribution”.

Pielke argues that the extreme position of attributing individual bad weather events is “roughly aligned” with the far Left. “Climate science is not, or at least should not serve as a proxy for political tribes,” he cautions. But of course it is. The Net Zero fantasy is a collectivist national and supra-national agenda that increasingly relies on demonising bad weather. With global temperatures rising at most only 0.1°C a decade, laughter can only be general and side-splitting when IPCC boss Jim Skea claims that British summers will be 6°C hotter in less than 50 years. Two extended temperature pauses since 2000 have not helped the cause of global boiling. In addition there are increasing doubts about the reliability of temperature recordings by many meteorological organisations that seem unable to properly account for massive urban heat corruptions.

The big problem for ‘far Left’ climate extremists is that event attribution is a form, in Pielke’s words, of “tactical science”. Such science serves legal and political ends and is not always subject to peer review. As the BBC and other media outlets can attest, the work is “generally promoted via press release”. It has been developed in response to the failure of the IPCC to detect and attribute most types of extreme weather including drought, flooding, storms and wildfires to human involvement, notes Pielke. Worse, the IPCC can find little sign of human involvement going forward to 2100.

Scientists cannot answer directly whether particular events are
caused by climate change since extremes occur naturally.

Meanwhile the IPCC is somewhat dismissive about weather attribution, or as Pielke terms it, “weather attribution alchemy”. It notes: “The usefulness or applicability of available extreme event attribution methods for assessing climate-related risks remains subject to debate.” The IPCC is a biased body full of climate alarmists, but its inability to attribute single events to humans is obviously highly irritating and somewhat inconvenient for activists and their media counterparts.

Dr. Friederike Otto speaking with reporter at Oxford.

Dr. Friederike Otto runs World Weather Attribution (WWA) out of Imperial College London and is a frequent presence on the BBC. WWA is behind many of the immediate attributions of bad weather to human causes and its motives are clear. As Dr. Otto has noted: “Unlike every other branch of climate science or science in general, event attribution was actually originally suggested with the courts in mind.” Otto is clear that the main function of such studies, part-funded by Net Zero-supporting billionaires and heavily pushed by aligned mainstream media, is to support lawsuits against fossil fuel companies. She explains this strategy in detail in the interview, ‘From Extreme Event Attribution to Climate Litigation‘.

The inability of the IPCC to attribute bad weather to humans has been viewed by climate advocates as “politically problematic”, continues Pielke. He notes the work of climate activists Elizabeth Lloyd and Naomi Oreskes who are worried that the lack of attribution “conveys the impression that we just do not know, which feeds into uncertainty, doubt or incompleteness, and the general tendency of humans to discount threats that are not imminent”.

Perish the thought that there should be uncertainty, doubt
or incompleteness in the settled world of climate science.

It is of course different from all other branches of science in that all its opinions are right and consequently there is no need for the unhelpful process of constant inquiry and experiment. It need hardly be added that no doubt exists at the BBC, where former Radio 4 Today Editor Sarah Sands wrote the foreword to a WWA guide for journalists. Recalling when the late Nigel Lawson suggested there had been no increase in extreme weather, Sands noted: “I wish we had this guide for journalists to help us mount a more effective challenge to his claim.” These days, Sands enthused, attribution studies have given us “significant insight into the horsemen of the climate apocalypse”.

For her part, Otto is keen to crack down on the heretics. She was at the forefront of the recent notorious retraction of a paper in a Springer Nature journal that stated there was no evidence that the climate was breaking down. Written by four Italian scientists and led by Professor Gianluca Alimonti, they argued that a climate emergency was not supported by the data. Otto, who had previously worked in the Oxford School of Geography for 10 years, claimed the scientists were not writing in good faith. “If the journal cares about science they should withdraw it loudly and publicly saying it should never have been published,” she demanded.

A recent scientific study has confirmed that natural and climate-related disasters are declining during the 21st century. Getty Images/iStcokphoto

Declining Weather Disasters Prove Doomsters Wrong (Alimonti et al.)

Benny Peiser makes the case in his NY Post article Despite climate-change hysterics, weather disasters have decreased.  Excerpts in italics with my bolds and added images.

A recent scientific study has confirmed what climate realists have been highlighting for some time: Natural and climate-related disasters have been declining rather than increasing during the 21st century.

In a paper published this year in one of the world’s leading journals on environmental hazards, Italian scientists Gianluca Alimonti and Luigi Mariani analyzed the number and temporal trends of natural disasters reported since 1900.

A 2015 study by 22 scientists from around the world found that cold kills over 17 times more people than heat. Thus the planet’s recent modest warming has been saving millions of lives.

Based on the best available data, the two scientists concluded the 21st century has seen “a decreasing trend [of natural disasters] to 2022” which is “characterized by a significant decline in number of events.”

The researchers emphasized that their conclusion “sits in marked contradiction to earlier analyses by UN bodies which predict an increasing number of natural disasters and impacts in concert with global warming.”

“Our analyses strongly refute this assertion,” they wrote.

For years, international agencies such as the UN Office for Disaster Risk Reduction, the Food and Agriculture Organization of the United Nations, the World Meteorological Organization and the International Red Cross have claimed that climate-related disasters are escalating.

Floods lead a near doubling of disaster events from 1980 to 1999 compared to 2000 to 2019, according to a report by the UN Office for Disaster Risk Reduction.

“Weather disasters are striking the world four to five times more often and causing seven times more damage than in the 1970s,” the WMO reported in 2021.

Disaster and weather officials affiliated with the UN claim this dramatic rise is due to global warming: The changing climate, they say, is making weather disasters stronger and more frequent.

Fourth National Climate Assessment, Volume II: Impacts, Risks, and Adaptation in the United States.

The increased frequency of heat waves, droughts, flooding, winter storms, hurricanes, wildfires and other extreme weather events prove the negative impact of a warming world, according to various UN agencies and nongovernmental organizations.

Yet, as the actual data used by these organizations reveals, the last 20 years have in fact seen a significant decline in such events.

It turns out that climate alarmists have based their claims on a highly misleading comparison of disaster data of the late 20th and the early 21st centuries.

By their tally, the period from 1980 to 2000 saw about 4,200 natural disasters —with the number increasing sharply, to more than 8,000, during the first 20 years of this century.

This conclusion, however, is fatally flawed: It fails to take into account the huge increase in the global reporting of disasters engendered by the invention and rapid global dissemination of new communication technologies since the 1980s.

The arrival of the internet and other new communication tools has undoubtedly accelerated the reporting of disasters from all corners of the world — events that were significantly underreported in earlier decades.

As well, the number of people killed by natural and climate-related disasters has fallen steadily over the past 120 years — from 500,000 deaths per decade in the early 20th century down to less than 50,000 per decade in the last ten years.

And, contrary to claims by NGOs and government officials, climate-related disaster losses have also declined as a percentage of global GDP during the last 30 years — from about 0.25% of GDP in 1990 to less than 0.20% in 2023.

The study by Alimonti and Mariani vindicates what we at the Global Warming Policy Foundation have been pointing out for a long time: Climate-related disasters are not on the rise, despite warming temperatures.

International agencies and the news media have hyped climate disasters for far too long, while ignoring the factual downward trend.

”First they ignore you, then they laugh at you, then they fight you, then you win,” as the saying goes.  UN agencies and NGOs have been misleading the public for years. It’s past time for the truth to win out.

Benny Peiser is the director of the London-based Global Warming Policy Foundation.

See also

Our Weather Extremes Are Customary in History

Figure27: Annual count of EF3 and above tornadoes in the US, 1950–2021. Source: Source: NOAA/NCEI.106, 107


Put Climate Insanity Behind Us

Conrad Black writes at National Post Time for the climate insanity to stop.  Excerpts in italics with my bolds and added images.

We have been racing to destroy our standard of living
to avert a crisis that never materialized

We must by now be getting reasonably close the point where there is a consensus for re-examining the issue of climate change and related subjects. For decades, those of us who had our doubts were effectively shut down by the endless deafening repetition, as if from the massed choir of an operatic catechism school, of the alleged truism: “98 per cent of scientists agree …” (that the world is coming to an end in a few years if we don’t abolish the combustion engine). Decades have gone by in which the polar bears were supposed to become extinct because of the vanishing polar ice cap, the glaciers were supposed to have melted in the rising heat and the impact of melting ice would raise ocean levels to the point that Pacific islands, such as former U.S. vice-president Al Gore’s oratorical dreamworld, the Pacific island state of Tuvalu, would only be accessible to snorkelers. There has been no progress toward any of this. Ocean levels have not risen appreciably, nothing has been submerged and the polar bear population has risen substantially.

A large part of the problem has been the fanaticism of the alarmist forces. This has not been one of those issues where people may equably disagree. There was a spontaneous campaign to denigrate those of us who were opposed to taking drastic and extremely expensive economic steps to reduce carbon emissions on the basis of existing evidence: we could not be tolerated as potentially sensible doubters; we were labelled “deniers,” a reference to Holocaust-deniers who would sweep evidence of horrible atrocities under the rug. For our own corrupt or perverse motives, we were promoting the destruction of the world and unimaginable human misery. There has been climate hysteria like other panics in history, such as those recounted in Charles MacKay’s “Extraordinary Popular Delusions and the Madness of Crowds,” particularly the 1630’s tulip mania, in which a single tulip bulb briefly sold for the current equivalent of $25,000.

In western Europe, and particularly in the United States, where the full panic of climate change prevailed, the agrarian and working echelons of society have rebelled against the onerous financial penalties of the war on carbon emissions. There have been movements in some countries to suppress the population of cows because of the impact of their flatulence on the composition of the atmosphere. This has created an alliance of convenience between the environmental extremists and the dietary authoritarians as they take dead aim at the joint targets of carbon emissions and obesity. Germany, which should be the most powerful and exemplary of Europe’s nations, has blundered headlong into the climate crisis by conceding political power to militant Greens. It has shut down its advanced and completely safe nuclear power program, the ultimate efficient fuel, and has flirted with abolishing leisure automobile drives on the weekends.

Claims that tropical storms have become more frequent are rebutted by meticulously recorded statistics. Claims that forest fires are more frequent and extensive have also been shown not to be true. My own analysis, which is based on observations and makes no pretense to scientific research, as I have had occasion to express here before, is that the honourable, if often tiresome, conservation movement, the zealots of Greenpeace and the Sierra Club, were suddenly displaced as organizers and leaders of the environmental movement by the international left, which was routed in the Cold War. Their western sympathizers demonstrated a genius for improvisation that none of us who knew them in the Cold War would have imagined that they possessed, and they took over the environmental bandwagon and converted it into a battering ram against capitalism in the name of saving the planet.

Everyone dislikes pollution and wants the cleanest air and water possible. All conscientious people want the cleanest environment that’s economically feasible. We should also aspire to the highest attainable level of accurate information before we embark on, or go any further with, drastic and hideously expensive methods of replacing fossil fuels. Large-scale disruptions to our ways of life at immense cost to consumers and taxpayers, mainly borne by those who can least easily afford it, are a mistake. We can all excuse zeal in a sincerely embraced cause, but it is time to de-escalate this discussion from its long intemperate nature of hurling thunderbolts back and forth, and instead focus on serious research that will furnish a genuine consensus. I think this was essentially what former prime minister Stephen Harper and former environment minister John Baird were advocating in what they called a ”Canadian solution” to the climate question. Since then, our policy has been fabricated by fanatics, including the prime minister, who do not wish to be confused by the facts. The inconvenient truth is now the truth that inconveniences them.

Western Europe has effectively abandoned its net-zero carbon emission goals; the world is not deteriorating remotely as quickly as Al Gore, King Charles, Tony Blair and the Liberal Party of Canada predicted. Some of the largest polluters — China, India and Russia — do not seem to care about any of this. Canada should lead the world toward a rational consensus with intensified research aiming at finding an appropriate response to the challenge. What we have had is faddishness and public frenzy. Historians will wonder why the West made war on its own standard of living in pursuit of a wild fantasy, and no immediate chance of accomplishing anything useful. We have been cheered on by the under-developed world because they seek reparations from the advanced countries, although some of them are among the worst climate offenders. It is insane. Canada should help lead the patient back to sanity.

Postscript:

So to be more constructive, let’s consider what should be proposed by political leaders regarding climate, energy and the environment.  IMO these should be the pillars:

♦  Climate change is real, but not an emergency.

♦  We must use our time to adapt to future climate extremes.

♦  We must transition to a diversified energy platform.

♦  We must safeguard our air and water from industrial pollutants.

A Rational Climate Policy

This is your brain on climate alarm. Just say N0!

Declining Weather Disasters Prove Doomsters Wrong

A recent scientific study has confirmed that natural and climate-related disasters are declining during the 21st century. Getty Images/iStcokphoto

Benny Peiser makes the case in his NY Post article Despite climate-change hysterics, weather disasters have decreased.  Excerpts in italics with my bolds and added images.

A recent scientific study has confirmed what climate realists have been highlighting for some time: Natural and climate-related disasters have been declining rather than increasing during the 21st century.

In a paper published this year in one of the world’s leading journals on environmental hazards, Italian scientists Gianluca Alimonti and Luigi Mariani analyzed the number and temporal trends of natural disasters reported since 1900.

A 2015 study by 22 scientists from around the world found that cold kills over 17 times more people than heat. Thus the planet’s recent modest warming has been saving millions of lives.

Based on the best available data, the two scientists concluded the 21st century has seen “a decreasing trend [of natural disasters] to 2022” which is “characterized by a significant decline in number of events.”

The researchers emphasized that their conclusion “sits in marked contradiction to earlier analyses by UN bodies which predict an increasing number of natural disasters and impacts in concert with global warming.”

“Our analyses strongly refute this assertion,” they wrote.

For years, international agencies such as the UN Office for Disaster Risk Reduction, the Food and Agriculture Organization of the United Nations, the World Meteorological Organization and the International Red Cross have claimed that climate-related disasters are escalating.

Floods lead a near doubling of disaster events from 1980 to 1999 compared to 2000 to 2019, according to a report by the UN Office for Disaster Risk Reduction.

“Weather disasters are striking the world four to five times more often and causing seven times more damage than in the 1970s,” the WMO reported in 2021.

Disaster and weather officials affiliated with the UN claim this dramatic rise is due to global warming: The changing climate, they say, is making weather disasters stronger and more frequent.

Fourth National Climate Assessment, Volume II: Impacts, Risks, and Adaptation in the United States.

The increased frequency of heat waves, droughts, flooding, winter storms, hurricanes, wildfires and other extreme weather events prove the negative impact of a warming world, according to various UN agencies and nongovernmental organizations.

Yet, as the actual data used by these organizations reveals, the last 20 years have in fact seen a significant decline in such events.

It turns out that climate alarmists have based their claims on a highly misleading comparison of disaster data of the late 20th and the early 21st centuries.

By their tally, the period from 1980 to 2000 saw about 4,200 natural disasters —with the number increasing sharply, to more than 8,000, during the first 20 years of this century.

This conclusion, however, is fatally flawed: It fails to take into account the huge increase in the global reporting of disasters engendered by the invention and rapid global dissemination of new communication technologies since the 1980s.

The arrival of the internet and other new communication tools has undoubtedly accelerated the reporting of disasters from all corners of the world — events that were significantly underreported in earlier decades.

As well, the number of people killed by natural and climate-related disasters has fallen steadily over the past 120 years — from 500,000 deaths per decade in the early 20th century down to less than 50,000 per decade in the last ten years.

And, contrary to claims by NGOs and government officials, climate-related disaster losses have also declined as a percentage of global GDP during the last 30 years — from about 0.25% of GDP in 1990 to less than 0.20% in 2023.

The study by Alimonti and Mariani vindicates what we at the Global Warming Policy Foundation have been pointing out for a long time: Climate-related disasters are not on the rise, despite warming temperatures.

International agencies and the news media have hyped climate disasters for far too long, while ignoring the factual downward trend.

”First they ignore you, then they laugh at you, then they fight you, then you win,” as the saying goes.  UN agencies and NGOs have been misleading the public for years. It’s past time for the truth to win out.

Benny Peiser is the director of the London-based Global Warming Policy Foundation.

See also

Our Weather Extremes Are Customary in History

Figure27: Annual count of EF3 and above tornadoes in the US, 1950–2021. Source: Source: NOAA/NCEI.106, 107


UN’s Guterres: Head in Oven, Feet in Freezer

The image is based on a criticism of statisticians:  “If my head is in the oven and my feet are in the freezer, my temperature may be on average normal.”  UN Chief Guterres presumes to speak for the planet when he claims we are experiencing “Global Boiling.”  Apparently, his feet are too numb to register any of the many cold temperatures in places around the world, so he is a victim fearing a runaway average warming.  Let’s inform him and others similarly misled about the facts on the ground they are missing.

Australia

Why Is It So Cold Right Now? A Weather Expert Explains

Temperatures plummeted across southeast Australia this week, with Weatherzone reporting Canberra’s low of -7.2ºC was “its lowest temperature since 2018 and the lowest for June since 1986.”

Sydney experienced its coldest June morning today since 2010, with a temperature of 5.2ºC. In Victoria, temperatures of -7.2ºC were recorded.

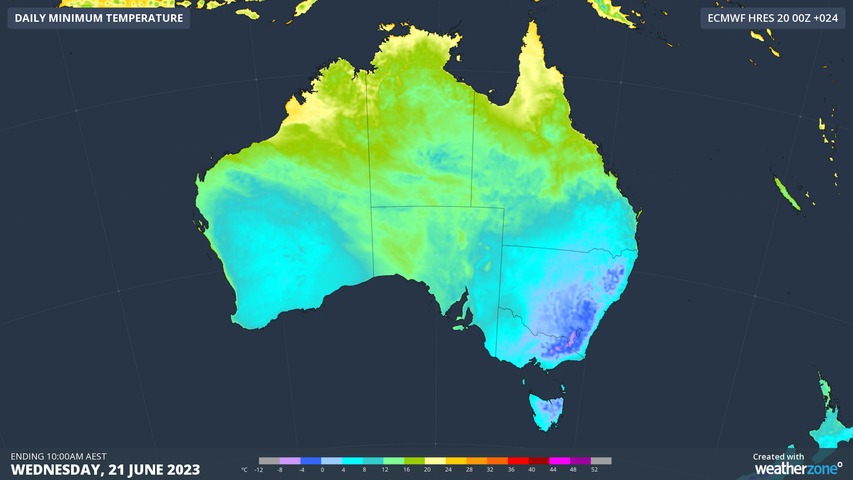
Australia just had one of its coolest and wettest summers of the last decade. 

Snow settled on the Stirling Range in WA on Thursday morning after a frigid polar air mass travelled from Antarctica to Australia.

A long fetch of southerly winds has been blowing across the Southern Ocean during the past week, carrying polar air from the ice sheets of Antarctica into unusually low latitudes.

On Thursday morning, this Antarctic air mass reached the Stirling Range in WA and caused snow to settle on Bluff Knoll.

United Kingdom

Met Office explains why the weather is so miserable this May

‘High-pressure systems have been generally located over southern continental Europe and also to the far east of Europe’, they told Metro.co.uk.

The spokesperson continued: ‘As these high-pressure systems interacted through the season, the UK is positioned between them, leading to periods of cool, cloudy, and wet conditions for the UK.  ‘These have generally either swept in from the Atlantic or slipped between the high-pressure systems to reach the UK.

‘Warmer-than-average sea temperatures also provided the necessary fuel for clouds to develop, which has been quite persistent in spring.’

Met Office meteorologist Clare Nasir said: ‘Showers over the next few days could be heavy with the risk of thunder and hail.’   She added that the risk of thunder and hail persist through Wednesday and Thursday.

Where has the UK summer gone

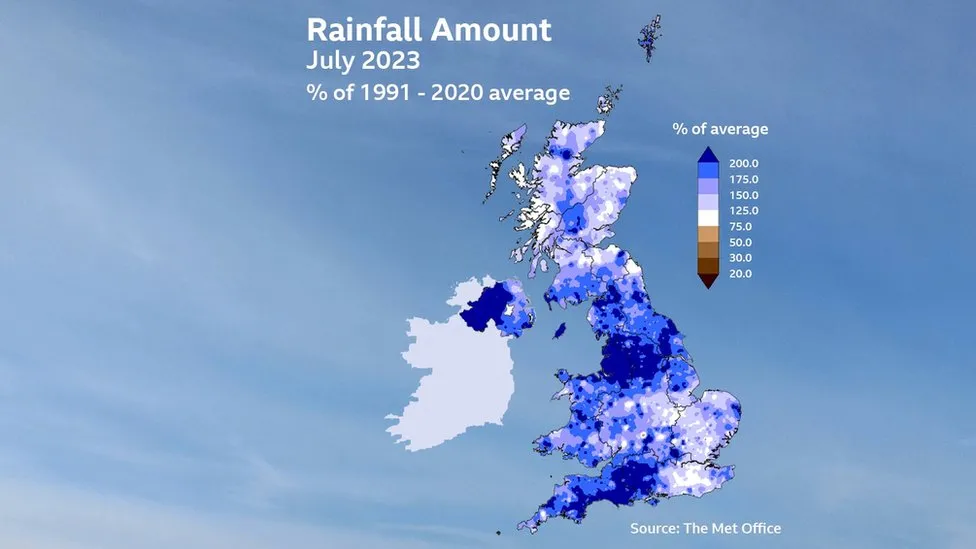
Summer 2023 so far has been one of contrasts – after the warmest June on record we had an exceptionally wet July.  Northern Ireland and much of north-west England had their wettest July on record. Looking ahead there is no immediate end to the distinctly un-summery conditions. So what is going on?

Any spring warmth was hard to come by. After a cool April, very warm weather was distinctly lacking in May. Nowhere reached 24°C until the month was nearly over, on the 27th.

However, that theme changed dramatically in June. Temperatures soared to 32.2°C, with a heatwave being declared in many places and becoming the warmest June on record which, according to the Met Office, bears the “fingerprint of climate change”.

It was all change again in early July with low pressure setting in, and staying put. While much of Europe sweltered in a blistering heatwave the UK sat under cool, wet weather which looks set to stay for the first part of August too.

India

Is January 2023 going to be the coldest year in the 21st century?

There may be no relief from the ongoing spell of cold wave with minimum temperatures hovering below normal limits at most places, reports suggested. If a weather expert is believed, it has been predicted that temperatures in the plains are going to dip as far as -4 degrees Celsius next week.

Large parts of north India are still reeling under numbing cold with the mercury remaining below freezing point at most places in Jammu and Kashmir, while dense fog in the early hours of the morning hit road and rail traffic movement. Cold wave conditions abated in Delhi due to a fresh western disturbance affecting northwest India, even as a dense layer of fog lowered visibility to just 50 metres.

Northern India braces for coldest weather in years as dense fog, poor air quality linger

A new wave of cold weather is headed into northern India and could drop temperatures to levels not seen there in over three years, according to AccuWeather forecasters.

The cold weather shot will be the latest, and perhaps most significant, of many recent waves of chilly weather that have also led to travel-disrupting dense fog and poor air quality over parts of the Indian subcontinent since late December.

The temperature in New Delhi, the capital city of India and home to more than 18 million people, has the potential to drop as low as 2 degrees Celsius (35 degrees Fahrenheit) on Sunday night and Monday morning. While the record low for this coming Monday of 1.3 degrees Celsius below zero (29.7 degrees Fahrenheit) appears safe, it will be well below the average low of 6 degrees Celsius (42 degrees Fahrenheit) for the date.

Temperatures at this level would be the coldest readings in New Delhi since December 2019,” said Nicholls.

Ahead of the cold wave, the IMD has issued a cold wave warning for Sunday and Monday for the northern Indian states of Punjab, Haryana, Chandigarh, Delhi and Rajasthan. The warning was issued to give residents advance notice of a level of cold that could adversely impact human health and property.

Canada

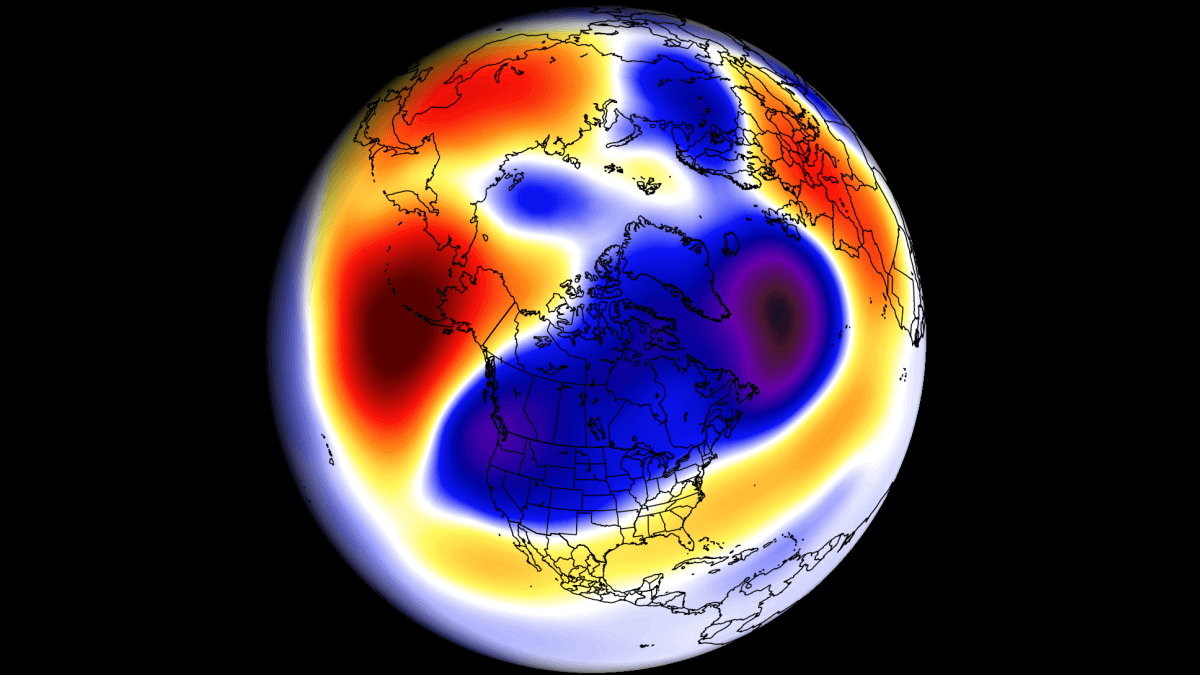
Spring forecast 2023: The La Nina Winter pattern is forecast to extend as we head into Spring despite the breakdown of the cold ocean anomalies

Spring season 2023 is nearing, with forecasts revealing the jet stream pattern over the North Pacific and the Atlantic to be influenced by the diminishing La Nina. A high-pressure system in the Pacific will define the weather patterns over North America, with a potential Stratospheric warming event playing a role early in the season.

The cold ocean phase in the equatorial Pacific is already in breakdown mode. It is expected to decline rapidly towards early Spring.

But, despite the breakdown of these cold ocean anomalies (La Nina), its influence can still persist in global weather circulation. Long-range weather calculations also see this, extending the La Nina jet stream pattern from Winter into Spring 2023.

Spring sits on the sidelines with Winter’s wild ride to the finish line

USA

Winter Forecast 2024: The Brrr Is Back
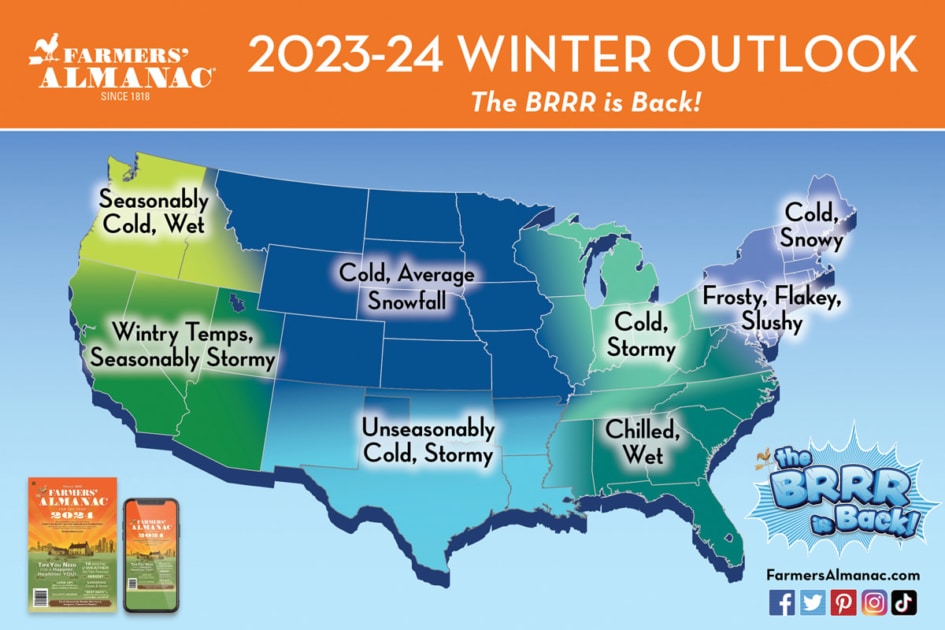
The Brrr is Back!
“After a weird and warm winter season last year, this winter should make cold weather fans rejoice—especially those in the Great Lakes, Midwest, and northern New England areas,” shares editor Pete Geiger, adding “the ‘brrr’ is coming back! We expect more snow and low temperatures nationwide.”

East Coast Snow?
Folks living along the I-95 corridor from Washington to Boston, who saw a lack of wintry precipitation last winter, should experience quite the opposite, with lots of rain/sleet and snowstorms to contend with.

Texans Beware!
According to Farmers’ Almanac 2024, Texans should prepare for an unseasonably cold and stormy winter season ahead

Frosts in Florida?
Winter will be wet in the Southeast region however a few frosts are forecast to bring the “brrrs” to Floridians and its snowbirds.

Asia

As Asian countries hit by extreme cold snap, here’s what life is like at -53C

An intense cold spell is gripping east Asia, with temperatures plunging and hazardous conditions reported across China, the Koreas and Japan.

On Monday one of China’s northern-most cities broke its lowest ever recorded temperature, with the mercury hitting -53C at 7am on the first day of the Lunar New Year in Mohe, Heilongjiang province.

Japan and the Korean peninsula have also issued warnings over freezing temperatures and gales that have killed at least one person, while at least 57 people have been reported dead in Afghanistan as the wintry conditions stretch across into central Asia.

Europe

Record-Challenging Cold Sweeps Europe

It’s been cold — ask a European, ask me…

We’ve enjoyed a ‘comfortably cool’ July here in Central Portugal (thus far), it’s been great. Same with my old haunt, the UK. July 2023 there is on course to be colder-than-average–and vs the historically cool 1961-1990 era that the Met Office still insist on using, no less.

Looking ahead, and particularly at central/eastern nations, those summer chills are about to take another step down.

As per the latest GFS run (shown below), ‘pinks’ and ‘purples’ are forecast to engulf the likes of Poland, Slovakia, Hungary, Croatia, Serbia, Albania, Belarus, Ukraine and Romania this week, sending temperatures crashing by as much as 18C below the seasonal norm.

Record summer lows are expected, an unbiased media would report on them (not holding my breath).

Russia

Extreme cold grips Siberia, as temperatures fall to lowest levels since 2002

The coldest air on Earth plunged into Siberia this week, dropping temperatures to as low as 80 degrees Fahrenheit below zero. An expansion of that cold is expected across eastern Asia into early next week and eventually North America, according to AccuWeather forecasters.

The bitter cold not only allowed temperature benchmarks that have not been hit in decades in some parts of Russia, but the extreme weather also created an icy spectacle as firefighters battled a fire in subzero temperatures on Jan. 8 in Ufa, Russia. Massive icicles clung to the home amid the anomalous cold.

The same Arctic blast dropped temperatures in Moscow to their lowest levels in years this past weekend, while even parts of northern India will get a taste of the cold beginning later this weekend.

Antarctica

Antarctica Plunges to -83.2C (-117.8F)–Earth’s Lowest Temperature Since 2017

While the media tricks the dumb and the gullible into believing the world is on fire –with poverty-inducing CO2 reductions their only savior– Antarctica is shivering through an extreme bout of cold, even by South Pole standards.

The Italian-French research station ‘Concordia’ posted a reading of -83.2C (-117.8F) on July 25. This ranks as the fifth coldest daily value in the operational life of the station, bested only by Aug 2010’s -84.7C; July 2010’s -84.6C; and June 2017’s -83.9C and -83.5C.

As discussed recently, Antarctic sea ice’s tough time of it in 2023 isn’t related to temperature, that correlation simply doesn’t exist. The Antarctic continent continues to cool, the data are very clear on that, yet ice is taking a proverbial beating this season.

South America

Fierce frosts have gripped areas of Argentina and Chile

Some of that aforementioned Antarctic cold has been spun northward over Southern Hemisphere land masses.

Fierce frosts have gripped areas of Argentina and Chile of late, as South America’s topsy–turvy ‘meridional jet stream‘-fueled winter drags on. Looking ahead, more of the same is on the cards, too, as we head into August:

Southern Africa

Southern Africa Freezes, Rare Snowfall Hits Johannesburg

Southern Africa is enduring fierce freeze this week as a blast of polar air engulfs the likes of SA, Namibia, Botswana, Zimbabwe, Mozambique, as well as Angola, Zambia and Malawi.

Coastal regions are struggling to climb above 10C (50F), while at higher-elevations and inland, frosts are proving widespread, with reports of rare snowfall coming out of some unusual spots such as Zimbabwe and South Africa, such as Johannesburg.

Several regions of South Africa are enduring a harsh winter this year, according to local media outlets, with this past weekend delivering an intensification. Sub-zero (C) lows struck Johannesburg and surrounding areas over the past few mornings, with daytime highs of just 4C (39.2F) noted–where the July average is closer to 17C (62.6F).

Temperatures also held low enough to keep the snow lying on the ground throughout the morning, bringing joyous scenes to many a school playground — this would have been the first time many children have seen snow (Prof David Viner take note).

Footnote:  Climate is Dynamic: Hot Today, Cold Tomorrow

And the same goes for precipitation: