Peter Smith explains in his Quadrant article Shunned by Sanctitudinous Science. Excerpts in italics with my bolds and added images. Synopsis of Ivan Kennedy paper follows later.
When coffeeing with a group of conservative friends as I do on Fridays, one of our number, Professor Emeritus Ivan Kennedy, said something to the effect that there were no scientific alternative theories to the IPCC’s explanation of global warming except for his.
I was taken aback. Surely, even within my limited knowledge, William Happer (Princeton) and Richard Lindzen (MIT) hypothesise that the effect of CO2 on warming progressively declines. Nobel Prize winner Dr John Clauser hypothesises that reflective cumulus clouds created by water vapour, engendered by modest warming, act as a thermostat to keep global temperatures down. You can read about it here if you wish. So what is going on?
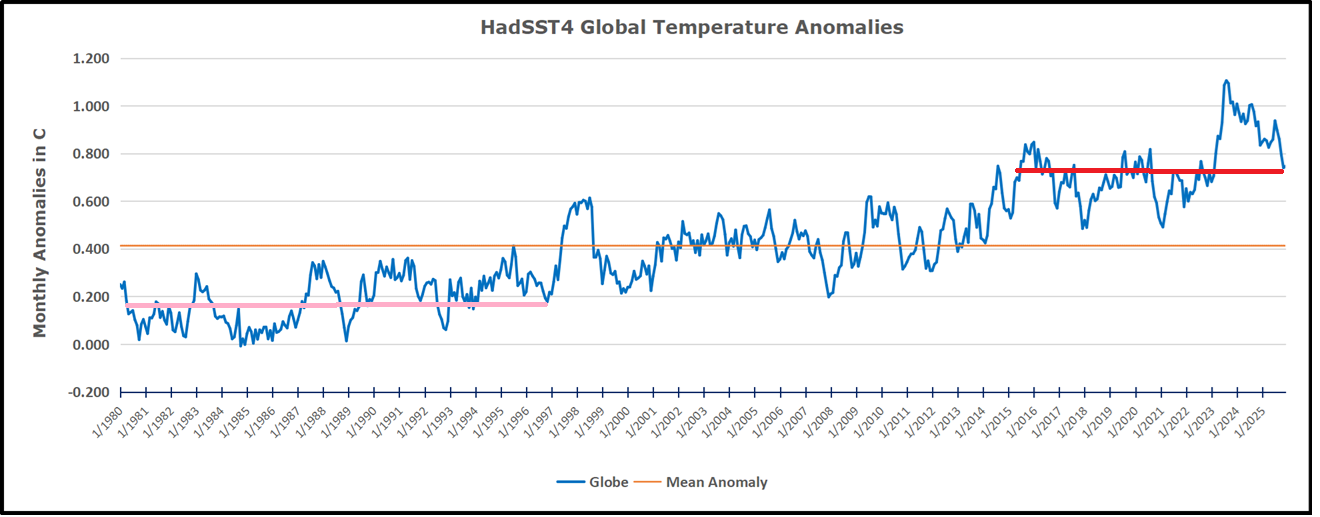
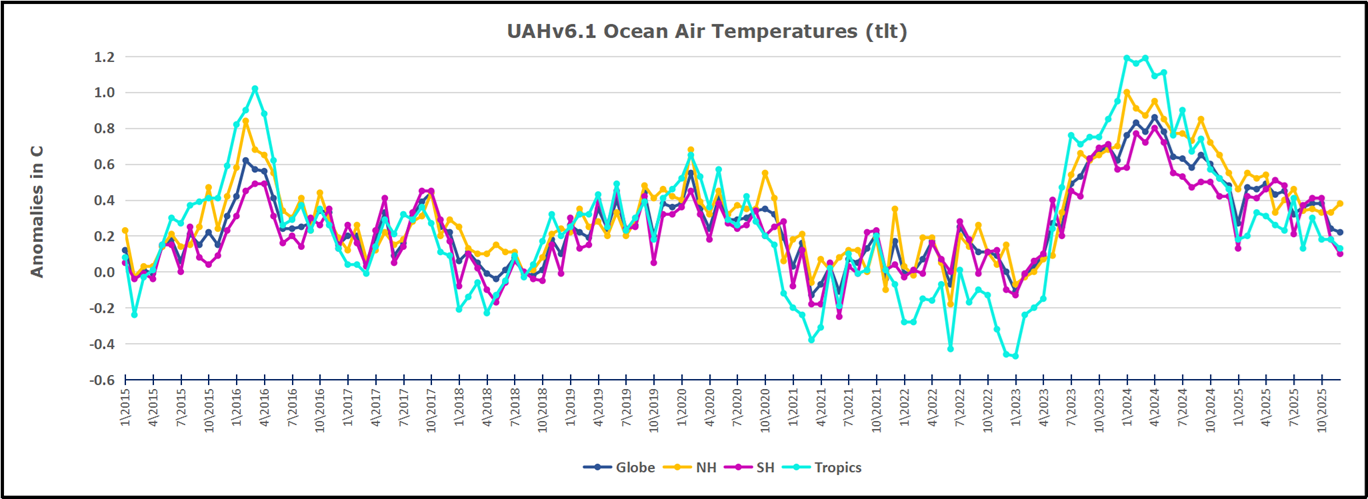
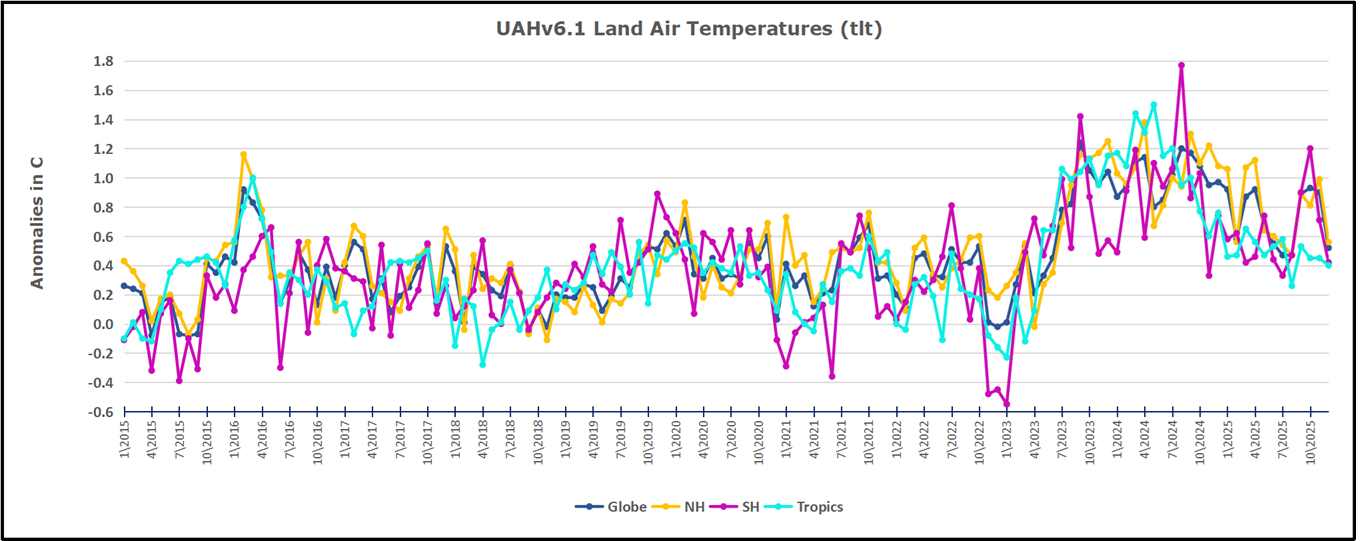
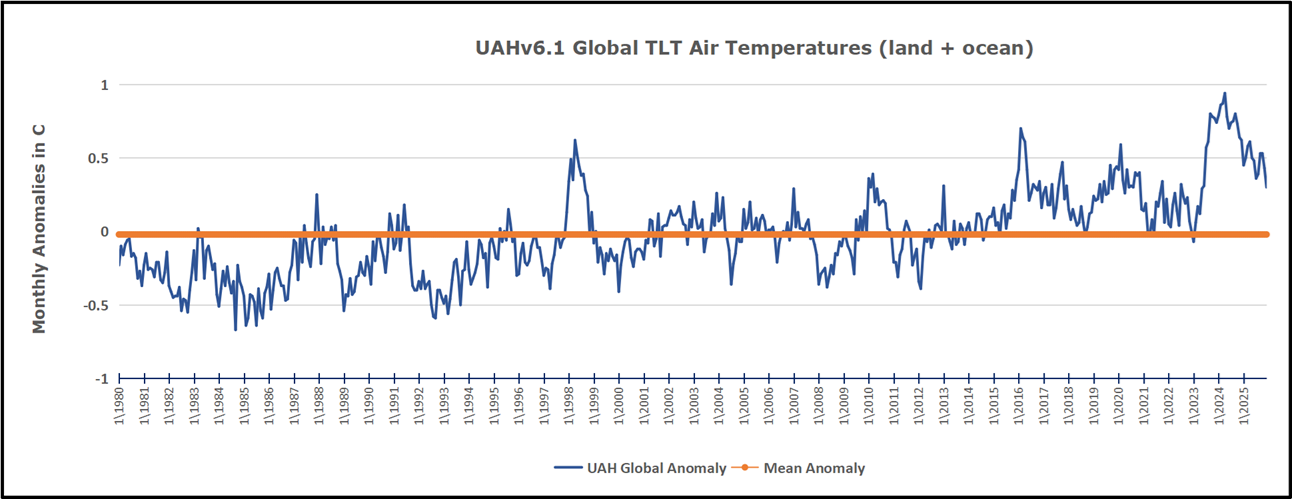
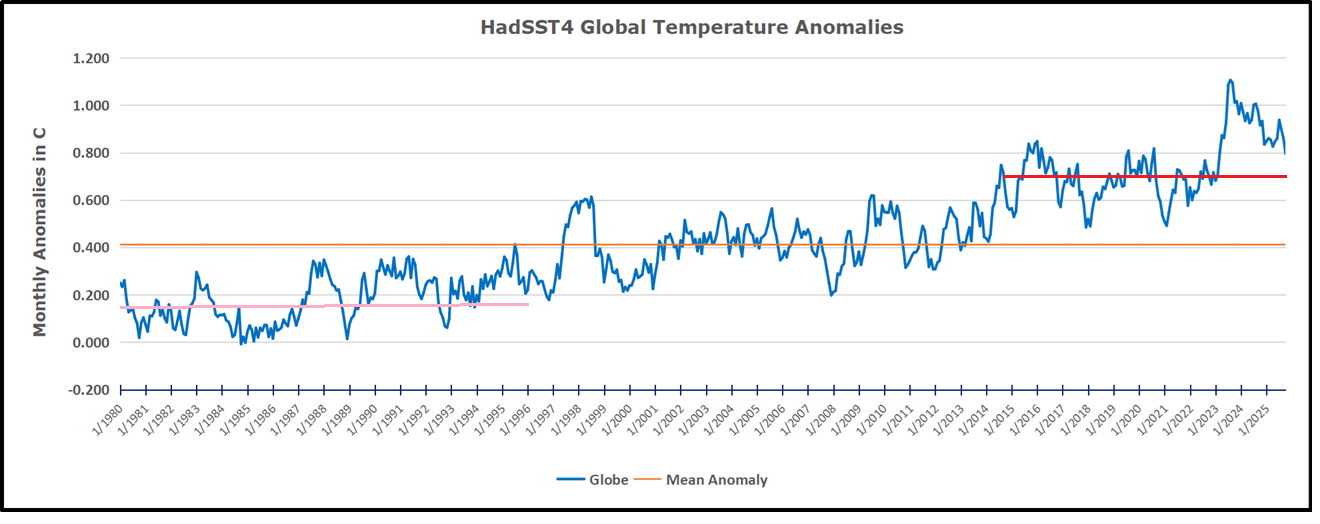
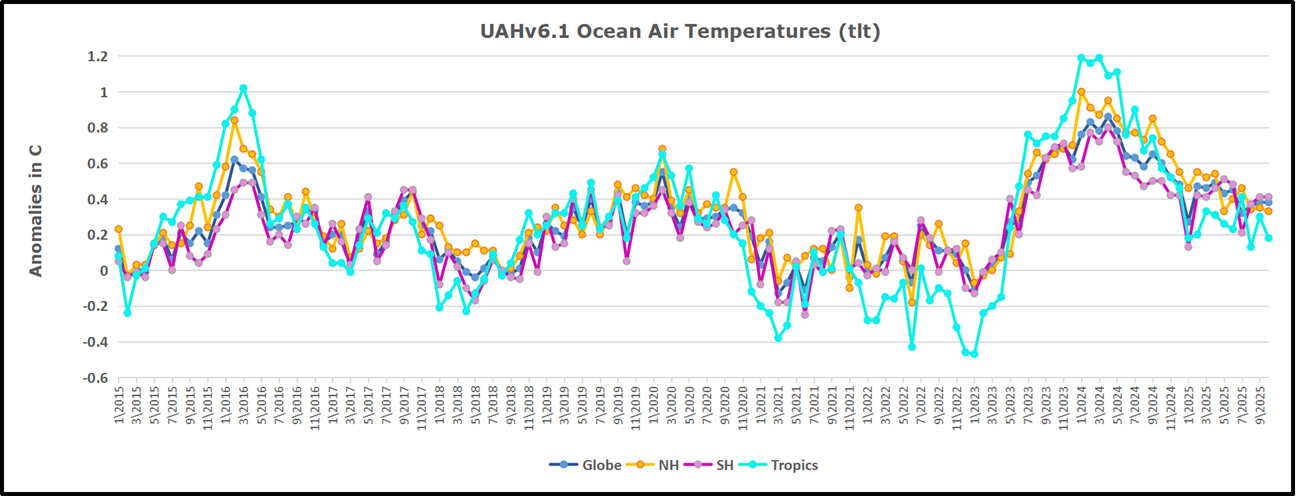
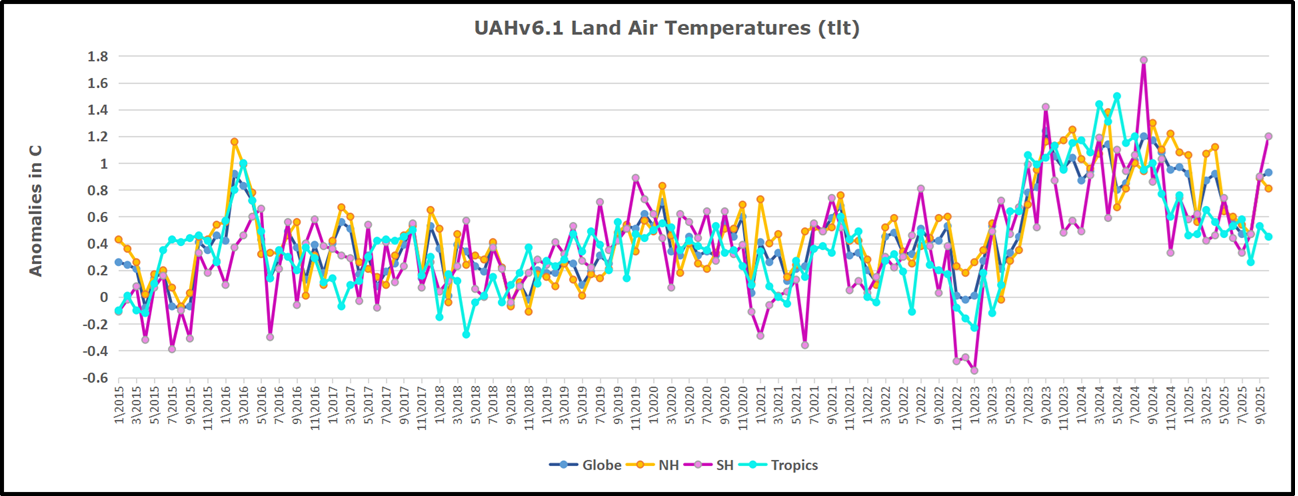
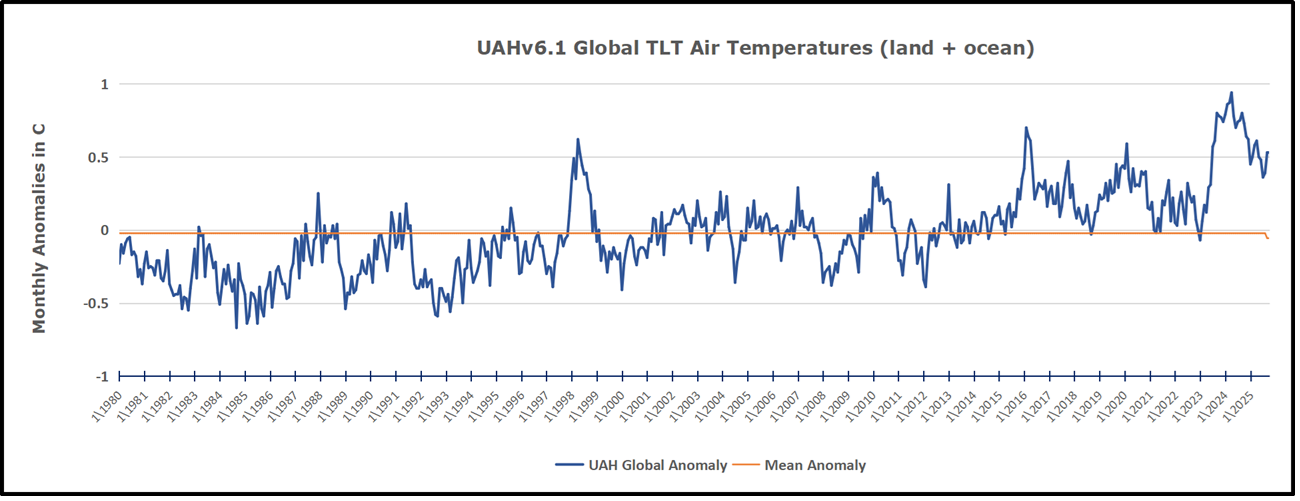
Let me start by dismissing the canard that global warming is an invention. Sure, maybe the so-called ‘homogenisation’ of past land and sea temperature data has artificially steepened the warming record since the 1940s. But, for all that, the NOAA satellite data since the end of 1979 shows that the temperature in the sub-troposphere has trended up by about 0.7⁰C between December 1979 and December 2024. As this data has been compiled by Roy Spencer and John Christy (sceptical scientists) at the University of Alamba in Huntsville, we can safely assume it is trustworthy.
So the climate has warmed. Now should come the scientific fun.
Competing theories jostling to best explain the data. No such fun.
Blaming exploitative Western man has proved to be a sacrosanct hypothesis.
Sacrosanctity and science don’t mix. Many past theories propounded by scientific giants have eventually failed the test: Ptolemy’s geocentric theory of the solar system; Aristotle’s theory of gravity, even Newton’s. Yet a tenuous theory of the climate concocted by relative mediocrities, which hasn’t come close to accurately predicting global temperatures, is holy writ. Risible, except that political and celebrity buy-in is undoing progress wherever it results in the replacement of reliable with unreliable energy. Think of Australia as a quintessential case study.
Happily, despite powerful and well-funded forces out to cancel dissenters, maverick scientists keep on stirring the pot. Which brings me back to Prof. Kennedy and his collaborators. Their hypothesis can be found here. In lay terms it goes like this:
The increased concentration of CO2 in the atmosphere since the 1960s has been caused by warming not the reverse. Other things equal, emissions by mankind of CO2 are all absorbed by the land (hence the greening) and by the oceans. Thus, on this account, there is no material net increase of CO2 in the atmosphere from fossil fuel emissions. Ergo, such emissions cannot be the cause of warming. It is true that warming has occurred, and that atmospheric CO2 has risen. The underlying chain of events is as follows.
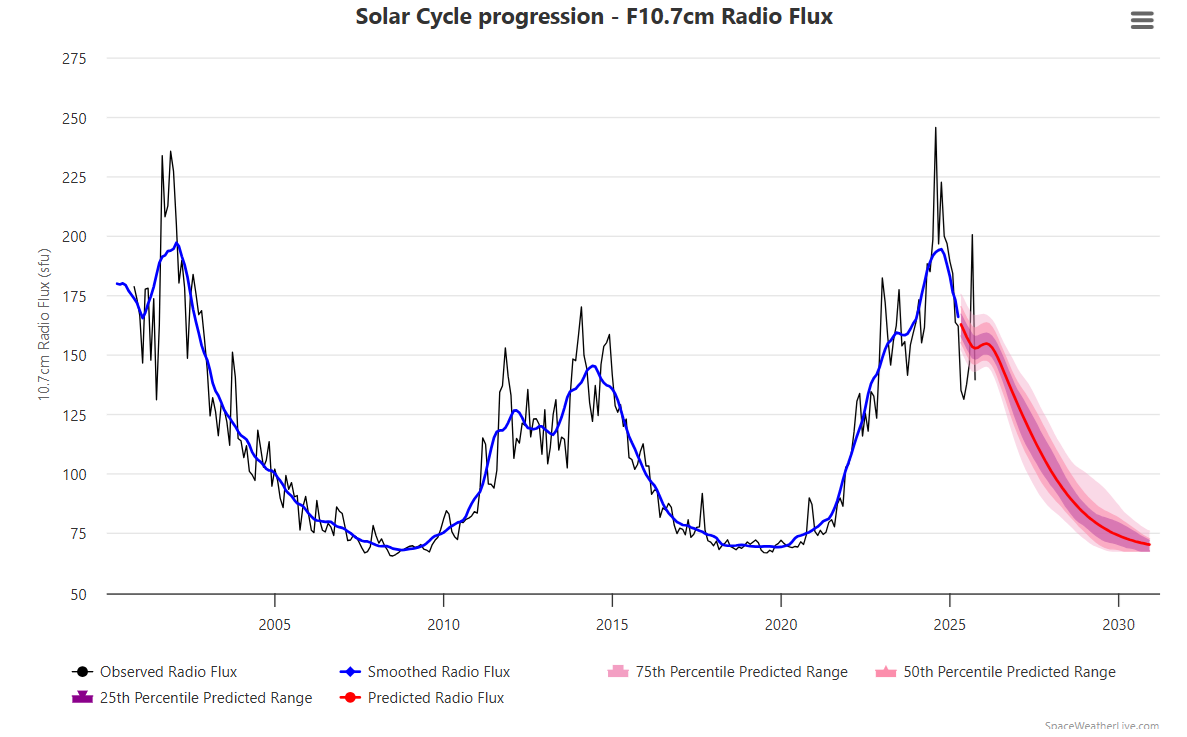
Warming, perhaps through solar activity, promotes the precipitation of calcium carbonate (limestone) in surface sea water, absorbing CO2 from the atmosphere in the process. In turn, the absorbed CO2, magnified by calcium carbonate precipitation, acidifies surface sea water. The acidification then results in the emission of CO2 into the atmosphere in autumn and winter. This emission of CO2 is greater than the absorption, precisely because of the continuing acidification in the warming water.
In the end we see increased atmospheric CO2 and warming.
It is easy to draw the wrong conclusion. Indeed, the IPCC has done so.
I see the point about Kennedy’s hypothesis being singularly different from other alternative hypotheses. Lindzen’s and Happer’s hypothesis, and Clauser’s, embrace the foundational proposition of the received theory, albeit in muted form. Namely, that man-made CO2 is adding to atmospheric CO2, thereby having a greenhouse effect. Kennedy’s hypothesis does not embrace that proposition.
Whether Kennedy is right (or Lindzen and Happer or Clauser) is by the way. Alternative hypotheses are in the skeptical scientific tradition of searching for theories which better explain the facts than does the received theory. That is particularly important in this case. The received theory is upending life as we know it, while being shielded from rival theories by money, politics and pseudo-religiosity.
The paper by Ivan Kennedy et al. is A Thermal Acid Calcification Cause for Seasonal Oscillations in the Increasing Keeling Curve . Synopsis below with excerpts in italics with my bolds and added images.
Abstract:
Why do atmospheric carbon dioxide levels rise and fall seasonally measured on Mauna Loa? This study explores the thermal acid-calcification (TAC) hypothesis, suggesting that seasonal temperature shifts in surface seawater trigger acid pH-driven CO₂ emissions caused by calcification. Using oceanographic data, we modeled how temperature affects dissolved inorganic carbon including CO₂, bicarbonate, and carbonate.
Our findings reveal that warming waters absorb atmospheric CO2 by promoting calcium carbonate formation, acidifying seawater and boosting CO₂ release to the atmosphere in late autumn and winter, when atmospheric CO₂ becomes highest. The model predicts a net annual CO₂ rise of 2 ppmv, driven by calcification rather than land-based processes. Seasonal pH swings of 0.04 units corroborate this mechanism. The TAC hypothesis indicates that continued ocean warming, not just fossil fuels, contribute to rising CO₂ levels, calling for deeper investigation into marine carbon dynamics.
The Keeling Curve for atmospheric pCO2 in parts per million by volume
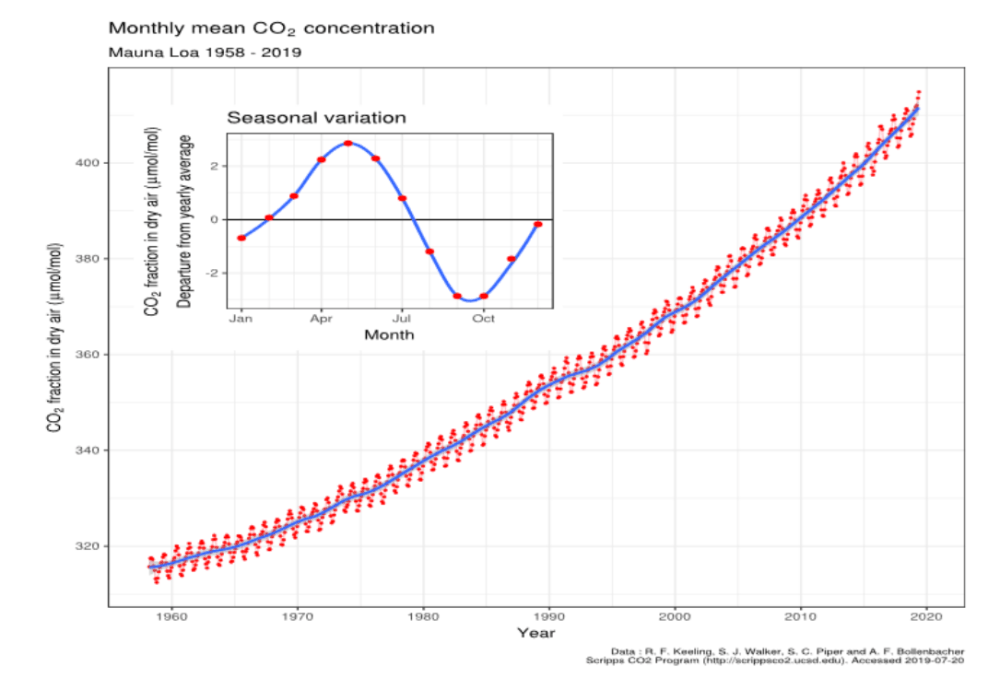
Fig. 1. The Keeling curve of atmospheric CO2 partial pressure at 3200 m on Mauna Loa, Hawaii. Data from Dr. Pieter Tans, NOAA/ESRL and Dr.Ralph Keeling, Scripps Institution of Oceanography.CC BY-SA
The very stuff of plant life on Earth in photosynthesis as well as in the structural basis of all living creatures, we are told by the United Nations Intergovernmental Panel on Climate Change (IPCC) (2) that the continuing rise of CO2 in the Keeling curve shown in Figure 1 now threatens global catastrophe from global warming. Such a paradoxical contrast for good and bad lacks credibility, given the longevity of life on Earth.
Transfers of CO2 out of the ocean surface in winter versus that entering in summer
We propose that a quasi-equilibrium exists between a falling pH value in surface water, favoring CO2 emisssion. Falling pH values in the surface water of the oceans have been an enigma, invisible to scientific view until recently after the year 2000. Our logic is supported in our articles (3, 4) where we describe the basis for the thermal acid-calcification (TAC) hypothesis, also using data cited from others. Acidic calcification is thermodynamically favored in warming surface seawater, particularly in northern oceans in spring and summer with shallow mixing zones and higher temperature ranges. This raises the fugacity or potential pressure of CO2 in seawater to its peak value in summer when the pCO2 in air is minimal, causing its forceful emission into air in the next autumn reaching a maximum pCO2 in late winter (Fig. 1, seasonal variation insert).
Fig. 2. Thermal acid-calcification model for seasonal and longer-term generation of the Keeling curve. The Thermal model (3), showed calcification is favored by increase in temperature giving decreasing pH values in summer, reversing in cooler conditions to more alkaline pH in winter. Note that precipitation of CaCO3 in spring to summer removes CO32- that is replaced from HCO3 – with more acidity, provided by absorption of CO2 from air up to October. However, as the pH falls the steady state concentration of [CO2} increases favoring photosynthesis.
Acid calcification is essential for phytoplankton
Any process of strong acidification of surface seawater will raise the concentration of carbon dioxide as [CO2] available to phytoplankton for photosynthesis. Bicarbonate cannot be a direct substrate for photosynthesis although the presence of the enzyme carbonic anhydrase speeds up its interconversion with CO2. Our published modeling analysis confirmed that CaCO3 precipitation is strongly favored by warmer temperatures (Table 1). Indeed, all the reaction equilibria in seawater are displaced to the right in Figure 2 acidifying the water, although the equilibrium between CO2 concentration and pCO2 in air favors a lower concentration [CO2} in water in summer, compared to winter, when it is greatest. Our results even confirmed that the formation of CaCO3 as calcite is predicted to increase in summer as water becomes warmer (Table 1b).
Thus, we can expect more limestone formation in summer if the carbonate concentration reaches a sufficient level, favored by added warming. The decline in average pH values in surface seawater to about 8.05 from pH 8.20 could explain the increased pCO2 in the atmosphere of 140 ppmv since 1800 as a matter of dynamic equilibrium. Caused by calcification, this would require a simultaneous equivalent deposition of limestone as sediment, though only an increase of about 10 μmoles per kg of surface seawater, or a net 1 mg per kg each year. This is a key prediction for experimental testing of the TAC hypothesis.
This fully reversible calcification equation moves towards acidification in summer and reverses to alkalinization in winter. The psi factor is a variable function of the range of seasonal changes in temperature. However, the greatest thermodynamic potential to emit CO2 in seawater by acidification of bicarbonate (HCO3-) is when the pH value is lowest, the conversion of bicarbonate to CO2 generating the greatest difference between CO2 fugacity in seawater and that in air in midsummer in northern hemisphere waters. The seasonal variation near Mauna Loa in atmospheric pCO2 is about 6 ppmv whereas the long term increase in the Keeling curve year by year is one third of this, about 2 ppmv suggesting that in spring and summer the CO2 absorbed in about 2 ppmv, less than that emitted in autumn and winter.

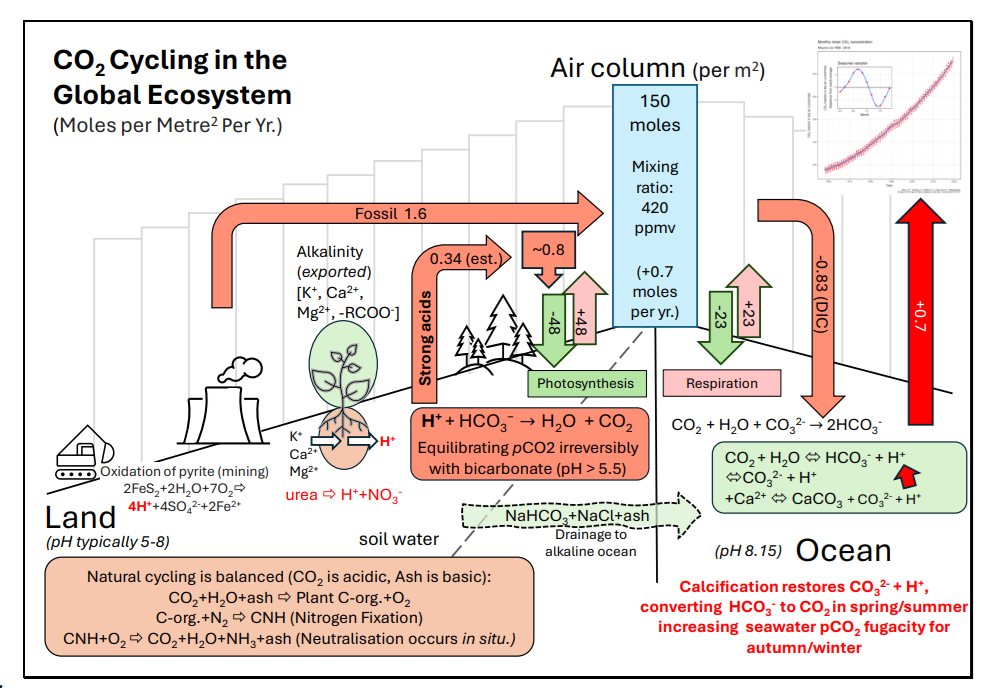
Fig. 5. Rates per square meter in global carbon cycling between land water, the atmosphere, and the ocean, illustrating the pH-acidification hypothesis. Emissions and absorptions shown are average moles per square meter of the Earth, for a mixing ratio of 420 ppmv in 2021 shown in the central column bridging land and ocean. The land acidification values are derived elsewhere (11), assuming photosynthesis is equal to respiration. The terrestrial area of Earth is 1.48×10¹⁴ m-2 , the ocean’s area is 3.62×10¹⁴ m2 , 5.101 x10¹⁴ m2 in total., represented as a mean value in the central air column.
Discussion
Limestone as a product of calcification is regarded as a biogeochemical product, given that phytoplankton and other marine organisms enhance its rate of production, if nutrients are available (3). In particular, the extracellular carbonic anhydrase apparently speeds the reversible dehydration of CO2, forming bicarbonate and hydrated hydrogen ions (H+) controlling pH. This article emphasizes that the reversible dehydration of CO2 in surface seawater allowing transfer between aqueous and gaseous phases is most rate limiting of all, that carbonic anhydrase may even assist in autumn and winter, transferring CO2 to the atmosphere.
More significantly for managing climate change, if fossil fuel emissions are being largely absorbed by sequestration into the ocean surface and by ‘greening’ photosynthesis on land and in the ocean (11), the implications of this aspect of the TAC hypothesis for carbon-zero policies and renewable energy are profound.
The thermal acid-calcification hypothesis predicts that global warming
acidifies the ocean surface by increasing calcification causing
pCO2 to increase, independently of fossil emissions.
Furthermore, this represents a striking illustration of the Le Chatelier principle, the carbon cycle on Earth responding intelligently to changing climate. The hope that carbon dioxide removal as sequestration (14), either biologically, chemically or geologically, by burial after capture, will prove futile.
The uncertainty of the current IPCC paradigm regarding climate change and the role of fossil emissions of CO2 in warming is large, lacking scientific evidence. A plausible alternative hypothesis offered here as the true cause of the increasing Keeling curve needs to be investigated urgently. This new model would still give predictively increasing emissions from the ocean in the complete absence of fossil fuel emissions because the acidification from calcification is purely a function of surface warming, from whatever cause.
See Also
Yearend 2025, Cooling Temperatures Reducing CO2 Rise
Key Point
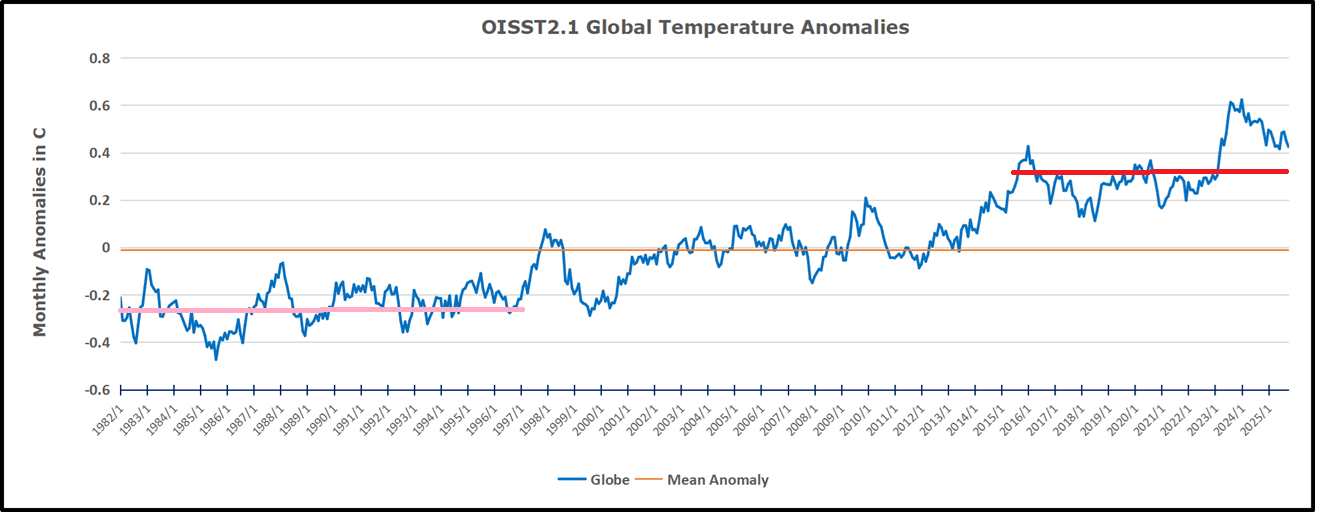
Changes in CO2 follow changes in global temperatures on all time scales, from last month’s observations to ice core datasets spanning millennia. Since CO2 is the lagging variable, it cannot logically be the cause of temperature, the leading variable. It is folly to imagine that by reducing human emissions of CO2, we can change global temperatures, which are obviously driven by other factors.


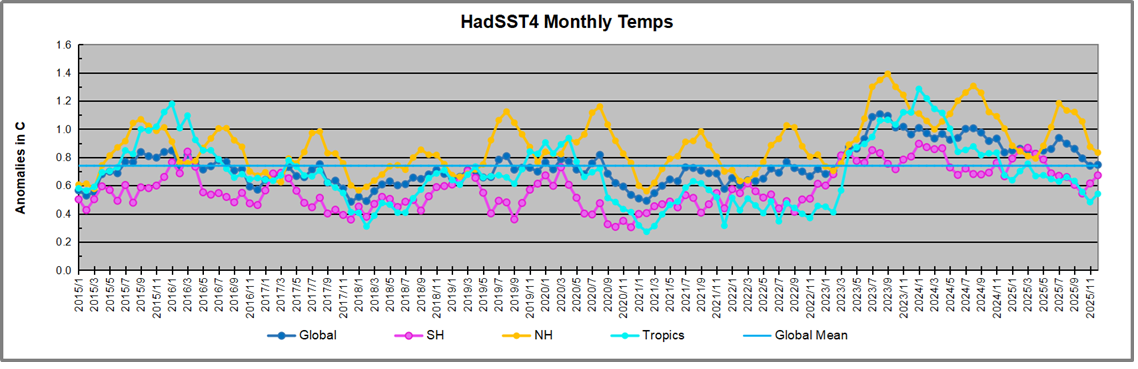
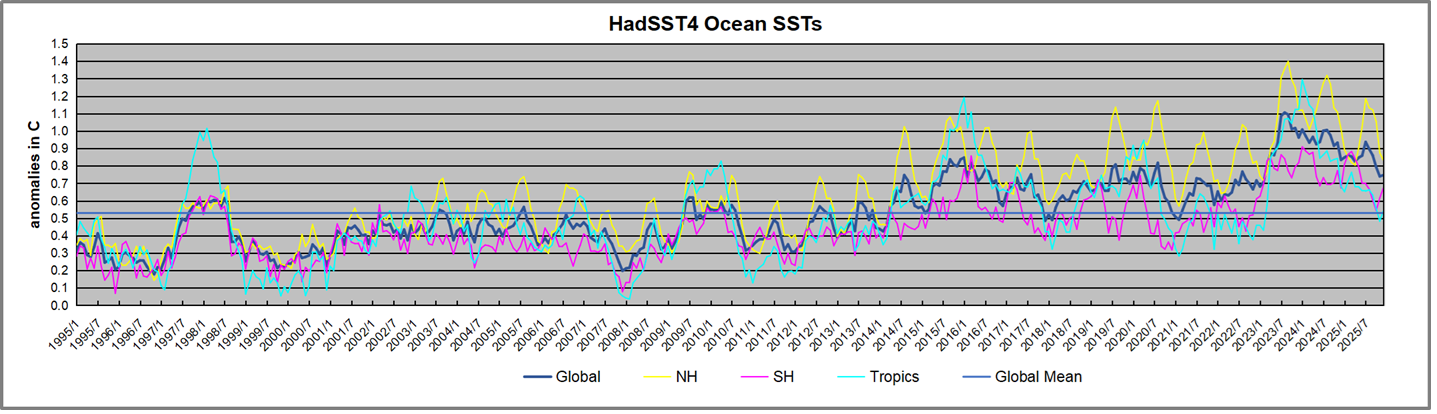
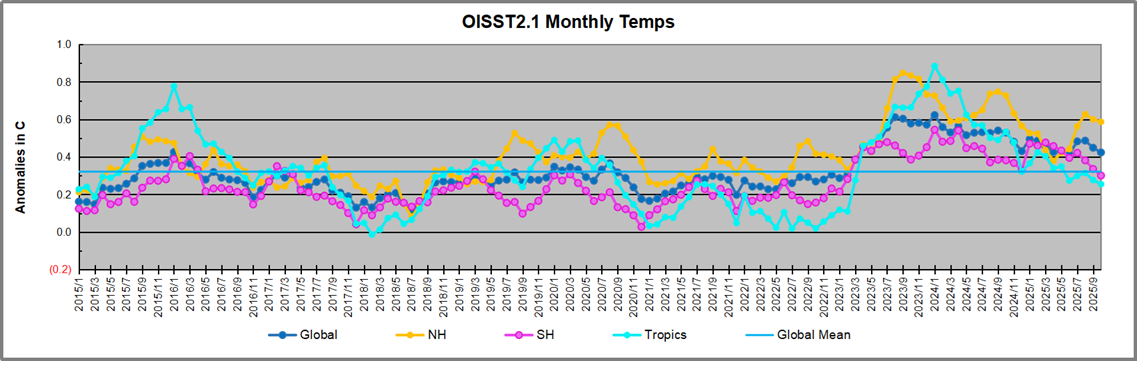
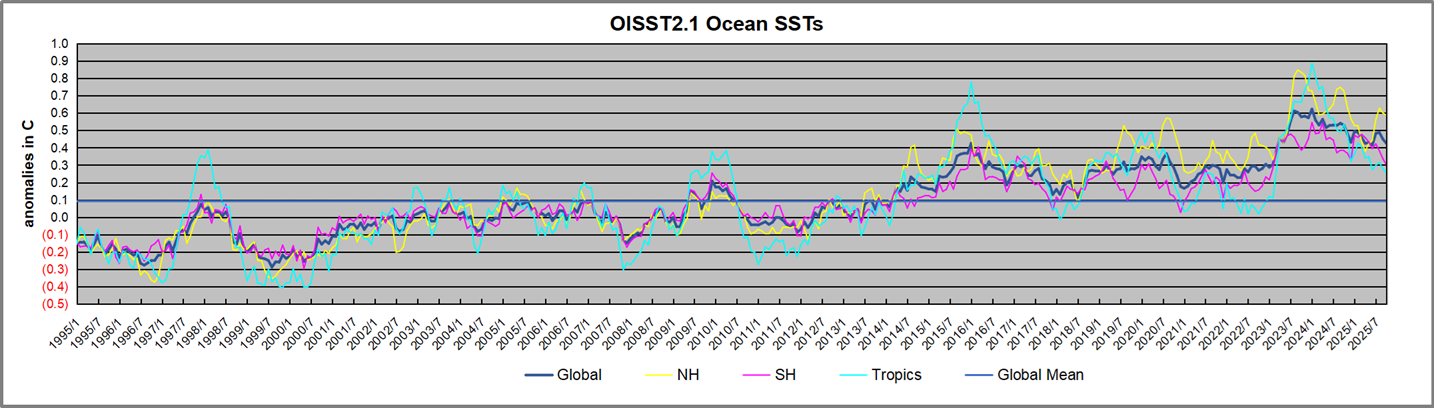
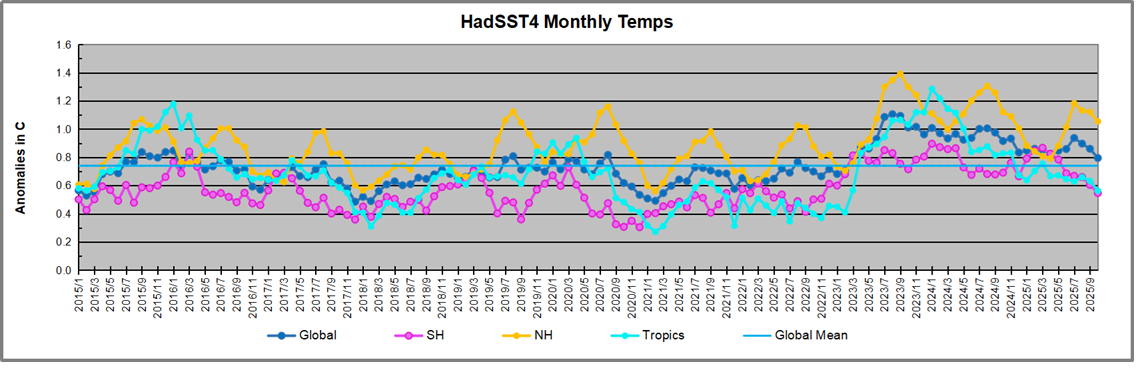
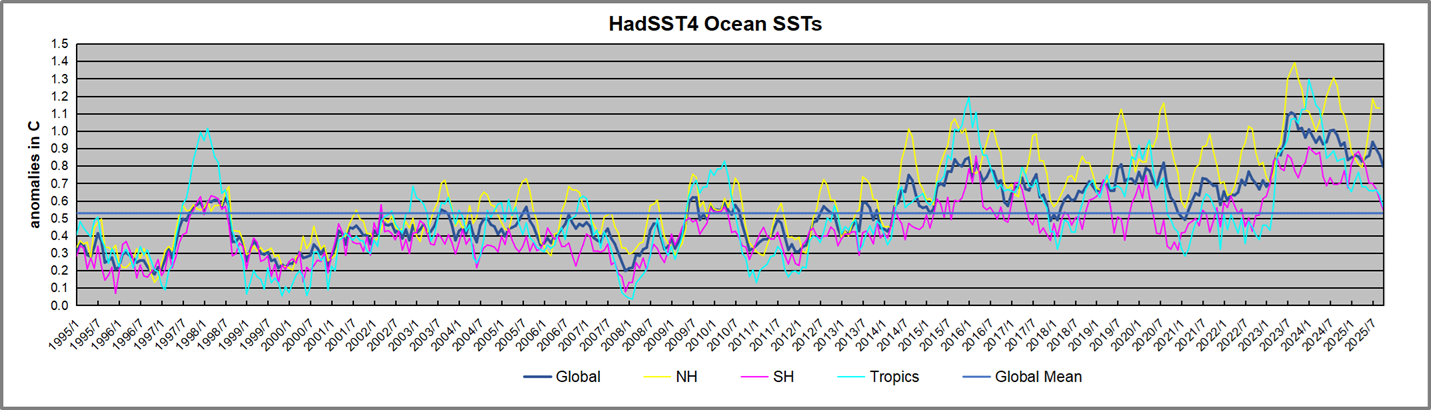
 The best context for understanding decadal temperature changes comes from the world’s sea surface temperatures (SST), for several reasons: