Norway’s Climate Angst.

It is not only US climatists alarmed about faithless political appointees to energy and environmental positions. Now some Norwegians are stewing. International Business Times article (here) A climate change denier has just been put in charge of melting Arctic island of Svalbard Per-Willy Amundsen has stated previously that he believes climate change to be a socialist ploy.
Climate change sceptic Per-Willy Amundsen of the populist right-wing Progress Party has been appointed Minister of Justice and Public Security in Norway in a cabinet reshuffle.
Amundsen does not believe that human activity is driving climate change, and says that climate change is used to disguise socialist policies, he previously told the Norwegian newspaper Stavanger Aftenblad.
Norway’s Polar Affairs Department will fall under Amundsen’s brief, including administrative responsibility for Svalbard. The island is surrounded by the Arctic Ocean, the Greenland Sea and the Barents Sea, and lies between mainland Norway and the North Pole. It has been facing increasing challenges due to climate change in recent years.
This is another crisis brewing for the climate movement because Norwegian officials are resolute believers in climatism, despite (or maybe because of) the oil wealth pouring into their sovereign fund. Norwegians seem conflicted about their oil wealth, going out of their way to proclaim their faith in climate change doctrine.
For example, in the Exxon shareholder activist initiative last May, a large portion of supporting votes came from shares held by the Norwegian wealth fund. Another bunch of votes came from the Rockefeller family acting against management of the company founded by their patriarch. (Details here).
Note the posturing by Norway PM Solberg:
Despite Amundsen’s stated views in the past, Norway’s prime minister Erna Solberg denied that she had appointed climate-change sceptics to her cabinet. “Everybody in this government believe climate change is man-made,” EUobserver reported Solberg to have said.
The appointment raises questions about how Amundsen will address the problems of Svalbard, and other areas of Norway being affected by climate change.
“Many of the challenges faced on Svalbard are related to climate change one way or the other,” Ivar Berthling, professor of geography at the Norwegian University of Science and Technology, told IBTimes UK.
This is interesting also because of the recent deluge of media reports about shrinking reindeer on Svalbard (here). Fortunately for Norwegians, and for all of us, Norway has scientists who are not confused about climate change and have made their evidence and analyses widely available. Chief among them is Dr. Ole Humlum founder of the excellent climate information website Climate4you.
Arctic gateway seas (20W-40E. 70-80N) heat content 0-700 m depth

Map showing the Arctic Gateway Seas within 20W-40E and 70-80N, for which the heat content within the uppermost 700 m is shown in the three diagrams, for East Greenland Sea, West Svalbard Sea and Barents Sea.
Svalbard archipelago, which includes Spitzbergen, is located at the gateway for Gulfstream Atlantic water entering the Arctic. Thus changes there are indicative of climate across the entire Arctic. As with other oceanic islands, like Australia, variations in land surface temperatures are synchronized with sea surface temperatures.
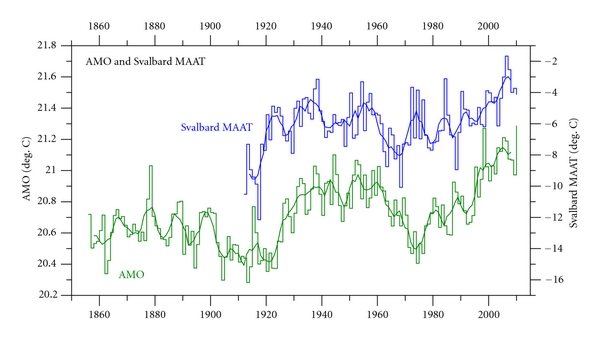
Figure 4: Svalbard MAAT 1912–2010 (blue) and Atlantic Multidecadal Oscillation (AMO, green) annual index values 1856–2010. The thick lines are the simple running 5 year average. Note that the temperature scales are different
From Spectral Analysis of the Svalbard Temperature Record 1912–2010
Ole Humlum, Jan-Erik Solheim, and Kjell Stordahl (here)
During summer the daily meteorological conditions are highly influenced by the incoming solar radiation, which at 78°13′N are continuously above the horizon from 19 April to 23 August. Nevertheless, because of the nearby ocean, the air temperature usually stays relatively low, with July having an average temperature of 6.5°C (1981–2010). Summer air temperatures are also influenced by local wind conditions, partly reflecting land-sea breeze effects because of relatively small regional air pressure differences during the summer. All these factors are relatively stable from summer to summer.
During winter the meteorological conditions are very different from the summer. The sun stays below the horizon from 28 October to 14 February, and there is very little incoming solar radiation from December to February. The ground is snow covered, and much of the surrounding ocean and fjords are covered by sea ice. So whenever calm conditions prevail, inversions tend to develop and temperatures will be low at Svalbard Airport. However, conditions are frequently windy during the winter, destroying inversions, and from time to time warm air masses are advected towards Svalbard from the North Atlantic. Whenever this happens, the air temperature will rise significantly, as much as 10–15°C within few hours. In winters with high frequency of such events, the average temperature will be high and vice versa in winters where advection of warm air masses occurs less often. Also local foehn effects may be important during the winter. Together, this explains the high degree of winter temperature variability compared to the summer variability.
Advection of warm air masses from lower latitudes towards Svalbard occurs at all seasons, but is most frequent during the winter. This explains why the Svalbard air temperature is well coupled to North Atlantic temperature conditions both in summer and winter, and why several oscillations can be recognised in the spectra of both summer and winter temperature records (Figure 5). Had this not be so, one would expect at least potential solar signals to be absent from the winter data.
![Figure 1: The Svalbard temperature record 1912–2010 [4], showing the mean annual air temperature (MAAT), the average summer temperature (JJA), and the average winter temperature (DJF). Thin lines show annual values, and thick lines show the simple 5 yr average. The linear MAAT increase 1912–2010 is 0.23°C per decade.](https://rclutz.com/wp-content/uploads/2016/12/175296-fig-001.jpg)
Figure 1: The Svalbard temperature record 1912–2010 [4], showing the mean annual air temperature (MAAT), the average summer temperature (JJA), and the average winter temperature (DJF). Thin lines show annual values, and thick lines show the simple 5 yr average. The linear MAAT increase 1912–2010 is 0.23°C per decade.
For Svalbard our experimental forecast suggests that the observed late 20th century warming is not going to continue, but are likely to be followed by variable, but generally not higher temperatures for at least the coming 20–25 years. The falsification time scale for this forecast is about 7 years.
Summary
Once again, climate confusion and angst is born by activists conflating human and natural influences on weather patterns.

The Original Sin of debasing the term “climate change” was committed by the IPCC when they intentionally limited their scope to man made climate change. From the Principles Governing IPCC Work
The role of the IPCC is to assess on a comprehensive, objective, open and transparent basis the scientific, technical and socio-economic information relevant to understanding the scientific basis of risk of human-induced climate change, its potential impacts and options for adaptation and mitigation.
All five IPCC reports have proceeded to claim most or all of the warming since 1950 is caused by human activity, especially burning of fossil fuels. They express confidence levels of 95% or more, all the while dismissing natural factors and long term warming and cooling cycles without even analyzing them.
Norway needs to listen to and take comfort from their own scientists. As Humlum at al. point out:
Climate development with possible anthropogenic effects occurs on a background of natural climatic variations, which may be considerable, and especially in the Arctic. Natural climate variations however remain poorly understood, although they remain important for discriminating between natural and anthropogenic influences on current climate change.
Natural cycles that have remained strong over long time are likely to continue without major changes into at the near future. Knowledge on such natural oscillations is therefore essential for forecasting future climate.
For more on Svalbard’s largest island see Spitsbergen Triangle: Ground Zero for Climate Mysteries