
Arctic sunset to occur in the next weeks. Nunavut is already having Civil Twilight, meaning the sun is less than 6 degrees below the horizon during the night.
The extent of Arctic ice fell to a new wintertime low in March 2017. But springtime ice persisted and extents since June are hanging around the decadal average. Below shows the last 27 days through yesterday, August 11, 2017.
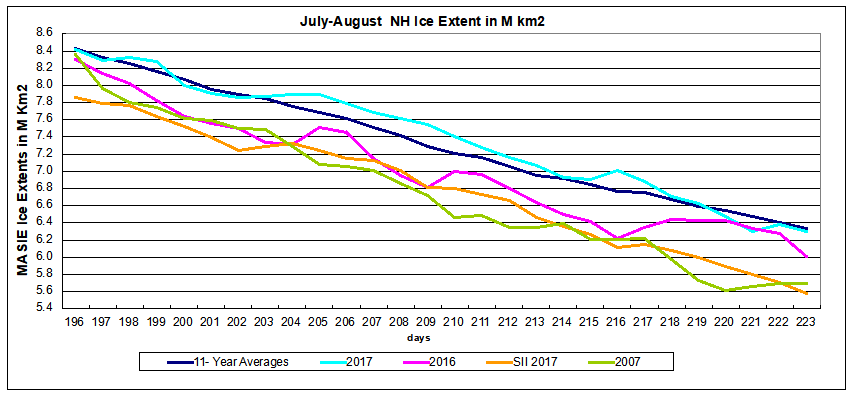
For this period 2017 was mostly average or higher, continuing into August. This year is now almost 300k km2 greater than 2016 and exceeds 2007 by 600k km2. SII 2017 is also 600k km2 lower.
As we shall see, this year’s extents are in surplus on the Atlantic side, offset by deficits on the Pacific side. The image compares day 223 with the same day in 2007.

The Table compares 2017 day 223 ice extents with the decadal average and 2007.
| Region | 2017223 | Day 223 Average |
2017-Ave. | 2007223 | 2017-2007 |
| (0) Northern_Hemisphere | 6295153 | 6338630 | -43477 | 5690646 | 604507 |
| (1) Beaufort_Sea | 646803 | 740583 | -93779 | 767724 | -120921 |
| (2) Chukchi_Sea | 342601 | 479258 | -136657 | 261771 | 80831 |
| (3) East_Siberian_Sea | 411714 | 663564 | -251849 | 207590 | 204124 |
| (4) Laptev_Sea | 430221 | 329873 | 100349 | 310764 | 119458 |
| (5) Kara_Sea | 140411 | 123400 | 17011 | 215854 | -75443 |
| (6) Barents_Sea | 60001 | 28883 | 31118 | 15996 | 44005 |
| (7) Greenland_Sea | 236735 | 253185 | -16450 | 286393 | -49658 |
| (8) Baffin_Bay_Gulf_of_St._Lawrence | 207230 | 71011 | 136219 | 83942 | 123288 |
| (9) Canadian_Archipelago | 527348 | 439371 | 87977 | 361883 | 165465 |
| (10) Hudson_Bay | 70437 | 87621 | -17184 | 94262 | -23825 |
| (11) Central_Arctic | 3220493 | 3120642 | 99851 | 3083211 | 137282 |
Deficits to average are in the BCE region, and surpluses appear almost everywhere else. Ice is particularly strong in Laptev, Baffin, CAA and the Central Arctic.
The graph below shows Barents this year continues to be above average but fell behind the record year of 2014. After pausing at 70K km2, it dipped to 50k km2, then bounced back to 60k yesterday.
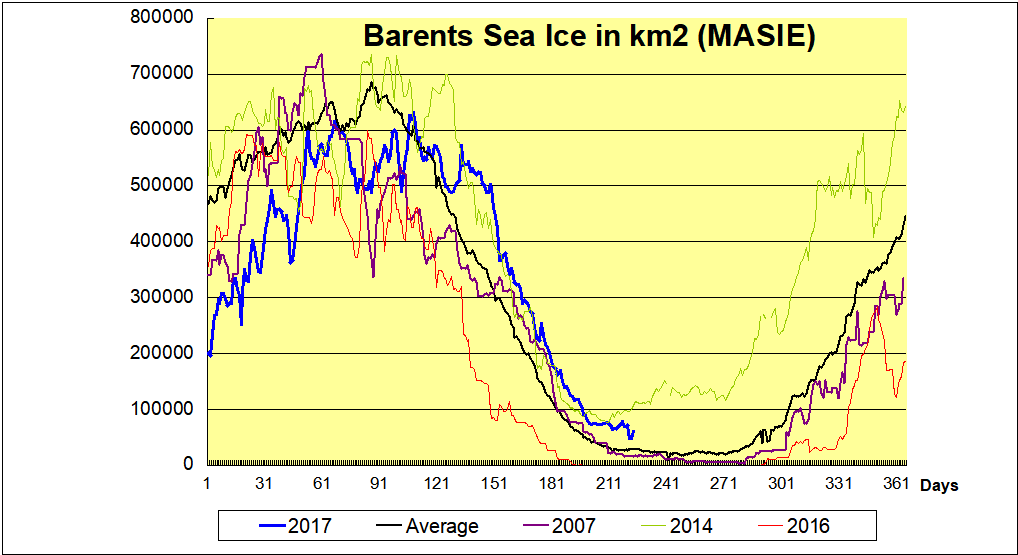
The black line is average for the last 11 years. 2007 in purple appears close to an average year. 2014 had the highest annual extent in Barents Sea, due to higher and later maximums, holding onto ice during the summer, and recovering quickly. In contrast, 2016 was the lowest annual extent, melting out early and recovering later. 2017 in blue started out way behind, but grew rapidly to reach average, and then persisted longer to exceed even 2014. It will be important to see when the recovery of ice begins.
For more on why Barents Sea matters see Barents Icicles


I wondered what SII means. SII = Sea Ice Index.
I know Wikipedia is not reliable on climate, but decided to have a look anyway. I found something that William Connolley may have missed.
In salty ambient conditions, dissolution rather than melting often causes the ablation of ice. E.g. the temperature of the Arctic Ocean is generally below the melting point of ablating sea ice. The phase transition from solid to liquid is achieved by mixing salt and water molecules, similar to the dissolution of sugar in water, even though the water temperature is far below the melting point of the sugar. Hence dissolution is rate limited by salt transport whereas melting can occur at much higher rates that are characteristic for heat transport.[36]
https://en.wikipedia.org/wiki/Ice#Ablation
[36] Woods, Andrew W. “Melting and dissolving”. J. Fluid Mech. 239: 429–448. doi:10.1017/S0022112092004476.
Translating this into plain English: Arctic ice is not melting, but dissolving. The reason is that currents are bringing salty water into the Arctic.
Since my Earth science supervisor was a geologist, I picked up his habit of looking at the big picture and thus found the following paper useful for perspective. On the second page we read,
“Under the influence of winds and ocean currents, the Arctic sea-ice cover is in nearly constant motion. The large-scale circulation principally consists of the Beaufort Gyre, a mean annual clockwise motion in the western Arctic Ocean with a drift speed of [1 to 3 cm/s], and the Transpolar Drift, the movement of ice from the coast of Siberia eastward across the pole and into the North Atlantic by way of Fram Strait (Fig. 1). Ice velocities in the Transpolar Drift increase toward Fram Strait, where the mean drift speed is [5 to 20 cm/s] (Thorndike, 1986; Gow and Tucker, 1987).
About 20% of the total ice area of the Arctic Ocean and nearly all of the annual ice export is discharged each year through Fram Strait, the majority of which is multi-year ice….”
Polyak et al. History of sea ice in the Arctic, Quaternary Science Reviews xxx (2010) 1–22, 2010.
Click to access Polyak%20etal%20seaice%20QSR10%20inpress.pdf
Read it again:
“About 20% of the total ice area of the Arctic Ocean and nearly all of the annual ice export is discharged each year through Fram Strait, the majority of which is multi-year ice….”
Arctic ice is melting, it’s just not melting while in the Arctic.
LikeLike
Thanks Frederick for the comment and links. Your last sentence is a nice, provocative summary. I was alerted to this by a AARI (Russian) book and posted:
https://rclutz.wordpress.com/2016/03/02/the-great-arctic-ice-exchange/
Your reference to the Fram Strait is also pertinent, since unusually high transport through there before 2000 led to dropping extents in Septembers, stabilizing after 2007. See:
https://rclutz.wordpress.com/2015/10/06/arctic-ice-made-simple-2/
The main point is that fluxes in salinity and currents cause greater or lesser ice extents, nothing to do with CO2.
LikeLike
Still waiting for the big chill.
Is it going to happen now or will it just keep melting away?
Does the extra Greenland ice/snow cover mean less heat available overall this year.
Would love to go forward a year and see the result now.
LikeLike
Re: Big Chill
I’m not sure about below 80 degrees (latitude) but north of that, per DMI, it has been unusually cold. We’ve seen roughly 110 days of at or below normal, and for the last few days it’s been below freezing. Melting factors now are water temps under the ice, relative salinity and current/wind-driven ice motion. Tough to predict those over the next 3 or 4 weeks of the remaining melt season
LikeLike
The trip to the North Pole was cancelled due to….ICE.
https://www.thetimes.co.uk/article/sailing-to-north-pole-will-have-to-wait-dkm95rtrd
LikeLike
Thanks Brad. I followed the Northabout journey last year, but haven’t been watching this year. The images above show CAA (Canadian Arctic Archipelago) is not giving up ice so easily.
LikeLike
Not looking good for Northwest passage either. Ice is clogging a key choke point and there are just a few weeks for it to open. Icebreaker could likely get through, but that’s not really the point.
LikeLike