10 Days in Pacific Arctic: The above image shows the pacific ice seesaw returning at the end of February. Bering Sea on the right was at 95% of 2018 maximum and then lost 180k km2 in ten days, now at 65 % of max. Meanwhile on the left Okhotsk Sea gained 70k km2, and is now 106% of 2018 maximum.
The graph below shows February progress in ice extent recovery. As noted before, the month started with a slight decline, then ice grew rapidly for 18 days peaking on day 54 above the 12 yr. average, and above the previous two years. Then ice retreated the last five days with the February monthly average ending 240k km2 or 2% below average. SII lags MASIE by ~100k km2 for the month.
The next two weeks will show whether 2019 is maxed out, or whether the ice extent catches up to the average which flatlines over that period.

The table below shows the distribution of ice in the various Arctic basins.
| Region | 2019059 | Day 059 Average |
2019-Ave. | 2018059 | 2019-2018 |
| (0) Northern_Hemisphere | 14625288 | 15006867 | -381579 | 14485052 | 140236 |
| (1) Beaufort_Sea | 1070498 | 1070200 | 297 | 1070445 | 53 |
| (2) Chukchi_Sea | 960221 | 965872 | -5651 | 965971 | -5750 |
| (3) East_Siberian_Sea | 1087137 | 1087133 | 4 | 1087120 | 18 |
| (4) Laptev_Sea | 897845 | 897842 | 3 | 897845 | 0 |
| (5) Kara_Sea | 931672 | 929289 | 2383 | 922905 | 8767 |
| (6) Barents_Sea | 684894 | 625620 | 59274 | 544938 | 139956 |
| (7) Greenland_Sea | 513404 | 628938 | -115534 | 473064 | 40340 |
| (8) Baffin_Bay_Gulf_of_St._Lawrence | 1570308 | 1539346 | 30962 | 1786606 | -216298 |
| (9) Canadian_Archipelago | 853337 | 853036 | 302 | 853109 | 229 |
| (10) Hudson_Bay | 1260903 | 1260611 | 293 | 1260838 | 66 |
| (11) Central_Arctic | 3231172 | 3213214 | 17958 | 3065181 | 165991 |
| (12) Bering_Sea | 250169 | 710647 | -460479 | 336065 | -85896 |
| (13) Baltic_Sea | 39687 | 110466 | -70780 | 123280 | -83594 |
| (14) Sea_of_Okhotsk | 1260392 | 1067746 | 192646 | 1069898 | 190494 |
The table shows how 2019 is matching the 12-year average almost everywhere. Barents Sea has caught up and edged ahead of average, and much higher than last year. Greenland Sea is below average but higher than 2018. The overall deficit is due to Bering ice down 460k km2 to average, only partially offset by a surplus of 193k km2 in Okhotsk.
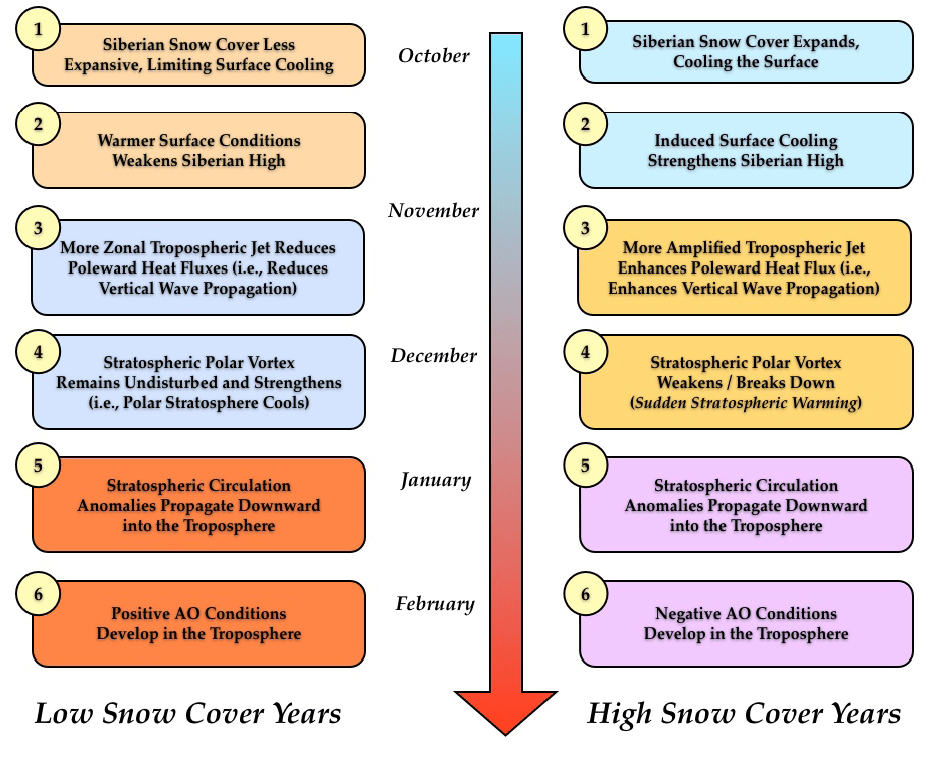
Footnote: At his AER blog Arctic Oscillation and Polar Vortex Analysis and Forecasts Dr. Judah Cohen writes on Feb. 25 regarding this cold winter in the Arctic. Excerpts in italics with my bolds.
As I have written many times in the blog this fall and winter season the influence of a significant stratospheric PV disruption typically lasts on the order of four to eight weeks. It certainly looks like the PV split from early January has gone the distance and has persisted for a full eight weeks or possibly even a little longer. Based on the latest polar cap geopotential heights (PCHs) forecast the whole event is winding down over the next week or so. Therefore, I think that we can start to draft the obituary for this event.
The stratosphere-troposphere coupling differed from last year’s PV split and other previous similar events but certainly not all. Though the “dripping” of warm PCHs occurred periodically, there were long gaps between “drips” where the tropospheric PCHs even turned cold for an appreciable period. Also, the AO and NAO never turned strongly negative nor was there any persistent period where both indices remained in negative territory. This is in strong contrast to last winter. As I wrote in last week’s blog, I think at least part of the reason might be the relatively cold central Arctic this winter compared with the last several winters where the Arctic was near or at record warm.
Though despite what could be considered atypical or less traditional stratosphere-troposphere coupling following the stratospheric PV split, I would argue there were still some impressive impacts on the weather. Maybe those impacts were more discernable and more impressive across North America than Eurasia, but both continents had record cold and snow.
So, what to expect as the stratosphere-troposphere coupling event wraps up. For Europe, temperatures are already mild and with the AO predicted to remain positive and could potentially turn even more strongly positive if the cold PCHs couple all the way to the surface, it is hard for me to see a return to any kind of prolonged cold this month. Across North America it is more complicated. Cold temperatures are predicted to be expansive across the continent and even record cold is possible over the next week or so. In addition, snow cover is relatively extensive and, in many locations, unusually deep especially on either side of the US-Canadian border. I don’t expect the cold air across in North America to simply disappear anytime soon, but if the if the cold PCHs couple all the way to the surface, this would favor the cold temperatures being mostly confined to western North America. I also feel that circulation and temperature anomalies in the stratosphere suggest a relatively cold western North America and relatively mild eastern North America especially Eastern US. And despite the cold start to March in the Eastern US the models are predicting a return to mild conditions by the middle of March.


Reblogged this on Climate Collections.
LikeLike