
With Arctic ice melting season underway, warmists are again stoking fears about ice disappearing in the North. In fact, the pattern of Arctic ice seen in historical perspective is not alarming. People are over-thinking and over-analyzing Arctic Ice extents, and getting wrapped around the axle (or should I say axis). So let’s keep it simple and we can all readily understand what is happening up North.
I will use the ever popular NOAA dataset derived from satellite passive microwave sensors. It sometimes understates the ice extents, but everyone refers to it and it is complete from 1979 to 2018. Here’s what NOAA reports (in M km2):
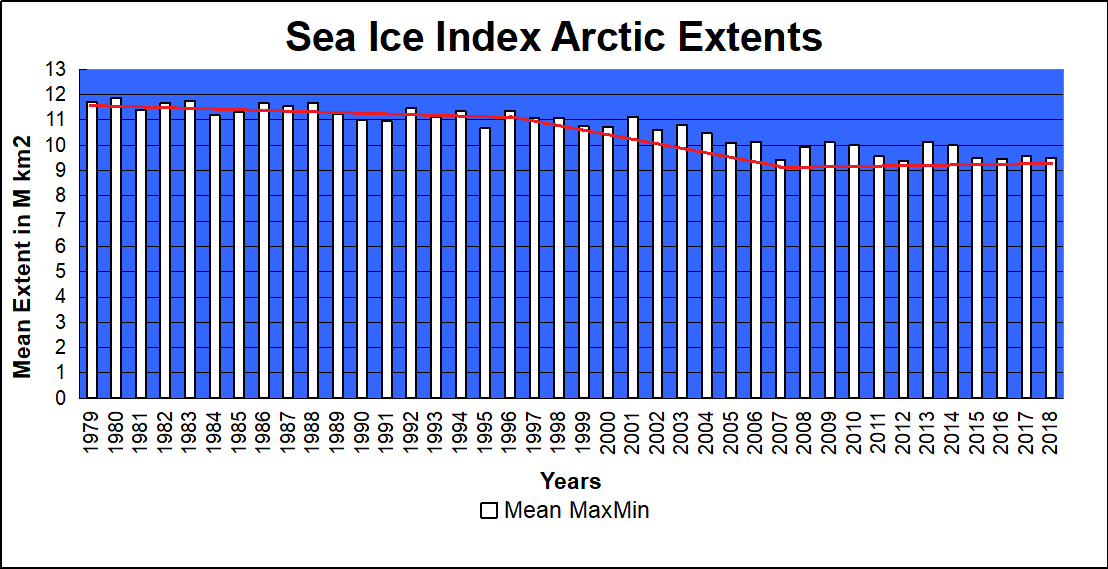
We are frequently told that only the March maximums and the September minimums matter, since the other months are only transitional between the two. So the graph above shows the mean ice extent, averaging the two months March and September.
If I were adding this to the Ice House of Mirrors, the name would be The X-Ray Ice Mirror, because it looks into the structure of the time series. For even more clarity and simplicity, here is the table:
NOAA NH Annual Average Ice Extents (in M km2). Sea Ice Index v3.0 (here)
| Year | Average | Change | Rate of Change |
| 1979 | 11.697 | ||
| 1996 | 11.353 | -0.344 | -0.020 per year |
| 2007 | 9.405 | -1.949 | -0.177 per year |
| 2018 | 9.506 | +0.102 | +0.009 per year |
The satellites involve rocket science, but this does not. There was a small loss of ice extent over the first 17 years, then a dramatic downturn for 11 years, 9 times the rate as before. That was followed by the current plateau with no further loss of ice extent. All the fuss is over that middle period, and we know what caused it. A lot of multi-year ice was flushed out through the Fram Strait, leaving behind more easily melted younger ice. The effects from that natural occurrence bottomed out in 2007.
Kwok et al say this about the Variability of Fram Strait ice flux:
The average winter area flux over the 18-year record (1978–1996) is 670,000 km2, ;7% of the area of the Arctic Ocean. The winter area flux ranges from a minimum of 450,000 km2 in 1984 to a maximum of 906,000 km2 in 1995. . .The average winter volume flux over the winters of October 1990 through May 1995 is 1745 km3 ranging from a low of 1375 km3 in the 1990 flux to a high of 2791 km3 in 1994.
https://www.researchgate.net/publication/261010602/download
Conclusion:
Some complain it is too soon to say Arctic Ice is recovering, or that 2007 is a true change point. The same people were quick to jump on a declining period after 1996 as evidence of a “Death Spiral.”
Footnote:
No one knows what will happen to Arctic ice.
Except maybe the polar bears.
And they are not talking.
Except, of course, to the admen from Coca-Cola


Reblogged this on Climate Collections.
LikeLike
Reblogged this on Climate- Science.
LikeLike
What is quite clear is that there little chance of an ice free Arctic in the foreseeable future.
The problem here is the myopic purported scientists hell bent on chasing their grants.
Statistics and computers are no substitute for rational thought; but can be helpful, as a tool, if used wisely and honestly.
LikeLike