Forget IPCC: Energy Industry Cuts Emissions, Nations Don’t

Maj. Gen. Paul Vallely writes at Town Hall Wait…Who’s Trying to Beat Climate Change?

Well, there goes the justification for Green Socialism and Nationalizing Energy Supply. Excerpts in italics with my bolds.

The energy industry is waging war against climate change – and winning.

Last week, the Environmental Partnership, a group of oil and gas firms dedicated to cutting greenhouse gas emissions, released its first annual progress report. The results are impressive — and showcase what happens when an industry unites to further the public good.

The Environmental Partnership launched in late 2017 with 26 members. Within 12 months, it more than doubled in size to 58 members — including 32 of America’s top 40 oil and gas producers. Today, its members account for nearly half of America’s oil and natural gas production.

The group focuses on cutting emissions of methane and other greenhouse gases known as “volatile organic compounds.” Without proper monitoring and maintenance, these gases can escape from drilling rigs and pipelines and contribute to global warming.

Even before the partnership formed, firms were spending millions to reduce their carbon footprints. Methane emissions have plummeted in America’s largest energy-rich basins, even as oil and gas production has spiked.  

Production at the Appalachia Basin, which spans from Alabama to Maine, rose more than 380 percent from 2011 to 2017 — yet methane emissions dropped 70 percent. Texas’s Eagle Ford Basin, meanwhile, produced 130 percent more oil and gas, but released 65 percent less methane.  And the Permian Basin, split between Texas and New Mexico, doubled production while decreasing emissions by almost 40 percent.

But firms in the Environmental Partnership weren’t satisfied with that progress. They sought to slash emissions even further.

First, the partnership focused on updating outdated technology like high-bleed pneumatic controllers. Pneumatic controllers regulate temperature, pressure, and liquid levels at natural gas sites by opening or closing valves. To operate these valves, the controllers rely on pressurized natural gas. As their name suggests, high-bleed pneumatic controllers can release relatively large amounts of natural gas, along with methane and VOC byproducts, into the air.  

The Environmental Partnership plans to replace all high-bleed pneumatic controllers in five years. And it’s well on its way to doing so. It replaced, retrofitted, or removed more than 28,000 prior to 2018 and an additional 3,000 last year. As a result, nearly 40 participating firms don’t use high-bleed controllers at all.

Second, the partnership set out to curb methane leaks – which can sometimes happen as firms extract, store, and burn natural gas. Methane is both a potent greenhouse gas and the main ingredient in natural gas. Participating companies conducted more than 156,000 surveys across 78,000 production sites, inspecting more than 56 million individual parts.

After its thorough inspections and repairs, the Environmental Partnership found that just 0.16 percent of industry parts contained leaks — and member firms repaired 99 percent of those in 60 days or less.
Participating firms also worked to better monitor liquid removal from natural gas wells. When too much liquid, mostly consisting of water, builds up within gas wells, firms manually direct the liquid to vents that bring it to surface. During that process, methane or volatile organic compounds can potentially escape into the atmosphere.

Over the course of 2018, the Environmental Partnership oversaw more than 130,000 manual removals to ensure environmentally safe execution.

In addition to these three initiatives, the Environmental Partnership held numerous conferences and workshops across the country to share best practices and new technologies. These conferences featured energy experts, regulators, and academics.

These meetings amount to more than feel-good powwows. The Environmental Partnership has spurred America’s largest energy producers to take a good, hard look at their operations, pinpoint the need for critical changes, and execute those reforms.

Methane emissions from natural gas systems fell over 14 percent between 1990 and 2017. The Environmental Partnership’s initiatives will undoubtedly cut these emissions even further. According to the EPA’s own estimates, reducing methane leaks and replacing high-bleed controllers can slash emissions by 40 and 60 percent, respectively.

Energy firms are weaponizing their data and tools for the common good. Let’s hope they keep up the fight in the war against climate change.

Paul E. Vallely is a retired U.S. Army major general who serves as a senior military analyst for Fox News. Gen. Vallely is the founder and chairman of Stand Up America, a public policy research organization committed to national security and energy independence.


July Land and Sea Temps Cooler After June Bump

banner-blog

With apologies to Paul Revere, this post is on the lookout for cooler weather with an eye on both the Land and the Sea.  UAH has updated their tlt (temperatures in lower troposphere) dataset for July.  Previously I have done posts on their reading of ocean air temps as a prelude to updated records from HADSST3. This month also has a separate graph of land air temps because the comparisons and contrasts are interesting as we contemplate possible cooling in coming months and years.

Presently sea surface temperatures (SST) are the best available indicator of heat content gained or lost from earth’s climate system.  Enthalpy is the thermodynamic term for total heat content in a system, and humidity differences in air parcels affect enthalpy.  Measuring water temperature directly avoids distorted impressions from air measurements.  In addition, ocean covers 71% of the planet surface and thus dominates surface temperature estimates.  Eventually we will likely have reliable means of recording water temperatures at depth.

Recently, Dr. Ole Humlum reported from his research that air temperatures lag 2-3 months behind changes in SST.  He also observed that changes in CO2 atmospheric concentrations lag behind SST by 11-12 months.  This latter point is addressed in a previous post Who to Blame for Rising CO2?

After a technical enhancement to HadSST3 delayed March and April updates, May was posted early in June, hopefully a signal the future months will also appear more promptly.  For comparison we can look at lower troposphere temperatures (TLT) from UAHv6 which are now posted for July. The temperature record is derived from microwave sounding units (MSU) on board satellites like the one pictured above. Recently there was a change in UAH processing of satellite drift corrections, including dropping one platform which can no longer be corrected. The graphs below are taken from the new and current dataset.

The UAH dataset includes temperature results for air above the oceans, and thus should be most comparable to the SSTs. There is the additional feature that ocean air temps avoid Urban Heat Islands (UHI).  The graph below shows monthly anomalies for ocean temps since January 2015.

June ocean air temps rose in all regions after May’s drop, resulting in the Global average back up matching June 2017.  Now in July all regions dropped back down to May levels.  The temps this July are warmer than 2018 and similar to 07/2017, and of course lower than 2016.  What’s different now is how synchronized are all the ocean regions.

Land Air Temperatures Tracking Downward in Seesaw Pattern

We sometimes overlook that in climate temperature records, while the oceans are measured directly with SSTs, land temps are measured only indirectly.  The land temperature records at surface stations record air temps at 2 meters above ground.  UAH gives tlt anomalies for air over land separately from ocean air temps.  The graph updated for July is below.

Here we have freash evidence of the greater volatility of the Land temperatures, along with an extraordincary departure by SH land.  Despite the small amount of SH land, it rose so sharply it pulled the global average upward against cooling elsewhere.  Note also that any SH warming in July means a milder winter in those places, especially Australia.  The overall pattern shows global land temps follow NH temps.  Note how much lower are NH land temps now compared to peaks over previous years.

The longer term picture from UAH is a return to the mean for the period starting with 1995:

TLTs include mixing above the oceans and probably some influence from nearby more volatile land temps.  Clearly NH and Global land temps have been dropping in a seesaw pattern, now more than 1C lower than the peak in 2016.  TLT measures started the recent cooling later than SSTs from HadSST3, but are now showing the same pattern.  It seems obvious that despite the three El Ninos, their warming has not persisted, and without them it would probably have cooled since 1995.  Of course, the future has not yet been written.

Today’s Arctic Ice Precedented 150 years Ago

This map from the Canadian Ice Service shows sea ice conditions in the western part of High Arctic islands on Sept. 8, 2018. The dark blue shows a low concentration (less than 10 per cent) of ice, while white shows a high concentration (100 per cent). At this time of the year, the Arctic ice cover is the highest it has been since 2014, the National Snow and Ice Data Center said Sept. 5.

The usual alarms are sounding again this summer to celebrate the annual melting of Arctic Sea Ice prior to refreezing again. Science Daily claims:

A new study provides a 110-year record of the total volume of Arctic sea ice, using early US ships’ voyages to verify the earlier part of the record. The current sea ice volume and rate of loss are unprecedented in the 110-year record.

Had they been willing to go a little further back in time they could have confirmed what others previously concluded from the same sources.

Researchers found that ice conditions in the 19th century were remarkably similar to today’s, observations falling within normal variability. The study is Accounts from 19th-century Canadian Arctic Explorers’ Logs Reflect Present Climate Conditions (here) by James E. Overland, Pacific Marine Environmental Laboratory/NOAA, Seattle,Wash., and Kevin Wood, Arctic Research Office/NOAA, Silver Spring, Md.   H/t GWPF Excerpts in italics with my bolds.

Overview

This article demonstrates the use of historical instrument and descriptive records to assess the hypothesis that environmental conditions observed by 19th-century explorers in the Canadian archipelago were consistent with a Little Ice Age as evident in proxy records.  We find little evidence for extreme cold conditions.

It is clear that the first-hand observations of 19th-century explorers are not consistent with the hypothesized severe conditions of a multi-decadal Little Ice Age. Explorers encountered both warm and cool seasons, and generally typical ice conditions, in comparison to 20th-century norms.

Analysis

There were more than seventy expeditions or scientific enterprises of various types dispatched to the Canadian Arctic in the period between 1818 and 1910. From this number, we analyzed 44 original scientific reports and related narratives; many from expeditions spanning several years. The majority of the data come from large naval expeditions that wintered over in the Arctic and had the capacity to support an intensive scientific effort. A table listing the expeditions and data types is located at http://www.pmel.noaa.gov/arctic/history.  The data cover about one-third of the possible number of years depending on data type, and every decade is represented.

Our analysis focuses on four indicators of climatic change: summer sea ice extent, annual sea ice thickness, monthly mean temperature, and the onset of melt and freeze as estimated from daily mean temperature. Historical observations in these four categories were compared with modern reference data; the reference period varied, depending on data availability.  Both sea ice extent and the onset of melt and freeze were compared to the 30- year reference period 1971–2000; monthly means are compared to the 50-year period 1951–2000. Modern sea ice thickness records are less continuous, and some terminate in the 1980s; the reference period is therefore based on 19 to 26 years of homogeneous record.

arctic-explorers-fig1

Fig.1.

(a) Proxy record of standardized summer air temperature variation derived from ice cores taken on Devon Island. This proxy record suggests that a significantly colder climate prevailed in the 19th century. Shading indicates temperatures one standard deviation warmer or colder than average for the reference period 1901–1960 [Overpeck,1998].

(b) Historical monthly mean temperature observations compared to the 20th-century reference period 1951–2000. Sixty-three percent of 343 monthly mean temperatures recorded on 19th-century expeditions between 1819 and 1854 fall within one standard deviation of the reference mean at nearby stations (reference data from Meteorological Service of Canada,2002; and National Climatic Data Center,2002).

(c) Onset of melt observed by expeditions between 1820 and 1906 expressed as departures from the mean for the reference period 1971–2000. The period of melt transition observed by 19th century explorers is not inconsistent with modern values.

(d) Onset of freeze observed between 1819 and 1905 compared to the reference period 1971–2000. The onset of freeze transition is frequently consistent with modern values,but in some cases occurred earlier than usual. The incidence of an early onset of freeze represents the largest departure from present conditions evident in the historical records examined in this study. Melt and freeze transition dates for the reference period 1971–2000 were calculated from temperature data extracted from the Global Daily Climatology Network data base (National Climate Data Center, 2002).

arctic-explorers-fig2

Fig.2. The ship tracks and winter-over locations of Arctic discovery expeditions from 1818 to 1859 are surprisingly consistent with present sea ice climatology (contours represented by shades of blue). The climatology shown reflects percent frequency of sea ice presence on 10 September which is the usual date of annual ice minimum for the reference period 1971–2000 (Canadian Ice Service,2002). On a number of occasions,expeditions came within 150 km of completing the Northwest Passage, but even in years with unfavorable ice conditions, most ships were still able to reach comparatively advanced positions within the Canadian archipelago. By 1859, all possible routes comprising the Northwest Passage had been discovered.

Summary

As stated here before, Arctic ice is part of a self-oscillating system with extents expanding and retreating according to processes internal to the ocean-ice-atmosphere components. We don’t know exactly why 19th century ice extent was less than previously or less than the 1970s, but we can be sure it wasn’t due to fossil fuel emissions.

arctic-explorers-fig3rev

Explorers encountered both favorable and unfavorable ice conditions. This drawing from the vicinity of Beechey Island illustrates the situation of the H.M.S.Resolute and the steam-tender Pioneer on 5 September 1850 [from Facsimile of the Illustrated Arctic News,courtesy of Elmer E.Rasmuson Library,Univ.of AlaskaFairbanks].

Update: At Last A Climate Policy with Teeth

Update August 7 2019:

Tired of all the tokenism in proposals to “fight climate change”?  Like this one from Singapore today: Want to do more to fight climate change? Cut down on driving, buying stuff and eating meat
Or What will it take to kick Singapore’s growing multimillion-dollar addiction to bottled water?

Once again the UK is at the forefront showing how to get serious in fighting climate change. Euan Mearns has the story UK Government to Announce New Energy Policies Excerpts in italics with my bolds.

Amidst Brexit chaos, the Prime Minister will today introduce a white paper to Parliament detailing the Government’s new energy strategy. Stunned by criticism that she has failed to listen, the new policies will take full cognisance of the concerns recently raised by striking school children. The new policy has 4 main strands. The Downing Street press release is below the fold.

[BEGINS] In view of the grave concerns raised by 5 to 17 year old children on the impact of CO2 on Earth’s climate, Her Majesty’s government will today introduce legislation that will address the most pressing issue of our times, namely CO2 emissions and the ensuing climate mayhem that they cause (Exhibit 1, Appendix 1). CO2 has risen to record levels from 0.0280% (pre-industrial) to 0.0405% today (see endnote 1). The new energy policy has four main strands:

1. Adult only flights

As of 1 January 2020 juveniles below the age of 18 will no longer be allowed to fly on commercial flights within the UK and between the UK and foreign destinations. A reciprocal arrangement will apply to incoming flights that will not be allowed to land on British soil if there are juveniles on board. The government appreciates this will have a major impact on family holidays and tourism. But that is the policy goal. We can no longer countenance families flying all over the place simply for the sake of seeking some sunshine. Tourism is one of the most useless and resource wasteful activities known to Mankind. What is the point in wrecking Earth’s climate to go and gaze at the Eiffel Tower or to go visit Euro Disney when an equally enjoyable time can be had at our home grown attractions of the Blackpool Tower and Center Parcs (Figures 1 and 2).

The government appreciates this is going to have a catastrophic impact on the airline and airport industries. That is the whole point of the policy. We can longer countenance giving shelter to evil polluting companies on these islands. The UK will press our allies throughout the OECD to follow suit. Given time this should also have a catastrophic impact on the airliner manufacturing sectors where we expect Rolls Royce (engines) and BAE systems (wings) to be hardest hit. We point to the troubled Jaguar Landrover, caused by government policy, as a shining example of government aptitude at wrecking British industry.

2. An end to North Sea Ferries

The government is often accused of lacking foresight and we wish to stress that we are smart enough to recognise that selfish polluting families may simply try to avoid the adult only flight policy by using car ferries instead. The government sees no way of tackling this problem other than to close down all ferry services between the UK and mainland Europe, the Island of Ireland and all other destinations. Car ferries travelling between Scottish Islands comes under the jurisdiction of the Scottish Parliament.

The activity of transporting a two tonne SUV on board a ship running on filthy dirty bunker fuel needs to be consigned to history. The idea of families boarding a ship to simply drive around Europe looking at stuff, while wrecking Earth’s climate, needs to be stopped.

The government is aware that these policies may seem to be anti-tourism. Nothing could be further from the truth. We remain committed to a robust, albeit crippled, tourist industry. British children will simply need to learn how to enjoy beach holidays at home (Figure 3). And to prove this point, children will still be allowed to travel to Europe on all electric Eurostar trains. And really rich families will even be allowed to take cars with them, so long as they are all-electric vehicles.

3. An end to driving to School

With immediate effect, the UK Government is to introduce a ban on children being driven to school by their parents in petrol or diesel cars. We will continue to allow children of very wealthy families to be driven to school in all-electric vehicles. Hybrid plugin electric vehicles will not face an immediate ban but will be phased out over three years.

To enforce this ban children will be encouraged to spy on their friends (or enemies) by taking pictures of children covertly being dropped off just around the corner and sharing these images on social media. This should create a deterrent to illegal child dropping.

4. Phasing out of gas or oil heating systems in schools

In keeping with the recently announced policy of the Dutch Government to phase out natural gas all together and the allied UK policy of ceasing to build homes with gas central heating, the government will bring forward a bill to phase out gas or oil heating systems in all our schools by 2022. Schools will instead by obliged to install all-electric heating that runs exclusively on in-situ, off-grid, renewable energy systems. Using the latest SMART technology it is anticipated that this should be simple and straightforward to achieve.

Here’s the clever part. Children of all ages (5 to 17) will be allowed to participate in designing these SMART heating systems. The Government does not have spare funds to support this initiative so schools will have to pay for it out of existing budgets. However, since renewable energy prices have tumbled, paying for this should not be a problem. If schools struggle to meet this bill, they will be encouraged to either lay-off staff or ask parents to pay for this vital flagship policy. [ENDS]

Thank you Euan.  There is no fool like a Climate Fool today or all year round.

Economics #1 Law vs. Politics #1 Law

Dan Sanchez writes at Real Clear Markets ‘Free Everything’ and Thomas Sowell’s First Law of Politics. Excerpts in italics with my bolds.

The other night, a politician criticized Bernie Sanders and Elizabeth Warren for offering voters “free everything and impossible promises.” Remarkably, the critique came, not from a Republican fiscal conservative, but from a fellow Democrat during a primary debate. John Delaney, a former congressman from Maryland, said such policies were based on “fairy-tale economics.”

As economist Thomas Sowell wrote, “The first lesson of economics is scarcity: there is never enough of anything to fully satisfy all those who want it. The first lesson of politics is to disregard the first lesson of economics.”

So it was surprising to see a presidential candidate give a nod to the first lesson of economics and lay off the first lesson of politics for a moment.

The word “free” slips freely from the lips of Sanders and Warren: free health care (“Medicare for All”) and free college are two of their most popular promises. But in a sense, something is only “free” when it is not scarce: when there is so much of it to go around that Group A can use it as much as they want without diminishing Group B’s ability to do the same. Economists call that “superabundance.” In most cases, air is “free.” My intake of oxygen doesn’t meaningfully deprive anyone else of anything.

Health care and education are not “free” in that sense. Pills and pencils, surgeries and lectures, are scarce. The same pill can’t be swallowed by two people. And the material and labor that go into producing those things are also scarce. Resources cannot be endlessly lavished on one area without making other uses of those resources impossible. To think otherwise would indeed be “fairy-tale economics.”

When scarcity is a factor, “how can we afford this?” is a key question, and “we can’t” is a possible answer.

But to a politician like Elizabeth Warren, such an answer is unacceptable, even baffling. When the debate moderator asked Warren to respond to Delaney’s critique, she said (emphasis added):

“I don’t understand why anybody goes to all the trouble of running for president of the United States just to talk about what we really can’t do and shouldn’t fight for. I don’t get it.”

She doesn’t get it because she’s following Sowell’s first law of politics. Disregarding scarcity is simply best practice in her profession. Scarcity may limit what you can deliver on, but it doesn’t limit what you can offer. And voters have a poor track record on holding politicians accountable to their promises. So if you’re running to win, it often pays to out-promise your competitors, even if that means veering into fairy-tale territory. Letting pesky realities like scarcity get in the way of that can be political suicide, as I’m guessing Delaney will find out soon.

To be fair, the same individuals who tend to be gullible as voters are typically savvy as customers. When they are let down by a business, they readily take their money elsewhere. That is how they hold entrepreneurs accountable. That is why entrepreneurs are concerned, not just with promises, but with delivery. And that is why entrepreneurs abide by Sowell’s first law of economics: why they take scarcity seriously.

Because customers hold them accountable, entrepreneurs also do a much better job than politicians at alleviating scarcity through efficient, value-creating production. Entrepreneurial projects do fail, but then they go away when their customers do, clearing the stage for something better.

Since government projects are financed by involuntary “customers” (taxpayers), they are ultimately unaccountable and “free” to fail indefinitely.

That is why entrepreneurs give us goods and services that are amazing and yet widely affordable (even “free” to the user, when ad-supported), while politicians give us programs that are “free” but perpetually struggling and unsatisfactory.

For example, in the realm of education, think about how much learning happens on YouTube and through podcasts these days: and how much those platforms have grown and progressed as educational resources in just a few years. Compare that to the decades of frustrated attempts to reform public schools.

And in health care, contrast the customer service of walk-in health clinics at CVS and Walgreens versus the Veterans Administration.

Keep these track records in mind when politicians promise vast expansions of “free” education and health care. These sectors are indeed crying out for reform. But count on accountable entrepreneurs, not unaccountable politicians, to deliver.

Dan Sanchez is the Director of Content at the Foundation for Economic Education (FEE) and the editor-in-chief of FEE.org. He co-hosts the weekly web show FEEcast, serving as the resident “explainer.”

Legal Calamity: Climate Nuisance Lawsuits

I am suing you

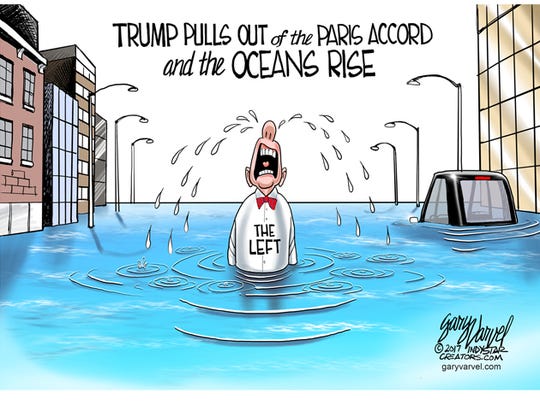
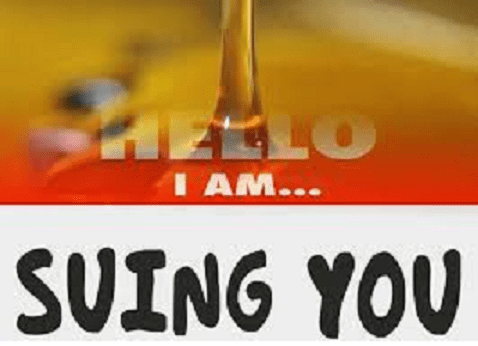
It has come to this:  Sue anyone doing anything you don’t like for profit as a “Public Nuisance.”  Further on is reprinted a previous post explaining why it is legally wrongheaded to claim damages against purveyors of fossil fuels because of global warming/climate change.  What is news today is a federal judge making exactly that mistake.

Michael I. Krauss writes at Forbes Federal Judge Allows Misuse Of Public Nuisance Doctrine. Excerpts in italics with my bolds.

I have written, in this column and elsewhere, about the threat to the Rule of Law created by the misuse and abuse of Public Nuisance doctrine. Now I write to bemoan a federal judge’s tolerance of a particularly egregious effort by a state to invoke this ancient tort (typically used to sanction those who blocked the public roads) to judicially create legislative policy.

In State of Rhode Island v Chevron Corp. et al, [decided July 22, 2019], Chief Judge William Smith of the United States District Court in Rhode Island (appointed by President Bush) was presented with a suit launched by the Ocean State against energy companies it says are “partly responsible for our once and future climate crisis.” Rhode Island isn’t claiming that Defendants broke its laws, but that its behavior is “greedy” and suboptimal for the future of the Rhode Island. Of course the same might be said about Rhode Island farmers (who “greedily” raise beef for profit, and contribute methane to the environment) and about Rhode Island car dealers (who “greedily” market expellers of CO2), but I digress.

It is true that, eleven years ago, the Rhode Island Supreme Court unanimously rejected a similar public nuisance suit by the state against three former manufacturers of lead paint. That suit, the court held in 2008, represented an abuse of the public nuisance doctrine. But of course, that was eleven years ago. Times (and the judicial composition of many state courts) have changed. The defendants in this petrochemicals case, understandably wary about being sued in Rhode Island courts in front of state-appointed judges, in a suit launched by the state and aiming to transfer billions into the state, removed the case to federal court on the grounds that federal issues totally pre-empted Rhode Island’s claim. In his July 22, 2019 ruling, Judge Smith decided that the case should be returned to state court and there decided under state law. Here is the remarkable language the judge used to describe what he called the “background” of Rhode Island’s lawsuit — language the judge admitted he cribbed directly from Rhode Island’s complaint!

“…Defendants in this case… have extracted, advertised, and sold a substantial percentage of the fossil fuels burned globally since the 1960s. This activity has released an immense amount of greenhouse gas into the Earth’s atmosphere, changing its climate and leading to all kinds of displacement, death (extinctions, even), and destruction. … Defendants understood the consequences of their activity decades ago, when transitioning from fossil fuels to renewable sources of energy would have saved a world of trouble. But instead of sounding the alarm, Defendants went out of their way to becloud the emerging scientific consensus and further delay changes — however existentially necessary — that would in any way interfere with their multi-billion-dollar profits.”

Judge Smith may believe that his ruling is an example of judicial restraint. But to refuse to recognize the basic constitutional structure of the country is not laudable restraint, but rather timidity. As Justice Felix Frankfurter once explained in a different context: “The easy but timid way out for a trial judge is to leave all cases … for jury determination. A timid judge, like a biased judge, is intrinsically a lawless judge.”

In a virtually identical case to Rhode Island’s, City of New York v BP et al, decided on July 18 2018, Judge John F. Keenan of the United States District Court for the Southern District of New York (appointed by President Reagan) ruled on the city’s public nuisance suit against petrochemical manufacturers:

“The Court agrees that the City’s claims are governed by federal common law…. Where “the interstate or international nature of the controversy makes it inappropriate for state law to control . . . our federal system does not permit the controversy to be resolved under state law.” [citing Banco Nacional de Cuba v. Sabbatino, 376 U.S. 398, 426 (1964)).

“To the extent that the City brings [public] nuisance and trespass claims against Defendants for domestic greenhouse gas emissions, the Clean Air Act displaces such federal common law claims under American Electric Power Co. v. Connecticut, 564 U.S. 410 (2011).

And two weeks before the New York case, United States District Court Judge William Alsup of the Northern District of California (appointed by President Clinton) used the following language in dismissing San Francisco’s and Oakland’s climate liability lawsuits against the top five investor-owned fossil fuel producers:

“With respect to balancing the social utility against the gravity of the anticipated harm, it is true that carbon dioxide released from fossil fuels has caused (and will continue to cause) global warming. But against that negative, we must weigh this positive: our industrial revolution and the development of our modern world has literally been fueled by oil and coal. Without those fuels, virtually all of our monumental progress would have been impossible. All of us have benefitted. Having reaped the benefit of that historic progress, would it really be fair to now ignore our own responsibility in the use of fossil fuels and place the blame for global warming on those who supplied what we demanded? Is it really fair, in light of those benefits, to say that the sale of fossil fuels was unreasonable?… In our industrialized and modern society, we need (and still need) oil and gas to fuel power plants, vehicles, planes, trains, ships, equipment, homes and factories.”

As Judge Alsup impliedly states, it is absurd to allow a state jury to decide questions of national and international energy policy that the Constitution has clearly left to other branches of government. Rhode Island profits enormously from the products of the very same petrochemical industry that it now claims constitutes a nuisance.

Their suit is an invitation to legislate from the bench, or perhaps from the jury room.

The District of Columbia has recently solicited bids for a contingent fee public nuisance lawsuit against petroleum companies (despite the fact that DC itself has purchased millions of gallons of fuel from these same companies). This kind of “lawfare” can only survive if rulings like that of judge Smith prevail over those of judges Keenan and Alsup. It may be time for the Supreme Court to reiterate the holding of American Electric Power Co. v. Connecticut and to end this abuse.

Is Global Warming A Public Nuisance?

Several posts have discussed activist attempts to use legal actions to press their agenda.  Now we have a fine article by Richard A. Epstein of Hoover Institution, published January 15, 2018
Is Global Warming A Public Nuisance?  
Text below in italics with my bolds and images.
H/T Jeffrey Taylor

New York City and a number of California municipalities, including San Francisco and Oakland, have filed law suits against five major oil companies—BP, Chevron, ConocoPhillips, Exxon Mobil, and Royal Dutch Shell—for contributing to the increased risk of global warming. These complaints cite recent scientific reports that project that sea levels will rise from 0.2 meters to 2.0 meters (or 0.66 to 6.6 feet) by 2100, with a major loss of land surface area and serious climate disruptions. They further allege that the “Defendants had full knowledge that the fossil fuels would cause catastrophic harm.” The complaints rely chiefly upon public nuisance law, which prohibits unreasonably interfering with public rights in air and water through discharges of dangerous substances—in this instance, carbon dioxide and other greenhouse gases. These cities are demanding that each oil company named in the complaint contribute to an abatement fund to counteract the perceived future threats to the environment from global warming.

In this essay, I confine my attention to the soundness of the public nuisance theory offered by San Francisco and New York in order to explain why private lawsuits are the wrong instrument for dealing with the global warming threat. In full disclosure, in this essay, I provide my own independent legal analysis of these complaints, which I prepared for the Manufacturer’s Accountability Project, an organization that focuses on the impact of litigation on the manufacturing industry.

The basic law of nuisance is divided into two parts, public and private, which complement each other. Private nuisances require at a minimum “an invasion of another’s interest in the private use and enjoyment of land.” The defendant must release, emit, or discharge the offensive materials—such as filth, odors, or noise—onto the plaintiff’s property. The relevant causal connection has to be so tight that there are no intervening forces between the discharge and the ensuing physical invasion of the plaintiff’s property. So, for example, the supplier of various materials and chemicals is not responsible for the waste that a manufacturer emits from their use.

The typical private nuisance dispute usually involves one party (or a very few) who either makes the discharges or suffers consequences from them. The basic intuition behind this limitation on private suits is that administrative costs balloon out of control when the number of parties who suffer some degree of harm increases, as happens when pollution is discharged into a public waterway used by hundreds of different people. Yet it is a mistake to ignore large pollution discharges simply because private law suits are an ineffective instrument to secure damages, an injunction, or both. As early as 1536, the English judges filled this gap by developing the law of public nuisances that rested, both then and now, on the key distinction between general and special damages. Thus, if the defendant erected an obstruction along a public road, none of the parties delayed by the blockage had a private right of action. But any individual who ran into the obstacle and suffered physical injuries or property damage could recover in tort. Now, the shortfall in deterrence attributable from not compensating the delayed travelers was offset by a fine against the wrongdoer, the money from which could be used to remove the obstacle or placed in the public treasury.

Woman on a ducking stool. Historical punishment for ‘common scold’ – woman considered a public nuisance. (Welsh/English heritage)

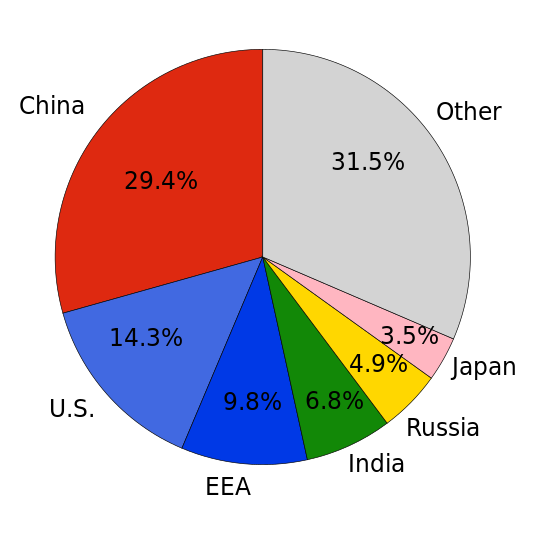
It is important to understand the enormous stretch in moving from traditional public nuisances to the modern global warming cases. The first point of difference is that only five companies—but no other carbon-dioxide-emitting polluter in the world—are joined as defendants. That is to say, the cities are apparently seeking to recover virtually all of their alleged abatement costs from the five named oil companies, instead of holding each only for its pro rata share of total emissions from all sources. But just what fraction of total carbon dioxide emissions can be traced to the named defendants? Note first that any release of carbon dioxide into the atmosphere has the same impact on global warming regardless of its source.

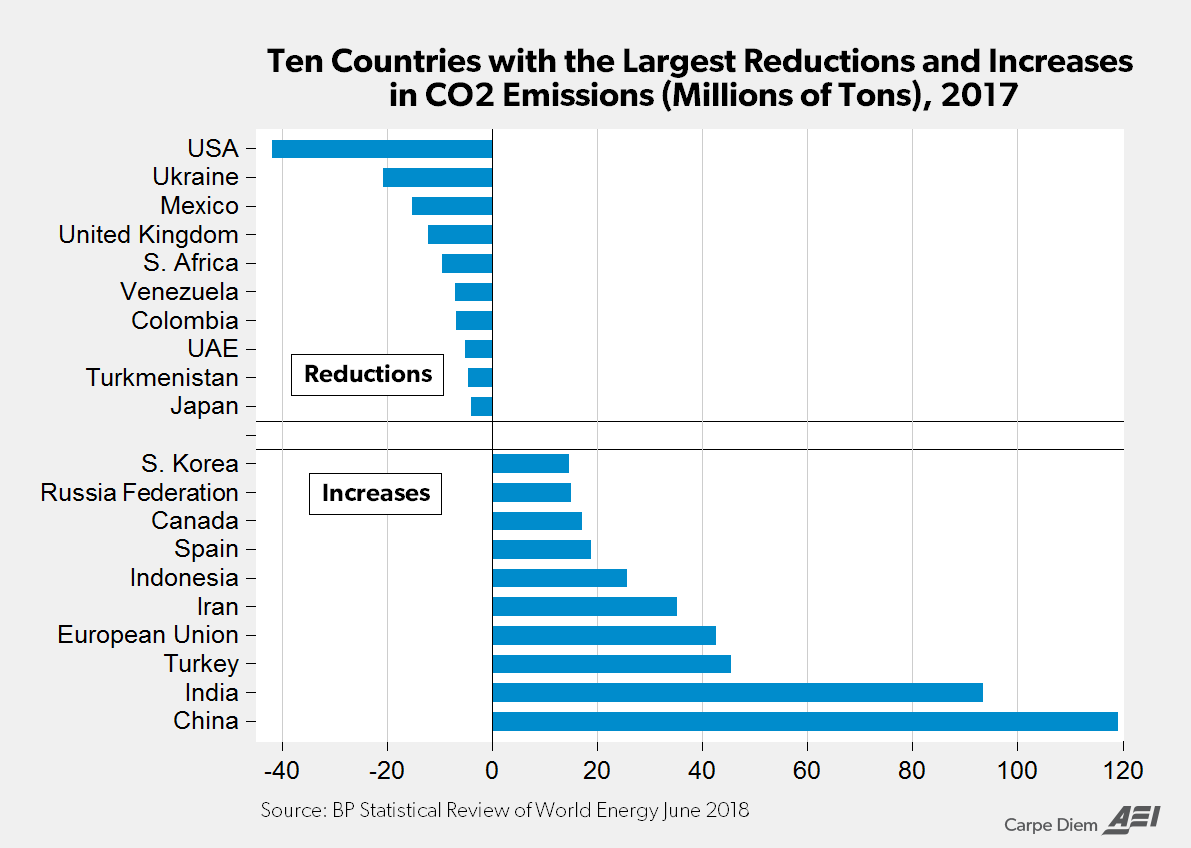
These five oil companies are responsible at most for a tiny fraction of the global total of carbon dioxide emissions. First, just looking at the American scene, some good chunk of the carbon dioxide releases are from other oil companies not named in the complaint. Another, probably larger, chunk comes from burning coal, making cement, and human and animal respiration. Carbon dioxide is also released in large quantities by forest fires, including those that recently overwhelmed Northern and Southern California. And that’s just in America; vast amounts of carbon dioxide are released from a similar range of human activities all across the globe.

Global Greenhouse Gas Emissions by Source 2013

Here are some numbers: As of 2015, all carbon dioxide emissions from the United States comprised 14.34 percent of the global total, while China’s emissions stood at 29.51 percent. Even if the five oil companies were somehow responsible for, say, 10 percent of the United States’ carbon dioxide emissions, that would be less than one percent of the total human releases. Under standard tort rules, the liability of each defendant must be limited to its own pro rata share of the total harm given that under Section 433A of the Restatement of Torts, there is a “reasonable basis for determining the contribution of each cause to a single harm,” in this instance measured by market shares.
Indeed, these public nuisance lawsuits are especially dubious, given that the oil companies did not by their sales emit any carbon dioxide into the atmosphere. The dangerous releases came from many different parties, both private and public, including the municipalities bringing these lawsuits. These numerous parties used these products in countless different ways, with as much knowledge of their asserted effects on global warming as these five defendants. How could the oil companies have known about the anticipated course of global warming forty years ago when key government studies done today are uncertain about the magnitude of the effects of emissions on sea levels and the economic consequences?

The first paragraph of the New York City complaint ducks these factual complexities by insisting, falsely, that crude oil was “a product causing severe harm when used exactly as intended.” But the end uses of crude oil are so varied (including, for example, the creation of various plastics in common use today) that the effective control of emissions is best done through the regulation of these end users and not the oil companies. Indeed, even for gasoline, the level of carbon dioxide emissions critically depends on the operation and maintenance of the many different types of facilities, equipment, and vehicles, all of which are beyond the direct control of the oil companies. Yet all these end users are already subject to extensive emissions controls under the Clean Air Act and countless other environmental directives, both at the state and federal level.

This sensible distribution of regulatory authority rests on the superior ability of government agencies (at least compared to the courts), often in cooperation with each other, to formulate and maintain coherent policies to regulate the emissions of carbon dioxide, as well as methane, nitrous oxide, and fluorinated gases, which the EPA calculates account for 18 percent of greenhouse gas emissions.

The issues here are especially complex for many technical and logistical reasons. One critical task is to decide the optimal level of emissions. The implicit assumption of the New York and San Francisco lawsuits is that the world would become a better place if all emissions of carbon dioxide were stopped. But that position ignores the enormous benefits that come from the use of fossil fuels, which continue to supply over 80 percent of the nation’s energy needs. No other fuel source could keep manufacturing, transportation, and commerce alive. And it is just exaggeration to claim, as the city plaintiffs do, that these oil companies “have done nearly all they could to create [the] existential threat” of global warming when in fact energy efficiency in the United States has consistently improved, particularly in generating electrical power.

No public nuisance suits for global warming can solve a problem that must be addressed by a coherent regulatory program. Instead, chaos will follow if hundreds of different states, counties, and cities are allowed to bring separate actions under state law. It bears emphasis that in 2011, a unanimous Supreme Court decision in American Electric Power Co. v. Connecticut held that the combination of the Clean Air Act and actions by the Environmental Protection Agency “against carbon-dioxide emitters . . . displace the claims that the plaintiffs seek to pursue” under a public nuisance theory brought under federal law. The Court left open the question of whether the federal regulation at the time preempted any state law cause of action for public nuisance.

Summary

But, as I argued at the time, the only viable solution was for the federal government and the EPA to “orchestrate” the effort to control emissions. The point is doubly true against these remote, upstream defendants who have not emitted anything themselves. The standard analysis of federal preemption has long held that states may not engage in their own remedial efforts, even by actions in tort, when extensive federal regulation occupies the field, or when state activity either frustrates federal action or is in conflict with it. If anything, the scope of federal oversight, actual and prospective, is far more comprehensive than it was when American Electric Power was decided. And so federal preemption alone should block a set of dubious public nuisance claims that should never have been brought in the first place.

Background:  Critical Climate Intelligence for Jurists (and others)

Canadian Arctic Last 3 Weeks

The image shows that most of the Arctic ice lost in the last 3 weeks disappeared from the two Canadian Bays: Hudson and Baffin.  Hudson lost 400k km2 from 535k km2 down to 123k km2.  Baffin lost 300k km2 from 375k km2 down to 67k km2.

The melting season in July up to yesterday shows 2019 moving toward the 12 year average.

Presently 2019 ice extent according to MASIE is about 500k km2 below the 12 year average, having been 800k km2 in deficit just 5 days ago. The pace in recent days has flattened in comparison to the average, and is now matching 2007.  SII started to diverge about the same time and is now 400k km2 lower than MASIE.

The Bigger Picture (from Previous Post)

We are about 46 days away from the annual Arctic ice extent minimum, which typically occurs on or about day 260 (mid September). Some take any year’s slightly lower minimum as proof that Arctic ice is dying, but the image below shows the third week in July  over the last 11 years. The Arctic heart is beating clear and strong.

Open image in new tab to enlarge.

These are weekly ice charts from AARI in St. Petersburg.  The legend says the brown area is 7/10 to 10/10 ice concentration, while green areas are 1/10 to 6/10 ice covered. North American arctic areas are not analyzed in these images.

Over this decade, the Arctic ice minimum has not declined, but since 2007 looks like fluctuations around a plateau. By mid-September, all the peripheral seas have turned to water, and the residual ice shows up in a few places. The table below indicates where we can expect to find ice this next September. Numbers are area units of Mkm2 (millions of square kilometers).

Day 260 12 yr
Arctic Regions 2007 2010 2012 2014 2015 2016 2017 2018 Average
Central Arctic Sea 2.67 3.16 2.64 2.98 2.93 2.92 3.07 2.91 2.93
BCE 0.5 1.08 0.31 1.38 0.89 0.52 0.84 1.16 0.89
LKB 0.29 0.24 0.02 0.19 0.05 0.28 0.26 0.02 0.16
Greenland & CAA 0.56 0.41 0.41 0.55 0.46 0.45 0.52 0.41 0.46
B&H Bays 0.03 0.03 0.02 0.02 0.1 0.03 0.07 0.05 0.03
NH Total 4.05 4.91 3.4 5.13 4.44 4.2 4.76 4.56 4.48

The table includes three early years of note along with the last 5 years compared to the 12 year average for five contiguous arctic regions. BCE (Beaufort, Chukchi and East Siberian) on the Asian side are quite variable as the largest source of ice other than the Central Arctic itself.   Greenland Sea and CAA (Canadian Arctic Archipelago) together hold almost 0.5M km2 of ice at annual minimum, fairly consistently.   LKB are the European seas of Laptev, Kara and Barents, a smaller source of ice, but a difference maker some years, as Laptev was in 2016.  Baffin and Hudson Bays are almost inconsequential as of day 260.

For context, note that the average maximum has been 15M, so on average the extent shrinks to 30% of the March high before growing back the following winter.

Untrustworthy Enivronmental Science

Of Republicans with high levels of science knowledge, less than half trust environmental scientists.ELENA LACEY; GETTY IMAGES

Adam Rogers writes at WIRED Americans Trust Scientists Until Politics Gets in the Way.  Excerpts in italics with my bolds

Nothing’s more American than a science-hero—an indomitable, big-brained hasher-out of ideas that change the world, that make the impossible possible. At least since Ben Franklin sat with the founders, and certainly since Vannevar Bush explicitly connected the US’ future to federal funding of science after World War II, the idea of sciencing the shit out of everything has been core to the American character. Like many surveys and studies before it, a new report from the Pew Research Center confirms this truth: Americans love and trust scientists. In 2019, 86 percent of Americans said they had a great deal or a fair amount of confidence in them—up 3 percent from the year before.

That’s higher than confidence in the military (82 percent), or even in public school principals (80 percent)! It’s even higher than, can you believe it, the news media (47 percent, ahem) or elected officials (35 percent).

Except, like the polling nerds say, you have to check the cross-tabs—the particulars of who answered what question, and how. This particular survey compared trust in specific types of scientists. Specifically, it covered dietitians and nutrition scientists, clinicians and biomedical researchers, and (here we go) environmental health specialists and environmental scientists. In other words: nutrition, doctors, and climate change.

And then the pollsters asked for the respondents’ political affiliations. Which: Uh oh.

Of Democrats with high levels of science knowledge (which turns out to be a thing you can pop-quiz for), just about nine out of 10 people trust environmental scientists. Of Republicans with high levels of science knowledge? Less than half. “We often see that public attitudes around climate, energy, and environmental issues are strongly correlated with party ideology, where other kinds of science issues are not,” says Cary Funk, a social scientist and lead author of the new study. This is called “motivated reasoning,” Funk says. “The idea is that your partisan identity kind of trumps the role of knowledge in your beliefs.”

It’s an outcome familiar to climate communication researchers. The Yale Program on Climate Change Communication, for example, has found rising belief among Republicans that climate change is human-caused and policy steps should be taken to combat it, but that program’s research still consistently finds a party disparity. “We’re starting to see the signal appear out of the noise and say, yeah, my direct experience reflects climate change,” Anthony Leiserowitz, the Yale program director, told me late last year. “But that’s still a small influence compared to the dominant factor, which is politics.”

Put aside Evangelicals, who often vote Republican and stereotypically express skepticism in a range of scientific conclusions. The people in the Pew study, by and large, accept the conclusions of medicine, of basic physics, of organic chemistry. But even though the methods and philosophies that produced those conclusions are the exact same methods and approaches climate scientists use, if you’re a Republican, odds are you don’t buy it.

Other research, from Pew and elsewhere, has found divides in the amount of trust people have in scientists who study other fields with policy valances, such as genetically modified foods or vaccines. But those divides don’t fall along party lines. It’s just climate.

Why? What powers this motivated cognition? It’s one thing to believe that which confirms your priors, but how do people acquire priors for climate science? At a time when “climate science” means everything from wildfires to emerging diseases to mass migration, how do people still see it as merely an environmental issue?

[Comment:  The author seems oblivious to the history of progressively more extreme environmental scares, trumpeted in the media, then later dropped in favor of a new and different one.  Bernie Lewin’s book provides the story of how each one was promoted taking the public in, and adding to the erosion of confidence.  The sequence of expanding scares was:
Synopsis of the environmental scare history (lest we forget) is at Progressively Scaring the World ]

Some researchers blame the 1970s. See, before then, most of the science that Americans so loved was, in one terminology, “production science.” Even the basic, research work led to cool new stuff, which could become salable new products. Corporations love that. But with the rise of modern environmentalism in the middle and late 20th century came “impact science” that looked at the harms of those industrial-era products—asbestos, DDT, dioxins, chlorofluorocarbons, nuclear waste, and more recently greenhouse gases and plastics. “Environmentalism and the conservation movement take off really at about the same time, the 1970s … but originally those think tanks didn’t pay too much attention to environmentalism,” says Riley Dunlap, an emeritus sociologist at Oklahoma State University.

Thomas Edison in his Menlo Park Lab.

Then, just as international environmentalism started to peak in the early 1990s, the Soviet Union fell apart. Conservatism lost its Big Bad. “We think the conservative movement really substituted a Green Scare for the declining Red Scare,” Dunlap says. The party’s funders turned to fighting the regulatory apparatus that would come with more environmentally sensitive policies.

To Dunlap and others, that’s why Republicans scoff at climate science while embracing, say, particle physics. “They haven’t heard Rush Limbaugh or Sean Hannity talking about physics,” Dunlap says. “But they’ve had a constant barrage saying global warming is the mother of all environmental issues, the one with the most dire consequences, and in the eyes of the conservatives, the most serious consequences for regulations.”

[Note: The author is also unaware of how alarmists reduce away the complexity of climate science down to their simple pre-determined assertion: Humans are making the world dangerously warmer. Explanation is at Climate Reductionism
That’s why those cross-tabs keep showing the Republicans think climate science is a grift. They mostly trust nutrition science, even though in reality lots of nutrition science (and certainly the mass media coverage of it) is, according to at least one high-powered science watchdog, in need of radical reform. They mostly trust physicians, even though study after study shows that attention and gifts from pharmaceutical reps have a profound influence on what drugs physicians prescribe. These folks aren’t as infallible as we all might hope.

In fact, call me cynical, but I was actually heartened by some of the parts of the Pew study that suggested broad-based skepticism.

“Overall views of scientists are generally positive, but it tends to be a soft support,” Funk says. “It tends to be lower when it comes to counting on scientists to do their job well, on working in the public interest. And then you see the low degree or widespread skepticism around issues of scientific integrity.” Only about one in five Americans thought scientists were as up front about their own conflicts of interest as they should be. And 71 percent of African American respondents, and 63 percent of Latinx respondents, reported professional or research misconduct as a moderately or very big problem. That was higher than what white people said by 20 points and seems worth following up given the scientific establishment’s frankly crummy history with minorities in research.

On a more positive front, people reported trusting scientists more when the data they used was more open—a major goal of the open science and reproducibility movements. Good science works on fixing science.

More Republicans than Democrats thought that scientists’ policy decisions are no better than anyone else’s and that scientists are just as likely to be biased as non-scientists. The thing is, that’s true.

Scientists are human beings. The practice of science, though, remains the single best way for humans to acquire information about how the universe actually works, and then to act on it. If it’s the case that a well-funded conservative movement found a way to convince people that climate change—the single biggest existential threat humanity faces—simply wasn’t happening, they could do it again. The same thing could work with telling people that vaccines violate their personal autonomy or that environmental protections are too stringent.

The cautionary tale here isn’t about petrochemical donors to Republicans enhancing the motivated cognition of their base. It’s about how little Americans know about how science is actually supposed to work as a practice. If they did, they’d make the connection between the broad, informed skepticism that in fact drives science to improve, to continually reach toward the fundamental truths that allow deeper understanding and, candidly, cooler stuff—across every subfield. Those are the results that lead to better policy for everyone instead of higher profits for a few.

See also: Eco Footprint Nonsense


Update: The LIA Warming Rebound Is Over

Figure 1. Graph showing the number of volcanoes reported to have been active each year since 1800 CE. Total number of volcanoes with reported eruptions per year (thin upper black line) and 10-year running mean of same data (thick upper red line). Lower lines show only the annual number of volcanoes producing large eruptions (>= 0.1 km3 of tephra or magma) and scale is enlarged on the right axis; thick red lower line again shows 10-year running mean. Global Volcanism Project Discussion

Update August 2, 2019

University of Bern confirms in a recent announcement that volcanoes triggered the depths of the LIA (Little Ice Age).  Their article is Volcanoes shaped the climate before humankind. H/T GWPF.  However, they spin the story in support of climate alarm (emergency, whatever), rather than making the more obvious point that recent warming was  recovering to roughly Medieval Warming levels after the abnormal cooling disruption from volcanoes. Excerpt in italics with my bolds.

“The new Bern study not only explains the global early 19th century climate, but it is also relevant for the present. “Given the large climatic changes seen in the early 19th century, it is difficult to define a pre-industrial climate,” explains lead author Stefan Brönnimann, “a notion to which all our climate targets refer.” And this has consequences for the climate targets set by policymakers, who want to limit global temperature increases to between 1.5 and 2 degrees Celsius at the most. Depending on the reference period, the climate has already warmed up much more significantly than assumed in climate discussions. The reason: Today’s climate is usually compared with a 1850-1900 reference period to quantify current warming. Seen in this light, the average global temperature has increased by 1 degree. “1850 to 1900 is certainly a good choice but compared to the first half of the 19th century, when it was significantly cooler due to frequent volcanic eruptions, the temperature increase is already around 1.2 degrees,” Stefan Brönnimann points out.”

Bern seems preoccupied with targets and accounting, while others are concerned to understand the role of volcanoes in natural climate change.  A previous post gives a more detailed explanation, thanks to a suggestion I received.

The LIA Warming Rebound Is Over

Thanks to Dr. Francis Manns for drawing my attention to the role of Volcanoes as a climate factor, particularly related to the onset of the Little Ice Age (LIA), 1400 to 1900 AD. I was aware that the temperature record since about 1850 can be explained by a steady rise of 0.5C per century rebound overlaid with a quasi-60 year cycle, most likely oceanic driven. See below Dr. Syun Akasofu 2009 diagram from his paper Two Natural Components of Recent Warming.
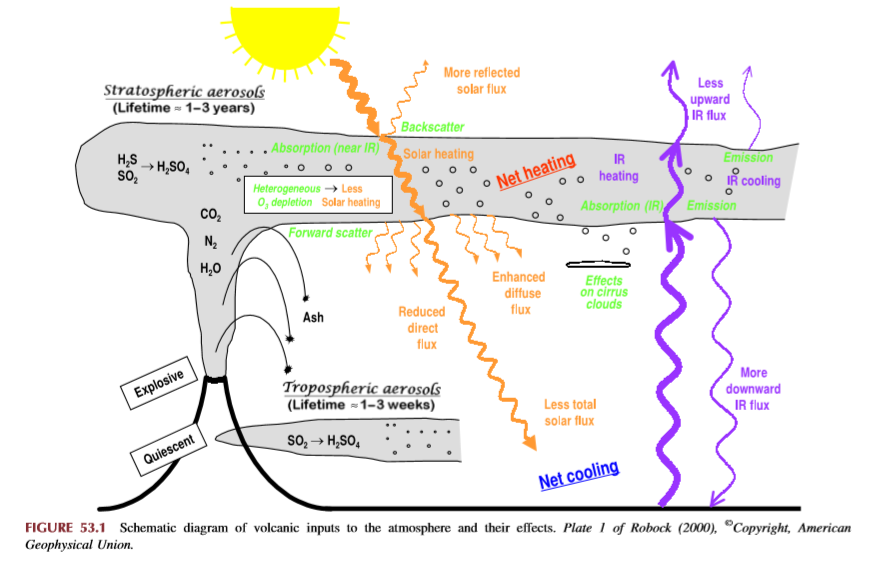
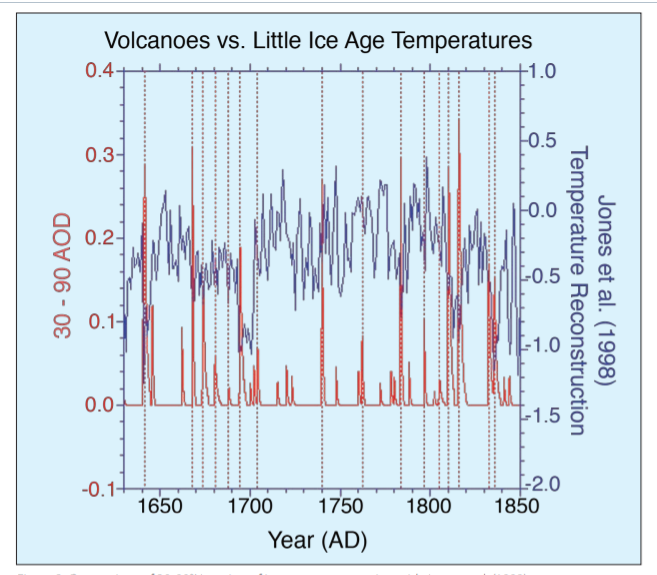
When I presented this diagram to my warmist friends, they would respond, “But you don’t know what caused the LIA or what ended it!” To which I would say, “True, but we know it wasn’t due to burning fossil fuels.” Now I find there is a body of evidence suggesting what caused the LIA and why the temperature rebound may be over. Part of it is a familiar observation that the LIA coincided with a period when the sun was lacking sunspots, the Maunder Minimum, and later the Dalton.

Not to be overlooked is the climatic role of volcano activity inducing deep cooling patterns such as the LIA.  Jihong Cole-Dai explains in a paper published 2010 entitled Volcanoes and climate. Excerpt in italics with my bolds.

There has been strong interest in the role of volcanism during the climatic episodes of Medieval Warm Period (MWP,800–1200 AD) and Little Ice Age (LIA, 1400–1900AD), when direct human influence on the climate was negligible. Several studies attempted to determine the influence of solar forcing and volcanic forcing and came to different conclusions: Crowley and colleagues suggested that increased frequency of stratospheric eruptions in the seventeenth century and again in the early nineteenth century was responsible in large part for LIA. Shindell et al. concluded that LIA is the result of reduced solar irradiance, as seen in the Maunder Minimum of sunspots, during the time period. Ice core records show that the number of large volcanic eruptions between 800 and 1100 AD is possibly small (Figure 1), when compared with the eruption frequency during LIA. Several researchers have proposed that more frequent large eruptions during the thirteenth century(Figure 1) contributed to the climatic transition from MWP to LIA, perhaps as a part of the global shift from a warmer to a colder climate regime. This suggests that the volcanic impact may be particularly significant during periods of climatic transitions.

How volcanoes impact on the atmosphere and climate

Alan Robock explains Climatic Impacts of Volcanic Eruptions in Chapter 53 of the Encyclopedia of Volcanoes.  Excerpts in italics with my bolds.

The major component of volcanic eruptions is the matter that emerges as solid, lithic material or solidifies into large particles, which are referred to as ash or tephra. These particles fall out of the atmosphere very rapidly, on timescales of minutes to a few days, and thus have no climatic impacts but are of great interest to volcanologists, as seen in the rest of this encyclopedia. When an eruption column still laden with these hot particles descends down the slopes of a volcano, this pyroclastic flow can be deadly to those unlucky enough to be at the base of the volcano. The destruction of Pompeii and Herculaneum after the AD 79 Vesuvius eruption is the most famous example.

Volcanic eruptions typically also emit gases, with H2O, N2, and CO2 being the most abundant. Over the lifetime of the Earth, these gases have been the main source of the Earth’s atmosphere and ocean after the primitive atmosphere of hydrogen and helium was lost to space. The water has condensed into the oceans, the CO2 has been changed by plants into O2 or formed carbonates, which sink to the ocean bottom, and some of the C has turned into fossil fuels. Of course, we eat plants and animals, which eat the plants, we drink the water, and we breathe the oxygen, so each of us is made of volcanic emissions. The atmosphere is now mainly composed of N2 (78%) and O2 (21%), both of which had sources in volcanic emissions.

Of these abundant gases, both H2O and CO2 are important greenhouse gases, but their atmospheric concentrations are so large (even for CO2 at only 400 ppm in 2013) that individual eruptions have a negligible effect on their concentrations and do not directly impact the greenhouse effect. Global annually averaged emissions of CO2 from volcanic eruptions since 1750 have been at least 100 times smaller than those from human activities. Rather the most important climatic effect of explosive volcanic eruptions is through their emission of sulfur species to the stratosphere, mainly in the form of SO2, but possibly sometimes as H2S. These sulfur species react with H2O to form H2SO4 on a timescale of weeks, and the resulting sulfate aerosols produce the dominant radiative effect from volcanic eruptions.

The major effect of a volcanic eruption on the climate system is the effect of the stratospheric cloud on solar radiation (Figure 53.1). Some of the radiation is scattered back to space, increasing the planetary albedo and cooling the Earth’s atmosphere system. The sulfate aerosol particles (typical effective radius of 0.5 mm, about the same size as the wavelength of visible light) also forward scatter much of the solar radiation, reducing the direct solar beam but increasing the brightness of the sky. After the 1991 Pinatubo eruption, the sky around the sun appeared more white than blue because of this. After the El Chicho´n eruption of 1982 and the Pinatubo eruption of 1991, the direct radiation was significantly reduced, but the diffuse radiation was enhanced by almost as much. Nevertheless, the volcanic aerosol clouds reduced the total radiation received at the surface.

Crowley et al 2008 go into the details in their paper Volcanism and the Little Ice Age. Excerpts in italics with my bolds.

Although solar variability has often been considered the primary agent for LIA cooling, the most comprehensive test of this explanation (Hegerl et al., 2003) points instead to volcanism being substantially more important, explaining as much as 40% of the decadal-scale variance during the LIA. Yet, one problem that has continually plagued climate researchers is that the paleo-volcanic record, reconstructed from Antarctic and Greenland ice cores, cannot be well calibrated against the instrumental record. This is because the primary instrumental volcano reconstruction used by the climate community is that of Sato et al. (1993), which is relatively poorly constrained by observations prior to 1960 (especially in the southern hemisphere).

Here, we report on a new study that has successfully calibrated the Antarctic sulfate record of volcanism from the 1991 eruptions of Pinatubo (Philippines) and Hudson (Chile) against satellite aerosol optical depth (AOD) data (AOD is a measure of stratospheric transparency to incoming solar radiation). A total of 22 cores yield an area-weighted sulfate accumulation rate of 10.5 kg/km2 , which translates into a conversion rate for AOD of 0.011 AOD/ kg/km2 sulfate. We validated our time series by comparing a canonical growth and decay curve for eruptions for Krakatau (1883), the 1902 Caribbean eruptions (primarily Santa Maria), and the 1912 eruption of Novarupta/Katmai (Alaska)

We therefore applied the methodology to part of the LIA record that had some of the largest temperature changes over the last millennium.

Figure 2: Comparison of 30-90°N version of ice core reconstruction with Jones et al. (1998) temperature reconstruction over the interval 1630-1850. Vertical dashed lines denote levels of coincidence between eruptions and reconstructed cooling. AOD = Aerosol Optical Depth.

The ice core chronology of volcanoes is completely independent of the (primarily) tree ring based temperature reconstruction. The volcano reconstruction is deemed accurate to within 0 ± 1 years over this interval. There is a striking agreement between 16 eruptions and cooling events over the interval 1630-1850. Of particular note is the very large cooling in 1641-1642, due to the concatenation of sulfate plumes from two eruptions (one in Japan and one in the Philippines), and a string of eruptions starting in 1667 and culminating in a large tropical eruption in 1694 (tentatively attributed to Long Island, off New Guinea). This large tropical eruption (inferred from ice core sulfate peaks in both hemispheres) occurred almost exactly at the beginning of the coldest phase of the LIA in Europe and represents a strong argument against the implicit link of Late Maunder Minimum (1640-1710) cooling to solar irradiance changes.

Figure 1: Comparison of new ice core reconstruction with various instrumental-based reconstructions of stratospheric aerosol forcing. The asterisks refer to some modification to the instrumental data; for Sato et al. (1993) and the Lunar AOD, the asterisk refers to the background AOD being removed for the last 40 years. For Stothers (1996), it refers to the fact that instrumental observations for Krakatau (1883) and the 1902 Caribbean eruptions were only for the northern hemisphere. To obtain a global AOD for these estimates we used Stothers (1996) data for the northern hemisphere and our data for the southern hemisphere. The reconstruction for Agung eruption (1963) employed Stothers (1996) results from 90°N-30°S and the Antarctic ice core data for 30-90°S.

During the 18th century lull in eruptions, temperatures recovered somewhat but then cooled early in the 19th century. The sequence begins with a newly postulated unknown tropical eruption in midlate 1804, which deposited sulfate in both Greenland and Antarctica. Then, there are four well-documented eruptions—an unknown tropical eruption in 1809, Tambora (1815) and a second doublet tentatively attributed in part to Babuyan (Philippines) in 1831 and Cosiguina (Nicaragua) in 1835. These closely spaced eruptions are not only large but have a temporally extended effect on climate, due to the fact that they reoccur within the 10-year recovery timescale of the ocean mixed layer.

The ocean has not recovered from the first eruption so the second eruption drives the temperatures to an even lower state.

Implications for Contemporary Climate Science

In this context Dr. Francis Manns went looking for a volcanic signature in recent temperature records. His paper is Volcano and Enso Punctuation of North American Temperature: Regression Toward the Mean  Excerpts in italics with my bolds.

Abstract: Contrary to popular media and urban mythology the global warming we have experienced since the Little Ice Age is likely finished. A review of 10 temperature time series from US cities ranging from the hottest in Death Valley, CA, to possible the most isolated and remote at Key West, FL, show rebound from the Little Ice Age (which ended in the Alps by 1840) by 1870. The United States reached temperatures like modern temperatures (1950 – 2000) by about 1870, then declined precipitously principally caused by Krakatoa, and a series of other violent eruptions. Nine of these time series started when instrumental measurement was in its infancy and the world was cooled by volcanic dust and sulphate spewed into the atmosphere and distributed by the jet streams. These ten cities represent a sample of the millions of temperature measurements used in climate models. The average annual temperatures are useful because they account for seasonal fluctuations. In addition, time series from these cities are punctuated by El Nino Southern Oscillation (ENSO).

As should be expected, temperature at each city reacted differently to differing events. Several cities measured the effects of Krakatoa in 1883 while only Death Valley, CA and Berkeley CA sensed the minor new volcano Paricutin in Michoacán, Mexico. The Key West time series shows rapid rebound from the Little Ice Age as do Albany, NY, Harrisburg, PA, and Chicago. IL long before the petroleum-industrial revolution got into full swing. Recording at most sites started during a volcanic induced temperature minimum thus giving an impression of global warming to which industrial carbon dioxide is persuasively held responsible. Carbon dioxide, however, cannot be proven responsible for these temperatures. These and likely subsequent temperatures could be the result of regression to the normal equilibrium temperatures of the earth (for now). If one were to remove the volcanic punctuation and El Nino Southern Oscillation (ENSO) input many would display very little alarming warming from 1815 to 2000. This review illustrates the weakness of linear regression as a measure of change. If there is a systemic reason for the global warming hypothesis, it is an anthropogenic error in both origin and termination. ENSO compliments and confirms the validity of NOAA temperature data. Temperatures since 2000 during the current hiatus are not available because NOAA has closed the public website.

Example of time series from Manns. Numbers refer to major named volcano eruptions listed in his paper.  For instance, #3 was Krakatoa

The cooling effect is said to have lasted for 5 years after Krakatoa erupted – from 1883 to 1888. Examination of these charts, However, shows that, e.g., Krakatoa did not add to the cooling effect from earlier eruptions of Cosaguina in 1835 and Askja in 1875. The temperature charts all show rapid rebound to equilibrium temperature for the region affected in a year or two at most.

Manns Map

Fourteen major volcanic eruptions, however, were recorded between 1883 and 1918 (Robock, 2000, and this essay). Some erupted for days or weeks and some were cataclysmic and shorter. The sum of all these eruptions from Krakatoa onward effected temperatures early in the instrumental age. Judging from wasting glaciers in the Alps, abrupt retreat began about 1860).

Manns Conclusions:
1)Four of these time series (Albany, Harrisburg, Chicago and Key West) show recovery to the range of today’s temperatures by 1870 before the eruption of Askja in 1875. The temperature rebounded very quickly after the Little Ice Age in the northern hemisphere.

Manns ENSO Map

2)Volcanic eruptions and unrelated huge swings shown from ENSO largely rule global temperature. Volcanic history and the El Nino Southern Oscillation (ENSO) trump all other increments of temperature that may be hidden in the lists.

3)The sum of the eruptions from Krakatoa (1883) to Katla (1918) and Cerro Azul (1932) was a cold start for climate models.

4)It is beyond doubt that academic and bureau climate models use data that was gathered when volcanic activity had depressed global temperature. The cluster from Krakatoa to Katla (1883 -1918) were global.

5)Modern events, Mount Saint Helens and Pinatubo, moreover, were a fraction of the event intensity of the late 19th and early 20th centuries eruptions.

6) The demise of frequent violent volcanos has allowed the planet to regress toward a norm (for now).

Summary

These findings describe a natural process by which a series of volcanoes along with a period of quiet solar cycles ended the Medieval Warm Period (MWP), chilling the land and inducing deep oceanic cooling resulting in the Little Ice Age. With much less violent volcanic activity in the 20th century, coincidental with typically active solar cycles, a Modern Warm Period ensued with temperatures rebounding back to approximately the same as before the LIA.

This suggests that humans and the biosphere were enhanced by a warming process that has ended. The solar cycles are again going quiet and are forecast to continue that way. Presently, volcanic activity has been routine, showing no increase over the last 100 years. No one knows how long will last the current warm period, a benefit to us from the ocean recovering after the LIA. But future periods are as likely to be cooler than to be warmer compared to the present.

Left/Right Predisposed to Believe/Doubt Climatism


Patrick T. Brown writes at Quillette Empiricism and Dogma: Why Left and Right Can’t Agree on Climate Change. Excerpts initalics with my bolds.

Rather than thinking about the political divide on global warming as the result of dogma versus logic, a better explanation is that people tend to embrace conclusions—scientific or otherwise—that support themes, ideologies, and narratives that are preexisting components of their worldview. It just so happens that the themes, ideologies, and narratives associated with human-caused global warming and its proposed solutions align well with the political predispositions of the Left and create tension with those of the Right.

The definitional distinction between the political Right and the political Left originated during the French Revolution, and relates most fundamentally to the desirability and perceived validity of social hierarchies. Those on the Right see hierarchies as natural, meritocratic, and justified, while those on the Left see hierarchies primarily as a product of chance and exploitation. A secondary distinction, at least contemporarily in the West, is that those on the Right tend to emphasize individualism at the expense of collectivism and those on the Left prefer the reverse.


There are several aspects of the contemporary global warming narrative that align well with an anti-hierarchy, collectivist worldview. This makes the issue gratifying to the sensibilities of the Left and offensive to the sensibilities of the Right.

The most fundamental of these themes is the degree to which humanity itself can be placed at the top of the hierarchy of life on the planet. Those on the Right are more likely to privilege the interests of humanity over the interests of other species or the “interests” of the planet as a whole (to the degree that there is such a thing). On the other hand, those on the Left are more likely to emphasize a kind of pan-species egalitarianism and care for our shared environment, even if that means implementing policies that run counter to humans’ short-term interests.

Within humanity, there are at least two additional ways in which narratives about hierarchies influence thinking on global warming. One of these concerns attitudes towards developed versus developing countries. Firstly, the blame for global warming falls disproportionately on developed countries (in terms of historical greenhouse gas emissions) and proposed solutions therefore often call on developed countries to bear the brunt of the cost of reducing emissions going forward. (Additionally, it is argued that developed countries have the luxury of being able to afford increases in the cost of energy.) Overall, the solutions proposed for global warming imply that wealthy countries owe a debt to the rest of humanity that should be paid due at once.

Those on the Right are more likely to see the wealth of developed countries as rightfully earned by their own industriousness, while those on the Left are more likely to view the disproportionate wealth as fundamentally unjust and likely caused by exploitation. The idea that wealthy countries must therefore be penalized and made to subsidize poor countries is one that aligns well with the Left’s views about rebalancing unfairness. An accentuating factor is the Right’s tendency to favor national autonomy and therefore to oppose global governance and especially international redistribution.

Hierarchy narratives also help to determine political positions on the wealth of corporations and individuals. On the Right, oil and gas companies (as well as electric utilities that utilize fossil fuels) are held to be a product of innovation and a source of wealth creation; the smartest and most deserving people and organizations found the most efficient ways to transform idle fossil fuel resources into the power that runs society and, consequently, have greatly enhanced human wellbeing. For conservatives, it is therefore fundamentally unjust to blame those corporations and individuals that have done so much for human progress. The counter-narrative from the Left is that greedy corporations and individuals exploited natural resources for their own gain at the expense of the planet and the general public. They therefore support policies that blame and punish the fossil fuel industry in the name of cosmic justice and atonement.

Global warming is a tragedy of the commons, in which logical agents act in ways that run counter to the longterm interests of the group. These types of “collective-action problems” usually call for top-down government intervention at the expense of individual action and responsibility. Furthermore, the longterm nature of global warming demands acquiescence to collective action across generations. This natural alignment of the global warming problem with collectivist themes makes the issue much more palatable to the Left than the Right.

There is also the longstanding claim by those on the Right that the global warming issue is a Trojan Horse intended to bring about all manner of unrelated changes desired by the Left. Books like Naomi Klein’s This Changes Everything: Capitalism vs. The Climate and initiatives like the Green New Deal have done nothing to dispel this fear. For example, the Green New Deal Resolution includes the following proposals:

    • Providing all people of the United States with—(i) high-quality health care; (ii) affordable, safe, and adequate housing; (iii) economic security; and (iv) access to clean water, clean air, healthy and affordable food, and nature.
    • Guaranteeing a job with a family-sustaining wage, adequate family and medical leave, paid vacations, and retirement security to all people of the United States.
    • Providing resources, training, and high-quality education, including higher education, to all people of the United States, with a focus on frontline and vulnerable communities, so those communities may be full and equal participants in the Green New Deal mobilization.

These objectives satisfy the Left’s policy goals. But, whatever the merits of those goals, it is not at all clear how they relate to global warming, if at all.

Conclusion

So, it should really not be particularly mysterious that opinions on global warming tend to divide along political lines. It is not because one side cleaves to dispassionate logic while the other remains obstinately wedded to political dogmatism. It is simply that the problem and its proposed solutions align more comfortably with the dogma of one side than the other. That does not mean, however, that the Left is equally out-of-step with the science of global warming as the Right. It really is the case that the Right is more likely to deny the most well-established aspects of the science. If skeptical conservatives are to be convinced, the Left must learn to reframe the issue in a way that is more palatable to their worldview.

Patrick T. Brown is an Assistant Professor in the Department of Meteorology and Climate Science at San Jose State University, California.

Comment: The analysis explains the predispositions of left and right toward the climate issue, but stops short of recognizing that doubters are motivated to seek contrary facts and information that contradict the climate suppositions. Those on the left already have massive social proof of their position, so little or no consideration of the technical facts is needed.  On the other hand, surveys show doubters tend to be more informed on the scientific research, having seen studies and findings not readily available in the biased mainstream media.


Footnote

See also Can Institutions Impose Climate Beliefs on Stakeholders?