 A previous post reprinted below pointed out how Pacific ice recovers in fits and starts, often see sawing between Bering and Okhotsk Seas. Now both of them are growing faster than the 13 year average (2007 to 2019 inclusive). The image above shows how much colder is Alaska this year versus 2019, probably related to Bering icing over. In the last 9 days, Bering added 100k km2, now up to 85% of last March max. Okhotsk added 150k km2 up to 67% of last March max.
The graph shows how January 2020 compared to 13 year average and some other years of interest.

This year’s recovery is matching and slightly exceeding average, and ahead of other recent years. MASIE shows extents slightly higher than SII.
 By January there are not many places where Arctic ice extent can grow. All the Eurasian shelf seas are full, as is the case on the CanAm side: Beaufort, CAA, Hudson Bay covered completely. Barents and Greenland Seas have some room to grow, as does Baffin Bay. But mainly the variability is on the Pacific side, where the usual Bering/Okhotsk see saw is reappearing.
As we have seen in past winters, ice in the Pacific Arctic tends to grow in fits and spurts, often alternating between Bering and Okhotsk Seas. The above image of the first two weeks of 2020 shows Okhotsk on the left growing ice steadily while Bering waffled back and forth ending with almost the same extent. Combined the two seas ice extents are slightly below the 13 year average at this time, due to Bering’s slow recovery.
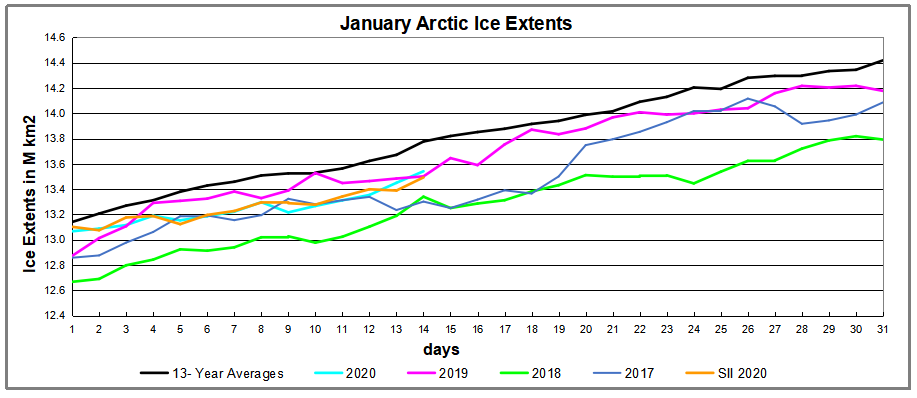
The January graph shows MASIE and SII reporting the same pace of ice recovery and matching 2019. This is somewhat below the 13 year average (2007 to 2019 inclusive) and higher than 2017 and 2018. The table below shows the distribution of ice extent among the Arctic regions on January 14.
| Region | 2020014 | Day 014 Average | 2020-Ave. | 2018014 | 2020-2018 |
| (0) Northern_Hemisphere | 13541376 | 13776703 | -235327 | 13340428 | 200948 |
| (1) Beaufort_Sea | 1070655 | 1070223 | 432 | 1070445 | 210 |
| (2) Chukchi_Sea | 965972 | 965812 | 160 | 965971 | 1 |
| (3) East_Siberian_Sea | 1087137 | 1087133 | 4 | 1087120 | 18 |
| (4) Laptev_Sea | 897845 | 897842 | 3 | 897845 | 0 |
| (5) Kara_Sea | 932936 | 909656 | 23280 | 925247 | 7689 |
| (6) Barents_Sea | 619526 | 508236 | 111290 | 393026 | 226500 |
| (7) Greenland_Sea | 483377 | 610574 | -127197 | 521896 | -38519 |
| (8) Baffin_Bay_Gulf_of_St._Lawrence | 1039079 | 1172487 | -133408 | 1173039 | -133960 |
| (9) Canadian_Archipelago | 854282 | 853058 | 1225 | 853109 | 1174 |
| (10) Hudson_Bay | 1260192 | 1251600 | 8592 | 1260838 | -646 |
| (11) Central_Arctic | 3233354 | 3210543 | 22811 | 3194383 | 38971 |
| (12) Bering_Sea | 414963 | 521989 | -107026 | 241830 | 173133 |
| (13) Baltic_Sea | 8863 | 43903 | -35040 | 24486 | -15623 |
| (14) Sea_of_Okhotsk | 651004 | 626433 | 24571 | 696684 | -45681 |
2019 NH ice is 235k km2 below the 13-year average, or 1.7%, and 200k km2 more than 2018 on that date. The deficits are in Bering, Greenland Sea and Baffin Bay, partly offset by surpluses in Barents, Kara and Okhotsk.

The next month or so will show how the Pacific ice shapes up.


Reblogged this on Climate Collections.
LikeLike
The BBC will of course include this in its output coming up to COP26 in Glasgow. (sarc.
LikeLike
Along with a commitment to remove Scottish windmills and put the trees back (sarc)
LikeLike