The Paris Accords and cancelling Keystone is just the beginning of life under the new climate regime.
President Biden’s vision is to “lead a clean energy revolution” that will free the United States from the “pollution” of carbon dioxide by 2035 and have “net-zero emissions” by 2050.
Of course, the President himself will likely not be around to see if the United States achieves either target, even if his insane plan survives successive administration. Instead, he sits in his chair like a languorous old man assiduously reading his speaking notes from his desk, looking like he is under house arrest. Still, he is governing—or at least, appearing to do so—by executive order, and the sheer mass of those dictates is not just staggering but terrifying.
The new President had barely warmed his Oval Office seat when he announced that the U.S. would return to the Paris climate accord—a job-destroying bit of global authoritarianism that is not worth the diplomatic paper it is printed on, let alone the lavish parties staged while it was being negotiated. Then, he quickly produced an executive order to cancel the XL pipeline. With the flash of another one of those pens that Biden runs through on a daily basis, he canceled 10,000 jobs in the U.S., along with another 3,000 in Canada. And this in the midst of a pandemic that even Biden has called our “dark winter!” Even uber-environmentalist Canadian Prime Minister Justin Trudeau supports the XL pipeline, and promptly said so.
Has President Biden discovered the miracle fuel that is going to make petroleum obsolescent and put the oil industry out of business—even before his administration decides to do it for them? Is that what he was up to during all those months when he cowered in his basement instead of campaigning for the presidency? Clearly, the Biden administration has not thought this through beyond the talking points.
Whether the President chooses to acknowledge it or not, oil will continue to be the principal source of energy for American consumers for quite some time to come—at least until perpetual motion is discovered. That oil that the XL pipeline was supposed to transport from America’s closest ally—Canada—will now have to be brought in by rail, a potentially more dangerous and far less environmentally friendly method than a pipeline.
Fossil fuels remain the overwhelming source of all of America’s energy needs: petroleum and natural gas account for 69% of energy usage, coal 11%, and nuclear power 8%. Renewable energy accounts for 11%, and that includes the wood you burn in the fireplace or woodstove every winter. Solar and wind power account for only a fraction of that 11%.
So clearly, with all his activist policy around climate change, President Biden has America on track for a return trip to the Middle Ages.
And like they did in the Middle Ages, the President expects Americans to have blind faith in the climate change priests who will be integral to his administration. If you don’t think the climate change movement is a religion or at least a passable cult, just listen to how its adherents talk about environmental policy. When Democrats were trying to convince us that the California wildfires were somehow the result of climate change, and not just bad forestry management, House Speaker Nancy Pelosi, sounding more like a pagan devotee than the good Catholic she claims to be, exploded: “Mother earth is angry, she is telling us. Whether she’s telling us with hurricanes in the Gulf Coast, fires in the West, whatever it is, the climate crisis is real.”
So if climate change is the culprit for every Act of God, will President Biden’s plan for Americans to live in caves and shut off the heat actually work? Not without China’s cooperation, where 29% of greenhouse gasses are emitted. Without addressing that reality, we’ll continue to spend untold trillions, lose the energy independence that we gained under former President Donald Trump, and sit in the dark, while China continues to play by its own rules—just as it has throughout the coronavirus pandemic.
What is so undemocratic about President Biden’s climate change plan is that it has been served up as an executive order, without debate, and without Congressional approval. What is so ominous about it is not its specificity—which sounds relatively harmless—but its vagueness and political potential. It’s a veritable environmental Enabling Act that can be used to justify any economic dictate, any security violation, or any foreign policy entanglement. Senate Majority Leader Chuck Schumer (D-NY) publicity advised Biden to “call a climate emergency … He can do many, many things under the emergency powers… that he could do without legislation.”
Even the President’s promise to replace the federal government’s gas-operating vehicles with electrical-powered versions is contained in another executive order to “buy American.”
The Biden administration is lying about the economic opportunities embedded in green energy, and its decision to “tackle” climate change is a blatant attempt to appease the left-wing Democrats who see Biden as their puppet. In the process, as he is doing with so many of these executive orders,
President Biden is destroying the American economy and naively trusting that brutal dictatorships like China will surrender before a bourgeois fetish like a greenhouse gas reduction target.
So much will be lost for nothing except America’s further prostration to China.
In January, most of the Arctic ocean basins are frozen over, and so the growth of ice extent slows down. According to SII (Sea Ice Index) January on average adds 1.3M km2, and this month it was 1.4M. (background is at Arctic Ice Year-End 2020). The few basins that can grow ice this time of year tend to fluctuate and alternate waxing and waning, which appears as a see saw pattern in these images.
Two weeks into February Arctic ice extents are growing faster than the 14-year average, such that they are approaching the mean. The graph below shows the ice recovery since mid-January for 2021, the 14-year average and several recent years.
The graph shows mid January a small deficit to average, then slow 2021 growth for some days before picking up the pace in the latter weeks. Presently extents are slightly (1%) below average, close to 2019 and 2020 and higher than 2018.
February Ice Growth Despite See Saws in Atlantic and Pacific
As noted above, this time of year the Arctic adds ice on the fringes since the central basins are already frozen over. The animation above shows Barents Sea on the right (Atlantic side) grew in the last two weeks by 175k km2 and is now 9% greater than the maximum last March. Meanwhile on the left (Pacific side) Bering below and Okhotsk above wax and wane over this period. Okhotsk is seen growing 210k km2 the first week, and giving half of it back the second week. Bering waffles up and down ending sightly higher in the end.
The table below presents ice extents in the Arctic regions for day 44 (Feb. 13) compared to the 14 year average and 2018.
Region
2021044
Day 044 Average
2021-Ave.
2018044
2021-2018
(0) Northern_Hemisphere
14546503
14678564
-132061
14140166
406337
(1) Beaufort_Sea
1070689
1070254
435
1070445
244
(2) Chukchi_Sea
966006
965691
315
965971
35
(3) East_Siberian_Sea
1087120
1087134
-14
1087120
0
(4) Laptev_Sea
897827
897842
-15
897845
-18
(5) Kara_Sea
934988
906346
28642
874714
60274
(6) Barents_Sea
837458
563224
274235
465024
372434
(7) Greenland_Sea
645918
610436
35482
529094
116824
(8) Baffin_Bay_Gulf_of_St._Lawrence
1057623
1487547
-429924
1655681
-598058
(9) Canadian_Archipelago
854597
853146
1451
853109
1489
(10) Hudson_Bay
1260471
1260741
-270
1260838
-367
(11) Central_Arctic
3206263
3211892
-5630
3117143
89120
(12) Bering_Sea
559961
674196
-114235
319927
240034
(13) Baltic_Sea
116090
94341
21749
76404
39686
(14) Sea_of_Okhotsk
1027249
930357
96892
911105
116144
(15) Yellow_Sea
9235
28237
-19002
33313
-24078
(16) Cook_Inlet
223
11137
-10914
11029
-10806
The table shows that Bering defict to average is offset by surplus in Okhotsk. Baffin Bay show the largest deficit, mostly offset by surpluses in Barents, Kara and Greenland Sea.
The polar bears have a Valentine Day’s wish for Arctic Ice.
And Arctic Ice loves them back, returning every year so the bears can roam and hunt for seals.
Footnote:
Seesaw accurately describes Arctic ice in another sense: The ice we see now is not the same ice we saw previously. It is better to think of the Arctic as an ice blender than as an ice cap, explained in the post The Great Arctic Ice Exchange.
Figure 5. CO2 emissions (a) and concentrations (b), anthropogenic radiative forcing (c), and global mean temperature change (d) for the three long-term extensions. As in Fig. 3, concentration, forcing, and temperature outcomes are calculated with a simple climate model (MAGICC version 6.8.01 BETA; Meinshausen et al., 2011a, b). Outcomes for the CMIP5 versions of the long-term extensions of RCP2.6 and RCP8.5 (Meinshausen et al., 2011c), as calculated with the same model, are shown for comparison.
Climate science research and assessments under the umbrella of the Intergovernmental Panel on Climate Change (IPCC) have misused scenarios for more than a decade. Symptoms of misuse have included the treatment of an unrealistic, extreme scenario as the world’s most likely future in the absence of climate policy and the illogical comparison of climate projections across inconsistent global development trajectories.
Reasons why such misuse arose include (a) competing demands for scenarios from users in diverse academic disciplines that ultimately conflated exploratory and policy relevant pathways, (b) the evolving role of the IPCC – which extended its mandate in a way that creates an inter-relationship between literature assessment and literature coordination, (c) unforeseen consequences of employing a temporary approach to scenario development, (d) maintaining research practices that normalize careless use of scenarios, and (e) the inherent complexity and technicality of scenarios in model-based research and in support of policy.
Consequently, much of the climate research community is presently off-track from scientific coherence and policy-relevance.
Attempts to address scenario misuse within the community have thus far not worked. The result has been the widespread production of myopic or misleading perspectives on future climate change and climate policy. Until reform is implemented, we can expect the production of such perspectives to continue, threatening the overall credibility of the IPCC and associated climate research. However, because many aspects of climate change discourse are contingent on scenarios, there is considerable momentum that will make such a course correction difficult and contested – even as efforts to improve scenarios have informed research that will be included in the IPCC 6th Assessment.
Discussion of How Imaginary Scenarios Spoil Attempts to Envision Climate Futures
The article above is paywalled, but a previous post reprinted below goes into the background of the role of scenarios in climate modelling, and demonstrates the effects referring to results from the most realistic model, INMCM5
Roger Pielke Jr. explains that climate models projections are unreliable because they are based on scenarios no longer bounded by reality. His article is The Unstoppable Momentum of Outdated Science. Excerpts in italics with my bolds.
Much of climate research is focused on implausible scenarios of the future, but implementing a course correction will be difficult.
In 2020, climate research finds itself in a similar situation to that of breast cancer research in 2007. Evidence indicates the scenarios of the future to 2100 that are at the focus of much of climate research have already diverged from the real world and thus offer a poor basis for projecting policy-relevant variables like economic growth and carbon dioxide emissions. A course-correction is needed.
In a new paper of ours just out in Environmental Research Letters we perform the most rigorous evaluation to date of how key variables in climate scenarios compare with data from the real world (specifically, we look at population, economic growth, energy intensity of economic growth and carbon intensity of energy consumption). We also look at how these variables might evolve in the near-term to 2040.
We find that the most commonly-used scenarios in climate research have already diverged significantly from the real world, and that divergence is going to only get larger in coming decades. You can see this visualized in the graph above, which shows carbon dioxide emissions from fossil fuels from 2005, when many scenarios begin, to 2045. The graph shows emissions trajectories projected by the most commonly used climate scenarios (called SSP5-8.5 and RCP8.5, with labels on the right vertical axis), along with other scenario trajectories. Actual emissions to date (dark purple curve) and those of near-term energy outlooks (labeled as EIA, BP and ExxonMobil) all can be found at the very low end of the scenario range, and far below the most commonly used scenarios.
Our paper goes into the technical details, but in short, an important reason for the lower-than-projected carbon dioxide emissions is that economic growth has been slower than expected across the scenarios, and rather than seeing coal use expand dramatically around the world, it has actually declined in many regions.
It is even conceivable, if not likely, that in 2019 the world has passed “peak carbon dioxide emissions.” Crucially, the projections in the figure above are pre-Covid19, which means that actual emissions 2020 to 2045 will be even less than was projected in 2019.
While it is excellent news that the broader community is beginning to realize that scenarios are increasingly outdated, voluminous amounts of research have been and continue to be produced based on the outdated scenarios. For instance, O’Neill and colleagues find that “many studies” use scenarios that are “unlikely.” In fact, in their literature review such “unlikely” scenarios comprise more than 20% of all scenario applications from 2014 to 2019. They also call for “re-examining the assumptions underlying” the high-end emissions scenarios that are favored in physical climate research, impact studies and economic and policy analyses.
Make no mistake. The momentum of outdated science is powerful. Recognizing that a considerable amount of climate science to be outdated is, in the words of the late Steve Rayer, “uncomfortable knowledge” — that knowledge which challenges widely-held preconceptions. According to Rayner, in such a context we should expect to see reactions to uncomfortable knowledge that include:
denial (that scenarios are off track),
dismissal (the scenarios are off track, but it doesn’t matter),
diversion (the scenarios are off track, but saying so advances the agenda of those opposed to action) and,
displacement (the scenarios are off track but there are perhaps compensating errors elsewhere within scenario assumptions).
Such responses reinforce the momentum of outdated science and make it more difficult to implement a much needed course correction.
Responding to climate change is critically important. So too is upholding the integrity of the science which helps to inform those responses. Identification of a growing divergence between scenarios and the real-world should be seen as an opportunity — to improve both science and policy related to climate — but also to develop new ways for science to be more nimble in getting back on track when research is found to be outdated.
[A previous post is reprinted below since it demonstrates how the scenarios drive forecasting by CMIP6 models, including the example of the best performant model: INMCM5]
Background from Previous Post : Best Climate Model: Mild Warming Forecasted
Links are provided at the end to previous posts describing climate models 4 and 5 from the Institute of Numerical Mathematics in Moscow, Russia. Now we have forecasts for the 21st Century published for INM-CM5 at Izvestiya, Atmospheric and Oceanic Physics volume 56, pages218–228(July 7, 2020). The article is Simulation of Possible Future Climate Changes in the 21st Century in the INM-CM5 Climate Model by E. M. Volodin & A. S. Gritsun. Excerpts are in italics with my bolds, along with a contextual comment.
Abstract
Climate changes in 2015–2100 have been simulated with the use of the INM-CM5 climate model following four scenarios: SSP1-2.6, SSP2-4.5, and SSP5-8.5 (single model runs) and SSP3-7.0 (an ensemble of five model runs). Changes in the global mean temperature and spatial distribution of temperature and precipitation are analyzed. The global warming predicted by the INM-CM5 model in the scenarios considered is smaller than that in other CMIP6 models. It is shown that the temperature in the hottest summer month can rise more quickly than the seasonal mean temperature in Russia. An analysis of a change in Arctic sea ice shows no complete Arctic summer ice melting in the 21st century under any model scenario. Changes in the meridional stream function in atmosphere and ocean are studied.
Overview
The climate is understood as the totality of statistical characteristics of the instantaneous states of the atmosphere, ocean, and other climate system components averaged over a long time period.
Therefore, we restrict ourselves to an analysis of some of the most important climate parameters, such as average temperature and precipitation. A more detailed analysis of individual aspects of climate change, such as changes in extreme weather and climate situations, will be the subject of another work. This study is not aimed at a full comparison with the results of other climate models, where calculations follow the same scenarios, since the results of other models have not yet been published in peer reviewed journals by the time of this writing.
The INM-CM5 climate model [1, 2] is used for the numerical experiments. It differs from the previous version, INMCM4, which was also used for experiments on reproducing climate change in the 21st century [3], in the following:
an aerosol block has been added to the model, which allows inputting anthropogenic emissions of aerosols and their precursors;
the concentrations and optical properties of aerosols are calculated, but not specified, like in the previous version;
the parametrizations of cloud formation and condensation are changed in the atmospheric block;
the upper boundary in the atmospheric block is raised from 30 to 60 km;
the horizontal resolution in the ocean block is doubled along each coordinate; and,
the software related to adaptation to massively parallel computers is improved, which allows the effective use a larger number of compute cores.
The model resolution in the atmospheric and aerosol blocks is 2° × 1.5° in longitude and latitude and 73 levels and, in the ocean, 0.5° × 0.25° and 40 levels. The calculations were performed at supercomputers of the Joint Supercomputer Center, Russian Academy of Sciences, and Moscow State University, with the use of 360 to 720 cores. The model calculated 6–10 years per 24 h in the above configuration.
Four scenarios were used to model the future climate: SSP1-2.6, SSP2-4.5, SSP3-7.0, and SSP5-8.5. The scenarios are described in [4]. The figure after the abbreviation SSP (Shared Socioeconomic Pathway) is the number of the mankind development path (see the values in [4]). The number after the dash means the radiation forcing (W m–2) in 2100 compared to the preindustrial level. Thus, the SSP1-2.6 scenario is the most moderate and assumes rapid actions which sharply limit and then almost completely stop anthropogenic emissions. Within this scenario, greenhouse gas concentrations are maximal in the middle of the 21st century and then slightly decrease by the end of the century. The SSP5-8.5 scenario is the warmest and implies the fastest climate change. The scenarios are recommended for use in the project on comparing CMIP6 (Coupled Model Intercomparison Project, Phase 6, [5]) climate models. Each scenario includes the time series of:
carbon dioxide, methane, nitrous oxide, and ozone concentrations;
emissions of anthropogenic aerosols and their precursors;
the concentration of volcanic sulfate aerosol; and
the solar constant.
One model experiment was carried out for each of the above scenarios. It began at the beginning of 2015 and ended at the end of 2100. The initial state was taken from the so-called historical experiment with the same model, where climate changes were simulated for 1850–2014, and all impacts on the climate system were set according to observations. The results of the ensemble of historical experiments with the model under consideration are given in [6, 7]. For the SSP3-7.0 scenario, five model runs was performed differing in the initial data taken from different historical experiments. The ensemble of numerical experiments is required to increase the statistical confidence of conclusions about climate changes.
[My Contextual Comment inserted Prior to Consideration of Results]
Firstly, the INM-CM5 historical experiment can be read in detail by following a linked post (see Resources at the end), but this graphic summarizes the model hindcasting of past temperatures (GMT) compared to HadCrutv4.
Figure 1. The 5-year mean GMST (K) anomaly with respect to 1850–1899 for HadCRUTv4 (thick solid black); model mean (thick solid red). Dashed thin lines represent data from individual model runs: 1 – purple, 2 – dark blue, 3 – blue, 4 – green, 5 – yellow, 6 – orange, 7 – magenta. In this and the next figures numbers on the time axis indicate the first year of the 5-year mean.
Secondly, the scenarios are important to understand since they stipulate data inputs the model must accept as conditions for producing forecasts according to a particular scenario (set of assumptions). The document with complete details referenced as [4] is The Scenario Model Intercomparison Project (ScenarioMIP) for CMIP6.
All the details are written there but one diagram suggests the implications for the results described below.
Figure 5. CO2 emissions (a) and concentrations (b), anthropogenic radiative forcing (c), and global mean temperature change (d) for the three long-term extensions. As in Fig. 3, concentration, forcing, and temperature outcomes are calculated with a simple climate model (MAGICC version 6.8.01 BETA; Meinshausen et al., 2011a, b). Outcomes for the CMIP5 versions of the long-term extensions of RCP2.6 and RCP8.5 (Meinshausen et al., 2011c), as calculated with the same model, are shown for comparison.
As shown, the SSP1-26 is virtually the same scenario as the former RCP2.6, while SSP5-85 is virtually the same as RCP8.5, the wildly improbable scenario (impossible according to some analysts). Note that FF CO2 emissions are assumed to quadruple in the next 80 years, with atmospheric CO2 rising from 400 to 1000 ppm ( +150%). Bear these suppositions in mind when considering the INMCM5 forecasts below.
Results [Continuing From Volodin and Gritsun]
Fig. 1. Changes in the global average surface temperature (K) with respect to the pre-industrial level in experiments according to the SSP1-2.6 (triangles), SSP2-4.5 (squares), SSP3-7.0 (crosses), and SSP5-8.5 (circles) scenarios.
Let us describe some simulation results of climate change in the 21st century. Figure 1 shows the change in the globally averaged surface air temperature with respect to the data of the corresponding historical experiment for 1850–1899. In the warmest SSP5-8.5 scenario (circles), the temperature rises by more than 4° by the end of the 21st century. In the SSP3-7.0 scenario (crosses), different members of the ensemble show warming by 3.4°–3.6°. In the SSP2-4.5 scenario (squares), the temperature increases by about 2.4°. According to the SSP1-2.6 scenario (triangles) , the maximal warming by ~1.7° occurs in the middle of the 21st century, and the temperature exceeds the preindustrial temperature by 1.4° by the end of the century.
[My comment: Note that the vertical scale starts with +1.0C as was seen in the historical experiment. Thus an anomaly of 1.4C by 2100 is an increase of only 0.4C, while the SSP2-4.5 result adds 1.4C to the present].
The results for other CMIP6 models have not yet been published in peer-reviewed journals. However, according to the preliminary analysis (see, e.g. https://cmip6workshop19.sciencesconf.org/ data/Session1_PosterSlides.pdf, p.29), the INM-CM5 model shows the lowest temperature increase among the CMIP6 models considered for all the scenarios due to the minimal equilibrium sensitivity to the CO2 concentration doubling, which is ~2.1° for the current model version, like for the previous version, despite new condensation and cloud formation blocks. [For more on CMIP6 comparisons see post Climate Models: Good, Bad and Ugly]
Fig. 2. Differences between the annual average surface air temperatures (K) in 2071–2100 and 1981–2010 for the (a) SSP5-8.5 and (b) SSP1-2.6 scenarios.
The changes in the surface air temperature are similar for all scenarios; therefore, we analyze the difference between temperatures in 2071–2100 and 1981–2010 under the SSP5-8.5 and SSP1-2.6 scenarios (Fig. 2). The warming is maximal in the Arctic; it reaches 10° and 3°, respectively. Other features mainly correspond to CMIP5 data [8], including the INMCM4 model, which participates in the comparison. The warming on the continents of the Northern Hemisphere is about 2 times higher than the mean, and the warming in the Southern Hemisphere is noticeably less than in the Northern Hemisphere. The land surface is getting warmer than the ocean surface in all the scenarios except SSP1-2.6, because the greenhouse effect is expected to weaken in the second half of the 21st century in this scenario, and the higher heat capacity of the ocean prevents it from cooling as quickly as the land.
The changes in precipitation in December–February and June–August for the SSP3-7.0 scenario averaged over five members of the ensemble are shown in Fig. 4. All members of the ensemble show an increase in precipitation in the winter in a significant part of middle and high latitudes. In summer, the border between the increase and decrease in precipitation in Eurasia passes mainly around or to the north of 60°. In southern and central Europe, all members of the ensemble show a decrease in precipitation. Precipitation also increases in the region of the summer Asian monsoon, over the equatorial Pacific, due to a decrease in the upwelling and an increase in ocean surface temperature (OST). The distribution of changes in precipitation mainly corresponds to that given in [6, Fig. 12.22] for all CMIP5 models.
The change in the Arctic sea ice area in September, when the ocean ice cover is minimal over the year, is of interest. Figure 5 shows the sea ice area in September 2015–2019 to be 4–6 million km2 in all experiments, which corresponds to the estimate from observations in [11]. The Arctic sea ice does not completely melt in any of the experiments and under any scenario. However, according to [8, Figs. 12.28 and 12.31], many models participating in CMIP6, where the Arctic ice area is similar to that observed at the beginning of the 21st century, show the complete absence of ice by the end of the 21st century, especially under the RCP8.5 scenario, which is similar to SSP5-8.5.
The reason for these differences is the lower equilibrium sensitivity of the INM-CM5 model.
Note that the scatter of data between experiments under different scenarios in the first half of the 21st century is approximately the same as between different members of the ensemble under the SSP3-7.0 scenario and becomes larger only after 2070. The sea ice area values are sorted in accordance with the radiative forcing of the scenarios only after 2090. This indicates the large contribution of natural climate variability into the Arctic ice area. In the SSP1-2.6 experiment, the Arctic ice area at the end of the 21st century approximately corresponds to its area at the beginning of the experiment.
Climate changes can be also traced in the ocean circulation. Figure 6 shows the change in the 5-year averaged intensity of the Atlantic meridional circulation, defined as the maximum of the meridional streamfunction at 32° N. All experiments show a decrease in the intensity of meridional circulation in the 21st century and natural fluctuations against this decrease. The decrease is about 4.5–5 Sv for the SSP5-8.5 scenario, which is close to values obtained in the CMIP5 models [8, Fig. 12.35] under the RCP8.5 scenario. Under milder scenarios, the weakening of the meridional circulation is less pronounced. The reason for this weakening of the meridional circulation in the Atlantic, as far as we know, is not yet fully understood.
Conclusion
Numerical experiments have been carried out to reproduce climate changes in the 21st century according to four scenarios of the CMIP6 program [4, 5], including an ensemble of five experiments under the SSP3-7.0 scenario. The changes in the global mean surface temperature are analyzed. It is shown that the global warming predicted by the INM-CM5 model is the lowest among the currently published CMIP6 model data. The geographical distribution of changes in the temperature and precipitation is considered. According to the model, the temperature in the warmest summer month will increase faster than the summer average temperature in Russia.
None of the experiments show the complete melting of the Arctic ice cover by the end of the 21st century. Some changes in the ocean dynamics, including the flow velocity and the meridional stream function, are analyzed. The changes in the Hadley and Ferrel circulation in the atmosphere are considered.
It wasn’t supposed to be this way. Along with canceling Lincoln’s name on schools (San Fran), the left is turning his words upside down.
As Frieda Vizel explains at the Tablet, the threat in our time is the enslaving of ordinary citizens by imposing a political orthodoxy favored by some elite people and wannabes. Her article is Conformity to the Good Is Not Good. Excerpts in italics with my bolds and added images.
These days, stringent orthodoxies seem to be the only thing on tap
These days, sadly, stringent orthodoxies seem to be the only thing on tap. For some, the dogma requires blind faith in partisan politics, even as our elected officials stoop ever lower in their conduct. For some, the dogma calls for believing our intellectual betters know best, even as their decisions—to continue and champion lockdowns as the best way to fight COVID-19, for example, even as studies show that lockdowns don’t work—run contrary to observable reality and create an endless stream of problems. Question these dogmas, question the fiery loyalty to the tribe of like-minded believers, and you meet an opposition just as vicious and close-minded as anything I’d experienced when I informed my former friends and neighbors that I was leaving the fold.
To an extent, that shouldn’t come as much of a surprise. Most people are more or less conformists. That’s how we organize as communities, as an interconnected social species. As blogger and entrepreneur Paul Graham has noted, for this interconnectedness to work, human beings must largely not only obey rules but, frequently, enforce them when they see others deviating from the norm; only a small minority swim upstream, and those could as easily end up compromising the collective as leading it to new great heights.
If my own experience taught me anything, however, it’s that Graham is only partly right: Personalities matter, but social context may matter more. How conformist we are depends on our place in society, and how much we stand to lose or gain by conforming. Oftentimes, we don’t as much conform as stay away from the can of worms that will be too much trouble if opened. As I learned all too well in my former life, in a system like that, where people are afraid to speak because they don’t want to face the consequence, it’s the bullies that thrive.
When the most cherished value is adherence to an agreed-upon, not-to-be-questioned set of beliefs, when you walk around feeling—as most Americans currently feel—that you’re not free to speak your mind, you can expect little but stasis, or, worst, a descent into a stifling social order of repression and coercion. I’ve seen this happen in my own community. Dear reader, we do not want this to be the case in America.
I get, of course, that most people who conform to a system, even one they feel is needlessly harsh about demanding obedience, do so because they believe they’re doing something good. Sure, you may think, a bunch of people on my side, in my tribe, are much too zealous, but they mean well so I’m just going to go ahead and play for the team and not worry too much about what I can or can’t say in public. Maybe I believe that the right is too hospitable to radical groups that recycle dangerous old racial theories, but I’m conservative and don’t want to give liberals the satisfaction. Maybe I think that political correctness has gone way too far, but I’m a liberal and don’t want to say anything that would give conservatives pleasure. That sort of self-censorship is precisely how communities grow more and more airless.
After I left my community, and after the psychological wounds of seeing basically everyone I ever knew and loved turn on me healed sufficiently, one thing that gave me great strength and comfort was knowing that no matter how hurt I still felt, I was at least free to think, to speak my mind, to make decisions based on my own judgments and ideas rather than follow the herd. This, to me, is what America is very much about, and I’ve come to know it enough to realize that this freedom is neither free nor easy. It depends on our collective commitment to standing up to any and all attempts to require groupthink and conformity at all costs. Now, then, is the time for all those well-meaning people who told me I was courageous for leaving a fundamentalist sect to in turn be brave and leave their own narrow-minded silos. It’s time for us all to be brave.
Presently the next climate Conference of Parties is scheduled for Glasgow this November, Covid allowing. (People used to say “God willing”, or “Weather permitting”, but nowadays it’s a virus in charge.) Actually, climate hysteria is like a seasonal sickness. Each year a contagion of anxiety and fear is created by disinformation going viral in both legacy and social media in the run up to the autumnal COP (postponed last year due to pandemic travel restrictions). Now that climatists have put themselves at the controls of the formidable US federal government, we can expect the public will be hugely hosed with alarms over the next few months. Before the distress signals go full tilt, individuals need to inoculate themselves against the false claims, in order to build some herd immunity against the nonsense the media will promulgate. This post is offered as a means to that end.
Media Climate Hype is a Cover Up
Back in 2015 in the run up to Paris COP, French mathematicians published a thorough critique of the raison d’etre of the whole crusade. They said:
Fighting Global Warming is Absurd, Costly and Pointless.
Absurd because of no reliable evidence that anything unusual is happening in our climate.
Costly because trillions of dollars are wasted on immature, inefficient technologies that serve only to make cheap, reliable energy expensive and intermittent.
Pointless because we do not control the weather anyway.
The prestigious Société de Calcul Mathématique (Society for Mathematical Calculation) issued a detailed 195-page White Paper presenting a blistering point-by-point critique of the key dogmas of global warming. The synopsis with links to the entire document is at COP Briefing for Realists
Even without attending to their documentation, you can tell they are right because all the media climate hype is concentrated against those three points.
Finding: Nothing unusual is happening with our weather and climate. Hype: Every metric or weather event is “unprecedented,” or “worse than we thought.”
Finding: Proposed solutions will cost many trillions of dollars for little effect or benefit. Hype: Zero carbon will lead the world to do the right thing. Anyway, the planet must be saved at any cost.
Finding: Nature operates without caring what humans do or think. Hype: Any destructive natural event is blamed on humans burning fossil fuels.
How the Media Throws Up Flak to Defend False Suppositions
The Absurd Media: Climate is Dangerous Today, Yesterday It was Ideal.
Billions of dollars have been spent researching any and all negative effects from a warming world: Everything from Acne to Zika virus. A recent Climate Report repeats the usual litany of calamities to be feared and avoided by submitting to IPCC demands. The evidence does not support these claims. An example:
It is scientifically established that human activities produce GHG emissions, which accumulate in the atmosphere and the oceans, resulting in warming of Earth’s surface and the oceans, acidification of the oceans, increased variability of climate, with a higher incidence of extreme weather events, and other changes in the climate.
Moreover, leading experts believe that there is already more than enough excess heat in the climate system to do severe damage and that 2C of warming would have very significant adverse effects, including resulting in multi-meter sea level rise.
Experts have observed an increased incidence of climate-related extreme weather events, including increased frequency and intensity of extreme heat and heavy precipitation events and more severe droughts and associated heatwaves. Experts have also observed an increased incidence of large forest fires; and reduced snowpack affecting water resources in the western U.S. The most recent National Climate Assessment projects these climate impacts will continue to worsen in the future as global temperatures increase.
Alarming Weather and Wildfires
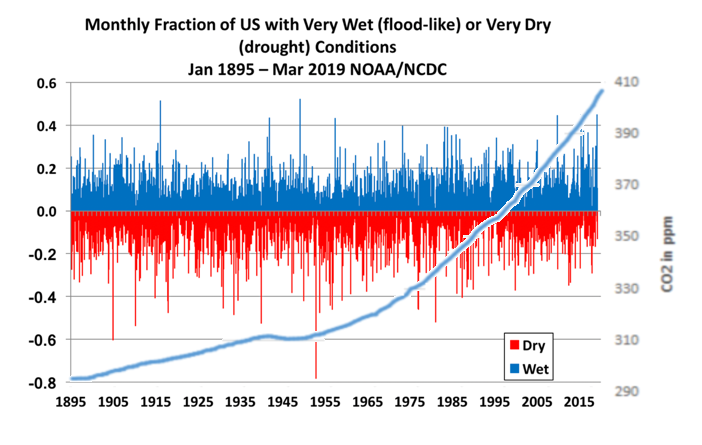
But: Weather is not more extreme.
And Wildfires were worse in the past. But: Sea Level Rise is not accelerating.
Litany of Changes
Seven of the ten hottest years on record have occurred within the last decade; wildfires are at an all-time high, while Arctic Sea ice is rapidly diminishing.
We are seeing one-in-a-thousand-year floods with astonishing frequency.
When it rains really hard, it’s harder than ever.
We’re seeing glaciers melting, sea level rising.
The length and the intensity of heatwaves has gone up dramatically.
Plants and trees are flowering earlier in the year. Birds are moving polewards.
We’re seeing more intense storms.
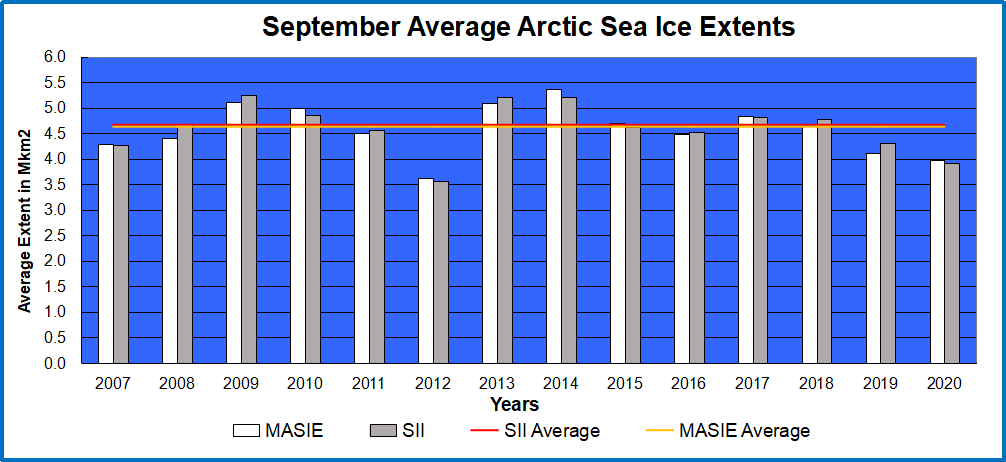
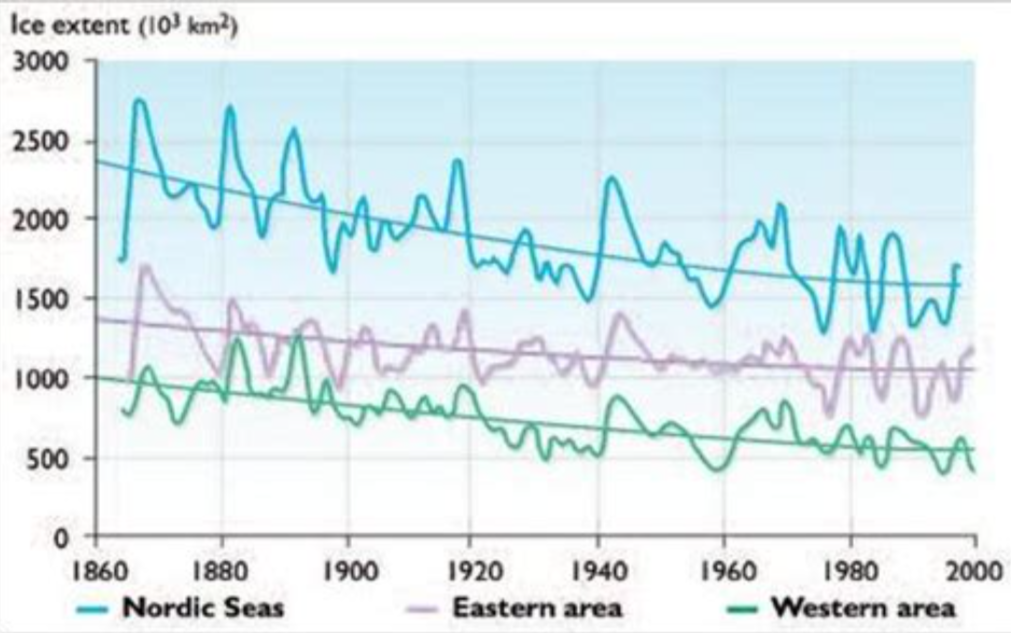
But: Arctic Ice has not declined since 2007.
But: All of these are within the range of past variability.
In fact our climate is remarkably stable, compared to the range of daily temperatures during a year where I live.
And many aspects follow quasi-60 year cycles.
The Impractical Media: Money is No Object in Saving the Planet.
Here it is blithely assumed that the court can rule the seas to stop rising, heat waves to cease, and Arctic ice to grow (though why we would want that is debatable). All this will be achieved by leaving fossil fuels in the ground and powering civilization with windmills and solar panels. While admitting that our way of life depends on fossil fuels, they ignore the inadequacy of renewable energy sources at their present immaturity.
An Example: The choice between incurring manageable costs now and the incalculable, perhaps even irreparable, burden Youth Plaintiffs and Affected Children will face if Defendants fail to rapidly transition to a non-fossil fuel economy is clear. While the full costs of the climate damages that would result from maintaining a fossil fuel-based economy may be incalculable, there is already ample evidence concerning the lower bound of such costs, and with these minimum estimates, it is already clear that the cost of transitioning to a low/no carbon economy are far less than the benefits of such a transition. No rational calculus could come to an alternative conclusion. Defendants must act with all deliberate speed and immediately cease the subsidization of fossil fuels and any new fossil fuel projects, and implement policies to rapidly transition the U.S. economy away from fossil fuels.
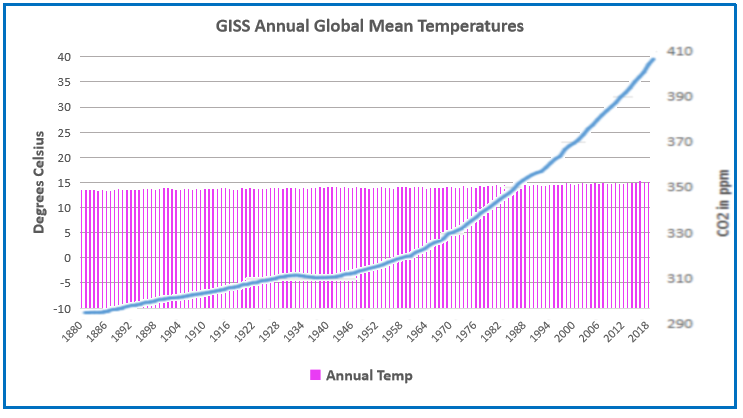
But CO2 relation to Temperature is Inconsistent.
But: The planet is greener because of rising CO2.
But: Modern nations (G20) depend on fossil fuels for nearly 90% of their energy.
But: Renewables are not ready for prime time.
People need to know that adding renewables to an electrical grid presents both technical and economic challenges. Experience shows that adding intermittent power more than 10% of the baseload makes precarious the reliability of the supply. South Australia is demonstrating this with a series of blackouts when the grid cannot be balanced. Germany got to a higher % by dumping its excess renewable generation onto neighboring countries until the EU finally woke up and stopped them. Texas got up to 29% by dumping onto neighboring states, and some like Georgia are having problems.
But more dangerous is the way renewables destroy the economics of electrical power. Seasoned energy analyst Gail Tverberg writes:
In fact, I have come to the rather astounding conclusion that even if wind turbines and solar PV could be built at zero cost, it would not make sense to continue to add them to the electric grid in the absence of very much better and cheaper electricity storage than we have today. There are too many costs outside building the devices themselves. It is these secondary costs that are problematic. Also, the presence of intermittent electricity disrupts competitive prices, leading to electricity prices that are far too low for other electricity providers, including those providing electricity using nuclear or natural gas. The tiny contribution of wind and solar to grid electricity cannot make up for the loss of more traditional electricity sources due to low prices.
The Irrational Media: Whatever Happens in Nature is Our Fault.
An Example:
Other potential examples include agricultural losses. Whether or not insurance reimburses farmers for their crops, there can be food shortages that lead to higher food prices (that will be borne by consumers, that is, Youth Plaintiffs and Affected Children). There is a further risk that as our climate and land use pattern changes, disease vectors may also move (e.g., diseases formerly only in tropical climates move northward).36 This could lead to material increases in public health costs
But: Actual climate zones are local and regional in scope, and they show little boundary change.
But: Ice cores show that it was warmer in the past, not due to humans.
The hype is produced by computer programs designed to frighten and distract children and the uninformed. For example, there was mention above of “multi-meter” sea level rise. It is all done with computer models. For example, below is San Francisco. More at USCS Warnings of Coastal Floodings
In addition, there is no mention that GCMs projections are running about twice as hot as observations.
Omitted is the fact GCMs correctly replicate tropospheric temperature observations only when CO2 warming is turned off.
Figure 5. Simplification of IPCC AR5 shown above in Fig. 4. The colored lines represent the range of results for the models and observations. The trends here represent trends at different levels of the tropical atmosphere from the surface up to 50,000 ft. The gray lines are the bounds for the range of observations, the blue for the range of IPCC model results without extra GHGs and the red for IPCC model results with extra GHGs.The key point displayed is the lack of overlap between the GHG model results (red) and the observations (gray). The nonGHG model runs (blue) overlap the observations almost completely.
In the effort to proclaim scientific certainty, neither the media nor IPCC discuss the lack of warming since the 1998 El Nino, despite two additional El Ninos in 2010 and 2016.
Further they exclude comparisons between fossil fuel consumption and temperature changes. The legal methodology for discerning causation regarding work environments or medicine side effects insists that the correlation be strong and consistent over time, and there be no confounding additional factors. As long as there is another equally or more likely explanation for a set of facts, the claimed causation is unproven. Such is the null hypothesis in legal terms: Things happen for many reasons unless you can prove one reason is dominant.
Finally, advocates and IPCC are picking on the wrong molecule. The climate is controlled not by CO2 but by H20. Oceans make climate through the massive movement of energy involved in water’s phase changes from solid to liquid to gas and back again. From those heat transfers come all that we call weather and climate: Clouds, Snow, Rain, Winds, and Storms.
Esteemed climate scientist Richard Lindzen ended a very fine recent presentation with this description of the climate system:
I haven’t spent much time on the details of the science, but there is one thing that should spark skepticism in any intelligent reader. The system we are looking at consists in two turbulent fluids interacting with each other. They are on a rotating planet that is differentially heated by the sun. A vital constituent of the atmospheric component is water in the liquid, solid and vapor phases, and the changes in phase have vast energetic ramifications. The energy budget of this system involves the absorption and reemission of about 200 watts per square meter. Doubling CO2 involves a 2% perturbation to this budget. So do minor changes in clouds and other features, and such changes are common. In this complex multifactor system, what is the likelihood of the climate (which, itself, consists in many variables and not just globally averaged temperature anomaly) is controlled by this 2% perturbation in a single variable? Believing this is pretty close to believing in magic. Instead, you are told that it is believing in ‘science.’ Such a claim should be a tip-off that something is amiss. After all, science is a mode of inquiry rather than a belief structure.
Summary: From this we learn three things:
Climate warms and cools without any help from humans.
Warming is good and cooling is bad. The hypothetical warming from CO2 would be a good thing.
With Biden replacing the skeptical Trump presidency, we are seeing how extensive is the mass addiction to climate pseudoscience. As children, many of us experienced cotton candy at a county fair, circus midway or amusement park. This science is like that: a sugar high from a fluffy, vaporous cloud lacking any calories of substance. How strange now to see elite adults addicted to this green stuff; people like politicians, financiers, judges and captains of industry, added to children and teachers who swallowed green junk science for decades.
Little further warming will occur at present levels of atmospheric CO2, even if present levels were to double from 400 ppm to 800 ppm.
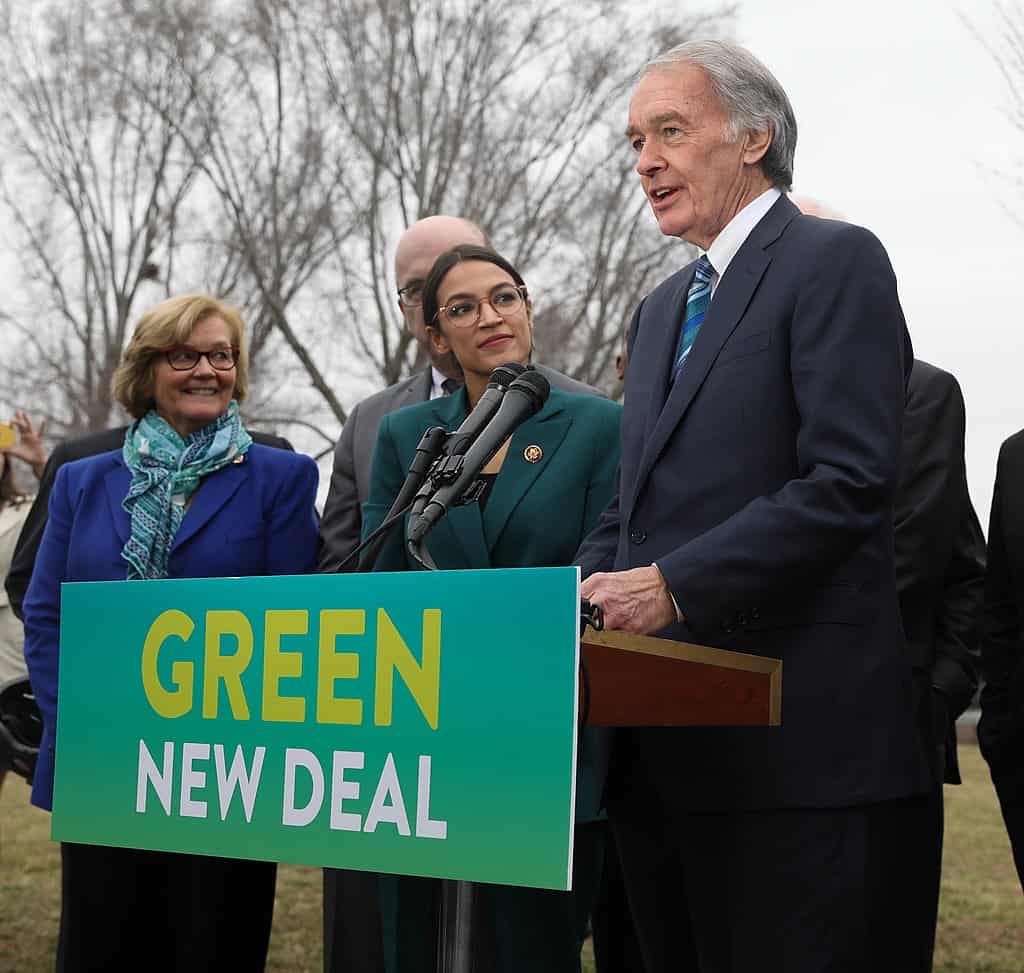
Senator Ed Markey (D-MA) and Congresswoman Alexandria Ocasio-Cortez (D-NY) in 2019. Markey is the Senate author of the Green New Deal, the inspiration behind the Biden administration’s present green climate initiatives. (GreenNewDeal Presser)
The green program behind President Biden’s post-inaugural flood of executive orders is unscientific and deficient in economic and geostrategic common sense. The major media have endeavored to conceal that truth by means of three decades of spurious climate scare stories.
The claim that humanity faces an imminent global warming catastrophe because of its use of fossil fuels is junk science.
The central lie pushed by major media and the UN’s Intergovernmental Panel on Climate Change (IPCC) is that increases in atmospheric CO2 from fossil-fuel use will keep boosting global temperatures. This supposedly will be further multiplied catastrophically by positive feedback: as oceans warm, atmospheric water vapor, another greenhouse gas, will increase. This will foster more warming, which will further warm the oceans, generating more atmospheric water vapor, and so on. The result of these alleged positive feedback mechanisms for CO2 and H2O, the narratives claim, will be that Earth ends up being a hot lifeless planet like Venus.
The feedbacks are negative
If such positive feedbacks existed, Earth already would have turned into another Venus. The reason this hasn’t happened is because negative feedback mechanisms operate for both CO2 and H2O. These the IPCC and media have studiously avoided discussing before the public:
The truth of the matter is that increases in atmospheric CO2 have rapidly diminishing power as a greenhouse gas. Little further warming will occur at present levels of atmospheric CO2, even if present levels were to double from 400 ppm to 800 ppm.
William Happer is Professor Emeritus in Physics at Princeton University. The Happer paper, “Radiation Transfer,” was issued as one of nine “Red Team” type papers by the Executive Office of the President of the United States during the last days of the Trump administration. They were subsequently denied that White House imprimatur by Trump Science Advisor, Kelvin Droegemeier. Climate scientist Roy Spencer, another of the “Red Team” authors, believes Droegemeier did this “for political purposes and professional gain.” Droegemeier served on the National Science Board for 12 years during the George W. Bush and Obama administrations. From 2012 to 2016, he served as Obama’s Vice Chairman of the NSB.
Fears of CO2 Are Overblown
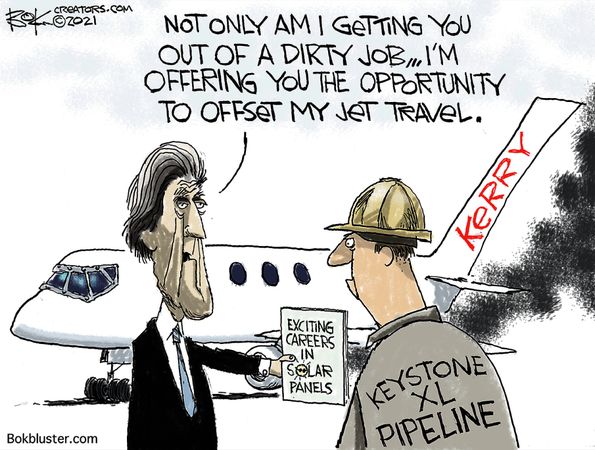
Present atmospheric CO2 levels are around 410 parts per million. The global warming catastrophists animating the Biden administration believe that further increases will doom the planet. Biden’s climate envoy John Kerry, the latest in a long line of failed prophets of doom, gives the planet just nine more years unless drastic action is taken against fossil fuel consumption.
Hayden writes that: “[T]he warming that would be caused by the next 400 ppmv (parts per million by volume) of CO2 would be about one-tenth as much as caused by the first 400 ppmv. Again, this is likely an overestimate.”
In “Radiation Transfer,” Happer writes:
At the mean distance of Earth from the Sun, sunlight carries an energy flux of about 1,360 Watts per square meter (Wm-2) …. [F]or cloud-free temperate latitudes, doubling the concentration of carbon dioxide would decrease thermal radiation to space by about 3 Wm-2.
Seasonal warming much greater than doubled CO2 warming
By way of comparison, Happer writes, because of the Earth’s elliptical orbit, which modestly modifies the distance between Sun and Earth during its annual orbit, “there is 91 Wm-2 change [in] flux from summer to winter.” In other words, the extra heating of Earth by a doubling of CO2 from present values would produce just 3.3% of the heat difference regularly observed on Earth between January vs. July. “Great efforts are needed to concoct a ‘scientific’ argument that 3 Wm-2 is worth worrying about,” Happer concludes, adding that
Any doubling of carbon dioxide concentrations will produce the same 3 Wm-2 decrease of flux to space whether we consider doubling the pre-industrial value of 280 parts per million (ppm) to 560 ppm, which could happen by about the year 2100 at the current rate of increase around 2 ppm/year. Doubling the current 410 ppm atmospheric concentration to 820 ppm would take about two centuries.
The physics of diminishing CO2 greenhouse behavior
The reason that CO2 exhibited diminishing returns as a greenhouse gas (GHG) — even before present atmospheric levels were reached — is that to be a GHG, an atmospheric gas must prevent infrared radiation from escaping into space. CO2 does this only in a very narrow band of infrared frequencies (the 14 to 16 micrometer band). This band quickly, at much lower atmospheric levels of CO2 than at present, tends towards saturation. But meanwhile, radiation across the rest of the much larger spectrum of infrared frequencies escapes into space, thereby maintaining Earth at an equilibrium temperature.
This is one of the important negative feedback mechanisms that prevents Earth from becoming a Venus.
Why isn’t this obvious to the climate catastrophists backing the UN’s IPCC? There are two approaches to this question: one, scientific; the other sociological. The scientific rationale, if there is a respectable rationale to be made, is described by Hayden as follows:
[W]e know from satellite measurements that the temperature rise since about 1979 has been almost 0.6º C, far above that caused directly by CO2. Climate scientists are fully aware of these numbers. They know that increasing CO2 concentration—by itself—has little effect on temperature even if the amount doubles. The claim is that the warming is amplified by the increase in the H2O greenhouse effect.
If this claim is wrong, any warming beyond the little that can be attributed to increased CO2 must be of natural origin (or changes in land use, not fossil fuels).
H2O greenhouse behavior also diminishes, Hayden adds:
In case you are wondering why the earth did not bootstrap itself into boiling temperatures during the Eemian Interglacial, the Holocene Climate Optimum, the Minoan Warm Period, the Roman Warm Period, the Medieval Warm Period, or thousands of other warmings, the answer is that the climate is not controlled by positive feedback—where hot weather begets even hotter weather—but by negative feedback—where, as things get hotter, they shed more heat. For the last half-billion years, this negative feedback system has kept the temperature of the surface of the earth within a few percent of its present 288 K.
Water vapor also is subject to negative feedback. Increased atmospheric levels of it condense as clouds, rain, snow, or ice. Nor does it escape the same saturation effect to which CO2 is subject. Wijngaarden and Happer write:
[A]t current concentrations, the forcings [greenhouse gas behaviors] from all greenhouse gases are saturated. The saturations of the abundant greenhouse gases H2O and CO2 are so extreme that the per-molecule forcing is attenuated by four orders of magnitude with respect to the optically thin values [values at lower concentrations]. Saturation also suppresses the forcing power per molecule for the less abundant greenhouse gases O3 , N2O and CH4 from their optically thin values, but far less than for H2O and CO2.
The cheapening of climate science programs
A compelling sociological explanation for the perspectives of the CO2 catastrophists is provided by climate scientist Judith Curry. In an interview with Christopher Balkaran of the Strong and Free podcast channel, she explains what happened to the field of climate studies between when she began to study climate at graduate school in the late seventies and early eighties and the present.
Curry: Climate change wasn’t a really big issue at that point. At the time, it was all about geophysical fluid dynamics, trying to understand the circulations of atmosphere and the ocean, radiative transfer, cloud physics. It was, it was very physics based. I would hear in the media about people talking about, Oh, the ice age is coming , or doom and gloom from CO2 emissions, but nobody was really paying attention to all that very much in terms of what I would say the mainstream field until the late 1980s, really.
[D]efenders of the IPCC started pushing the idea that anybody who doubts us or challenges us, they are in the pay of big oil. After that, it became much more difficult to really challenge all that. And certainly by the turn of the century, anybody who was questioning the hockey stick or any of these other things were slammed as deniers and ostracized. And then after Climategate in 2010, the consensus enforcers became very militant. So it’s a combination of politics, and some mediocre scientists trying to protect their careers. [T]hey saw this whole thing as a way for career advancement, and it gives them a seat at the big table and political power….
I was old school at the University of Chicago with geophysical fluid dynamics and all this really hard stuff…. There’s very few universities that have good programs in climate dynamics at this point…. Climate dynamics is still there, but it’s far from dominant…. [T]here are all these new degree programs spinning up in climate, that are far away from the geo-physical roots. These new programs combine policy with a little bit of science and economics and whatever… [T]he science part of it basically gets minimized. And that’s where all the students are running to… leaving a talent dearth of people with the good mathematical physical mindset and wanting to enter into the more challenging fields.
Conclusion: Retribution in 2022?
In conclusion, the Biden administration is basing its entire economic and geopolitical policies on bad CO2 science.
The policies are harmful to working people here and abroad. The policies abandon US fossil fuel strengths to the benefit of a hostile China, Russia, and Iran. They damage the US economy. As Sen. John Barasso (R-Wyo) pointed out in a USA Today op-ed,
A federal leasing ban would kill an estimated 62,000 jobs in New Mexico, nearly 120,000 in Texas and more than 33,000 in my home state of Wyoming next year alone, according to the American Petroleum Institute. It will also eliminate hundreds of millions of dollars in revenue that these states depend on for public schools, roads, water projects and other essential services. In response to the Keystone cancellation, TC Energy has announced 1,000 layoffs, and the potential union jobs lost could be 10 times higher.
If there’s something approximating a fair election in 2022, Democrats will pay a price for their unscientific climate policy, so contrary to the national interest, in the House of Representatives and Senate.
When a Halloween party sparked a COVID-19 outbreak at North Carolina Agricultural and Technical State University, school officials conducted rapid screening on more than 1,000 students in a week, including many who didn’t have symptoms.
Although such asymptomatic screening isn’t approved by regulators and the 15-minute tests aren’t as sensitive as the genetic one that can take days to yield results, the testing director at the historically black college credits the approach with quickly containing the infections and allowing the campus to remain open.
“Within the span of a week, we had crushed the spread. If we had had to stick with the PCR test, we would have been dead in the water,” said Dr. Robert Doolittle, referring to the polymerase chain reaction test that is considered the gold standard by many doctors and Food and Drug Administration regulators.
Compounding the problem is that an estimated 40% of people infected don’t develop symptoms. It’s among these silent spreaders that Mina says rapid tests have the clear advantage over lab tests. With its medical precision, he argues that the PCR test continues to detect COVID-19 in many people who have already fought off the virus and are no longer contagious. The rapid test, while less sensitive, is better at quickly catching the virus during the critical early days of infection when it can spread explosively through communities.
“This isn’t a clinical test — it’s a public health screening test,” Mina said.
The case for widescale rapid testing is getting a boost from universities and school systems that have used the approach to stay open through the latest waves of the pandemic. And proponents point to apparent success stories like the small European nation of Slovakia, which saw infections drop after screening two-thirds of its roughly 5 million people with the tests.
Quidel’s Sofia kits for rapid coronavirus testing. (photo credit: SOFIA ISRAEL)
The Slovakian model for combating the spread of the virus has proven itself time and time again • pandemic could be completely eradicated worldwide within six weeks
Perhaps the most widely used coronavirus rapid test kit is the Sofia kit developed by American company Quidel. In the past couple of months, Israel has been receiving shipments of the rapid test kits and deploying them throughout the country, while connecting them to systems used by the Health Ministry.
“Rapid and large-scale tests have proven to be efficient in dealing with the coronavirus pandemic around the globe, at least until the long-anticipated vaccine reaches the entire population, and probably after as well,” a statement by Sofia Israel said.
The 300 kits of Sofia which were purchased by Israel have been distributed to retirement homes, medical clinics, health funds and IDF bases, as well as to Israel Police and Prison Services facilities. Sofia Israel has noted that this means Israel would be able to adopt the Slovakian model of conducting large-scale rapid tests successfully.
“The importance of receiving immediate results is critical in managing the outbreak, and overpowers the benefits of slow and more accurate lab tests that require several days for providing results,” a Sofia Israel press release said.
Each Sofia kit can administer 40 tests per hour and provide results within 15 minutes. In a day, 960 Israelis can be tested using one kit only. The 300 kits already distributed, working 24/7, have the capacity to test 288,000 Israelis every day.
Background from previous post: Covid Rapid Tests Finally Out from Quebec Storage (200 Scientists Ask)
Our son is working mightily to keep his HVAC enterprise alive during the contagion. Last week a key employee after visiting a pharmacy where a person tested positive was told to go home and get tested (took two days), and then stay home to wait for results (3 more days). So a work week was lost and the business hobbled during that time. So I wondered what happened to all those rapid covid tests that were purchased back in September.
“We have 1.2 million of those tests just sitting in a warehouse in Farnham,” Université de Montréal professor Roxane Borgès Da Silva says.
A group of 213 scientists, professors, health-care workers and patients published an open letter to the Legault government Thursday calling on Quebec to roll out rapid COVID-19 tests to curb outbreaks more quickly and to step up its communications strategy.
“We have 1.2 million of those tests just sitting in a warehouse in Farnham,” Roxane Borgès Da Silva, a professor with the Université de Montréal’s school of public health, said in an interview Wednesday night. “We have reached a point in the evolution of the pandemic where the health system is at the breaking point. It is time that we use every tool at our disposal.”
In the letter, the signatories from institutions including the Université de Montréal, McGill, Laval, UQAM and the Institut national de santé publique du Québec (INSPQ), note the partial closure of businesses and restrictions on gatherings have failed to stem the increase in coronavirus cases, hospitalizations and deaths.
With a month-long curfew instituted Saturday, officials must take advantage of the expected decline in cases to counter the spread through better screening, which is “all the more important in a context where possible variants of the SARS-CoV-2 virus, which are more infectious, could spread in Quebec,” the letter reads.
Using rapid tests could help to identify positive cases more quickly, particularly those among asymptomatic patients and those who have been at so-called “super-spreader” events, the letter states
“In this regard, we believe that the simple and widely available access throughout the territory to rapid tests … allowing a result to be obtained in a few minutes could be a game-changer, especially in places of propagation.”
Quebec has been hesitant to use the tests widely because it fears their lack of sensitivity could clear people for COVID-19 when they actually have the virus. But Da Silva said the tests are close to 90-per-cent accurate when used on patients who are in an extremely contagious phase, which is crucial to stopping the most dangerous transmitters. The tests could be used at workplaces, high schools and CHSLDs, or be made available at pharmacies and doctors’ offices to allow the public to get tested quickly, Da Silva said.
As well, the signatories argue the government needs to do a better job of transmitting data and information to the public to improve citizens’ confidence in the science and improve compliance with regulations. They suggest using improved communication campaigns that appeal to the general public and using new strategies that incorporate humour and music.
The tests, which return a result in as little as 15 minutes, have variously been called a “game-changer” (Ontario Premier Doug Ford) and “less safe” as the gold-standard PCR lab test (Quebec Health Minister Christian Dubé, to Le Devoir).
The chair of McGill University’s bioengineering department, Dr. David Juncker, leans to the Ford end of the spectrum —provided the tests are used effectively. Right now they are not, he said, and it’s to the detriment of the broader testing effort.
“The current testing system isn’t very effective in terms of contact, trace and isolate … it’s too slow, it’s too cumbersome, it has too many delays. That’s one of the reasons we’re failing in containing the spread of the pandemic,” said Juncker, an expert on diagnostic testing.
The main area of concern for the provincial government — also voiced by federal officials — is the the rapid test’s lower accuracy, or sensitivity, and the risk of false negatives.
Those fears are overblown, in Juncker’s view, because the rapid tests can still help ferret out highly infectious people.
“If we just speak about diagnostic performance … the PCR test is the most effective one,” he said. “But if we think about what we want to use this for, as a public health tool that we want to use to contain and detect infectious individuals very quickly and isolate them very fast, that’s where rapid tests can be very helpful.”
My Comment: The need is to quickly identify people with enough viral load to infect others, and to become sick themselves. Rapid tests excel at this when applied to people with symptoms that might or might not be Covid19. Officials have been obsessed with PCR tests which are hyper-sensitive and show people as positive with too little load or even from a trace of dead virus. Those false positives generate lots of fear and clog the system with people unnecessarily.
Background from Previous Post On Non-Infectious Covid Positives
Elevated ‘cycle thresholds’ may be detecting virus long after it is past the point of infection.
A growing body of research suggests that a significant number of confirmed COVID-19 infections in the U.S. — perhaps as many as 9 out of every 10 — may not be infectious at all, with much of the country’s testing equipment possibly picking up mere fragments of the disease rather than full-blown infections.
Yet a burgeoning line of scientific inquiry suggests that many confirmed infections of COVID-19 may actually be just residual traces of the virus itself, a contention that — if true — may suggest both that current high levels of positive viruses are clinically insignificant and that the mitigation measures used to suppress them may be excessive.
Background from previous post: New Better and Faster Covid Test
Kevin Pham reports on a breakthrough in coronavirus testing. Excerpts in italics with my bolds.
Another new test for COVID-19 was recently authorized — and this one could be a game-changer.
The Abbot Diagnostics BinaxNOW antigen test is a new point-of-care test that reportedly costs only $5 to administer, delivers results in as little as 15 minutes, and requires no laboratory equipment to perform. That means it can be used in clinics far from commercial labs or without relying on a nearby hospital lab.
That last factor is key. There are other quick COVID-19 tests on the market, but they have all required lab equipment that can be expensive to maintain and operate, and costs can be prohibitive in places that need tests most.
This kind of test is reminiscent of rapid flu tests that are ubiquitous in clinics. They’ll give providers tremendous flexibility in testing for the disease in not just clinics, but with trained and licensed medical professionals, in schools, workplaces, camps, or any other number of places.
So what’s new about this test? Most of the current tests detect viral RNA, the genetic material of SARS-CoV-2. This is a very accurate way of detecting the virus, but it requires lab equipment to break apart the virus and amplify the amount of genetic material to high enough levels for detection.
The BinaxNOW test detects antigens — proteins unique to the virus that are usually detectable whenever there is an active infection.
Abbott says it intends to produce 50 million tests per month starting in October. That’s far more than the number tested in July, when we were breaking new testing records on a daily basis with approximately 23 million tests recorded.
There’s a more important reason to be encouraged by this test coming available. The viral load is not amplified by the test, so a positive is actually a person needing isolation and treatment. As explained in a previous post below, the PCR tests used up to now clutter up the record by showing as positive people with viral loads too low to be sick or to infect others.
Background from Previous Post The Truth About CV Tests
The peoples’ instincts are right, though they have been kept in the dark about this “pandemic” that isn’t. Responsible citizens are starting to act out their outrage from being victimized by a medical-industrial complex (to update Eisenhower’s warning decades ago). The truth is, governments are not justified to take away inalienable rights to life, liberty and the pursuit of happiness. There are several layers of disinformation involved in scaring the public. This post digs into the CV tests, and why the results don’t mean what the media and officials claim.
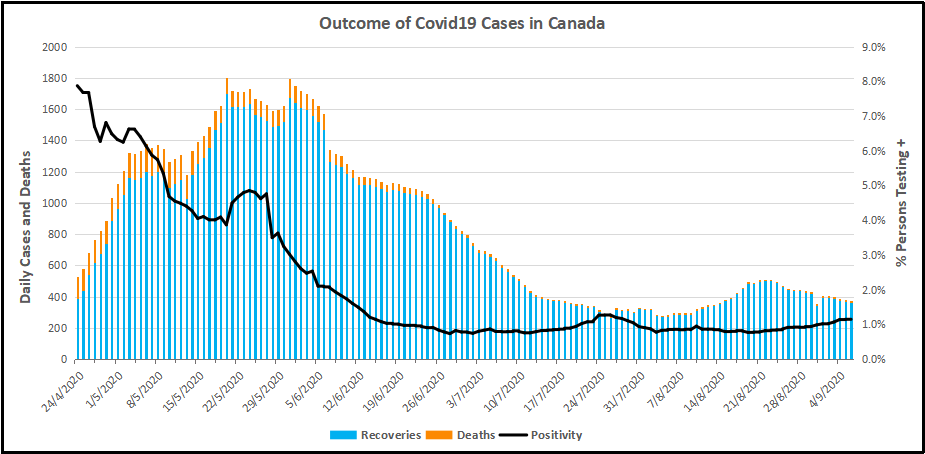
For months now, I have been updating the progress in Canada of the CV outbreak. A previous post later on goes into the details of extracting data on tests, persons testing positive (termed “cases” without regard for illness symptoms) and deaths after testing positive. Currently, the contagion looks like this.
The graph shows that deaths are less than 5 a day, compared to a daily death rate of 906 in Canada from all causes. Also significant is the positivity ratio: the % of persons testing positive out of all persons tested each day. That % has been fairly steady for months now: 1% positive means 99% of people are not infected. And this is despite more than doubling the rate of testing.
But what does testing positive actually mean? Herein lies more truth that has been hidden from the public for the sake of an agenda to control free movement and activity. Background context comes from Could Rapid Coronavirus Testing Help Life Return To Normal?, an interview at On Point with Dr. Michael Mina. Excerpts in italics with my bolds. H/T Kip Hansen
A sign displays a new rapid coronavirus test on the new Abbott ID Now machine at a ProHEALTH center in Brooklyn on August 27, 2020 in New York City. (Spencer Platt/Getty Images)
Dr. Michael Mina:
COVID tests can actually be put onto a piece of paper, very much like a pregnancy test. In fact, it’s almost exactly like a pregnancy test. But instead of looking for the hormones that tell if somebody is pregnant, it looks for the virus proteins that are part of SA’s code to virus. And it would be very simple: You’d either swab the front of your nose or you’d take some saliva from under your tongue, for example, and put it onto one of these paper strips, essentially. And if you see a line, it means you’re positive. And if you see no line, it means you are negative, at least for having a high viral load that could be transmissible to other people.
An antigen is one of the proteins in the virus. And so unlike the PCR test, which is what most people who have received a test today have generally received a PCR test. And looking those types of tests look for the genome of the virus to RNA and you could think of RNA the same way that humans have DNA. This virus has RNA. But instead of looking for RNA like the PCR test, these antigen tests look for pieces of the protein. It would be like if I wanted a test to tell me, you know, that somebody was an individual, it would actually look for features like their eyes or their nose. And in this case, it is looking for different parts of the virus. In general, the spike protein or the nuclear capsid, these are two parts of the virus.
The reason that these antigen tests are going to be a little bit less sensitive to detect the virus molecules is because there’s no step that we call an amplification step. One of the things that makes the PCR test that looks for the virus RNA so powerful is that it can take just one molecule, which the sensor on the machine might not be able to detect readily, but then it amplifies that molecule millions and millions of times so that the sensor can see it. These antigen tests, because they’re so simple and so easy to use and just happen on a piece of paper, they don’t have that amplification step right now. And so they require a larger amount of virus in order to be able to detect it. And that’s why I like to think of these types of tests having their primary advantage to detect people with enough virus that they might be transmitting or transmissible to other people.”
Similar PCR tests for other viruses nearly always offer some measure of the amount of virus. But yes/no isn’t good enough, Mina added. “It’s the amount of virus that should dictate the infected patient’s next steps. “It’s really irresponsible, I think, to [ignore this]” Dr. Mina said, of how contagious an infected patient may be.
“We’ve been using one type of data for everything,” Mina said. “for [diagnosing patients], for public health, and for policy decision-making.”
The PCR test amplifies genetic matter from the virus in cycles; the fewer cycles required, the greater the amount of virus, or viral load, in the sample. The greater the viral load, the more likely the patient is to be contagious.
This number of amplification cycles needed to find the virus, called the cycle threshold, is never included in the results sent to doctors and coronavirus patients, although if it was, it could give them an idea of how infectious the patients are.
One solution would be to adjust the cycle threshold used now to decide that a patient is infected. Most tests set the limit at 40, a few at 37. This means that you are positive for the coronavirus if the test process required up to 40 cycles, or 37, to detect the virus.
Any test with a cycle threshold above 35 is too sensitive, Juliet Morrison, a virologist at the University of California, Riverside told the New York Times. “I’m shocked that people would think that 40 could represent a positive,” she said.
A more reasonable cutoff would be 30 to 35, she added. Dr. Mina said he would set the figure at 30, or even less.
Another solution, researchers agree, is to use even more widespread use of Rapid Diagnostic Tests (RDTs) which are much less sensitive and more likely to identify only patients with high levels of virus who are a transmission risk.
Comment: In other words, when they analyzed the tests that also reported cycle threshold (CT), they found that 85 to 90 percent were above 30. According to Dr. Mina a CT of 37 is 100 times too sensitive (7 cycles too much, 2^7 = 128) and a CT of 40 is 1,000 times too sensitive (10 cycles too much, 2^10 = 1024). Based on their sample of tests that also reported CT, as few as 10 percent of people with positive PCR tests actually have an active COVID-19 infection. Which is a lot less than reported.
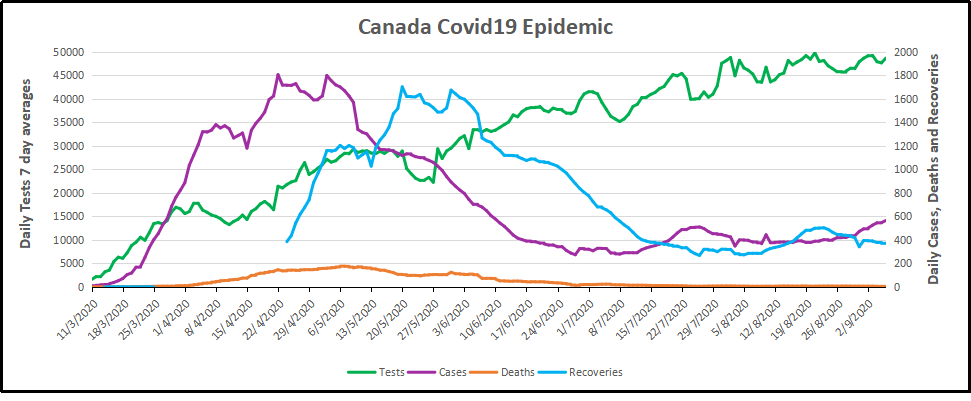
Here is a graph showing how this applies to Canada.
It is evident that increased testing has resulted in more positives, while the positivity rate is unchanged. Doubling the tests has doubled the positives, up from 300 a day to nearly 600 a day presently. Note these are PCR results. And the discussion above suggests that the number of persons with an active infectious viral load is likely 10% of those reported positive: IOW up from 30 a day to 60 a day. And in the graph below, the total of actual cases in Canada is likely on the order of 13,000 total from the last 7 months, an average of 62 cases a day.
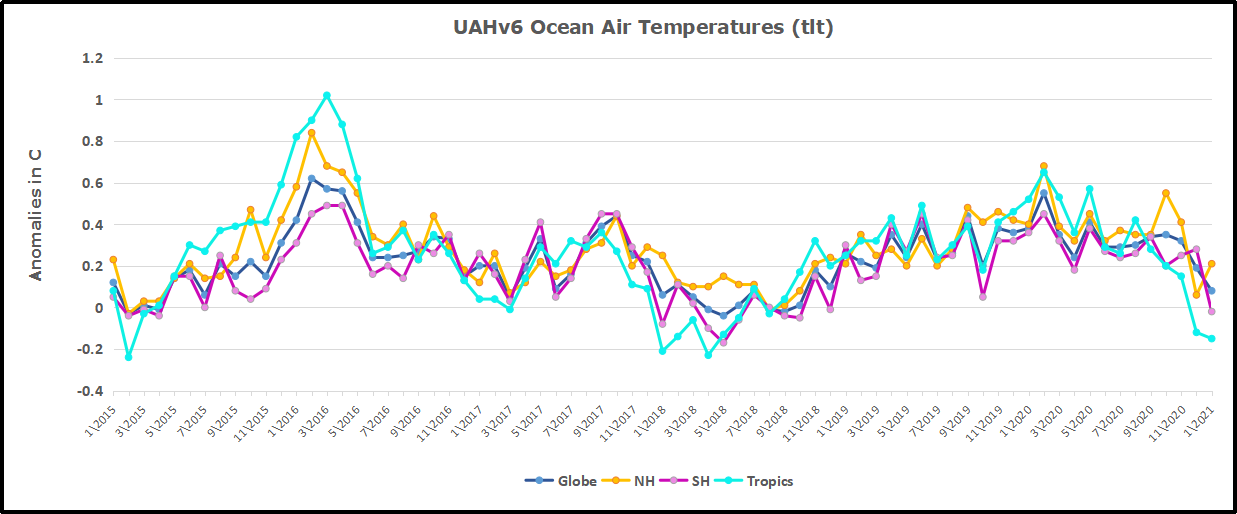
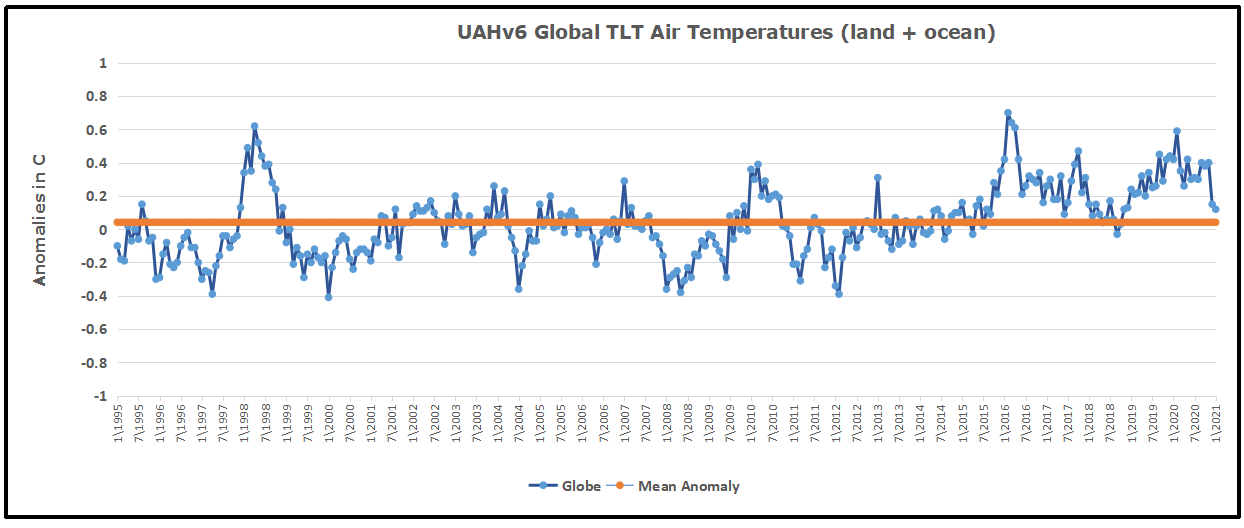
With apologies to Paul Revere, this post is on the lookout for cooler weather with an eye on both the Land and the Sea. While you will hear a lot about 2020 temperatures matching 2016 as the highest ever, that spin ignores how fast is the cooling setting in. The UAH data analyzed below shows that warming from the last El Nino is now fully dissipated with all regions heading down.
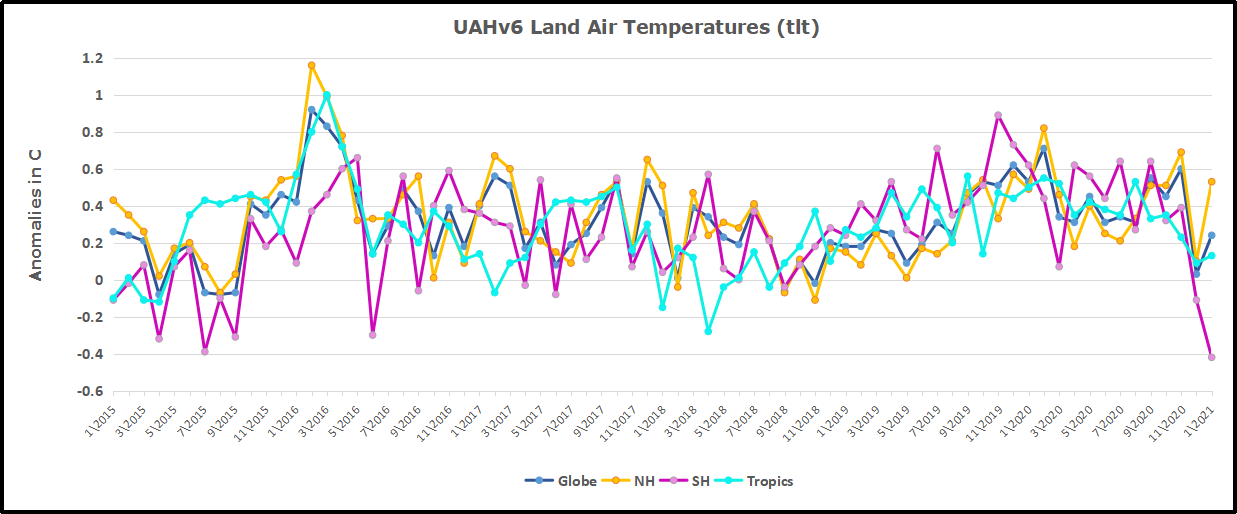
UAH has updated their tlt (temperatures in lower troposphere) dataset for January. Previously I have done posts on their reading of ocean air temps as a prelude to updated records from HADSST3. This month also has a separate graph of land air temps because the comparisons and contrasts are interesting as we contemplate possible cooling in coming months and years.
Note: UAH has shifted their baseline from 1981-2010 to 1991-2020 beginning with January 2021. In the charts below, the trends and fluctuations remain the same but the anomaly values change with the baseline reference shift.
Presently sea surface temperatures (SST) are the best available indicator of heat content gained or lost from earth’s climate system. Enthalpy is the thermodynamic term for total heat content in a system, and humidity differences in air parcels affect enthalpy. Measuring water temperature directly avoids distorted impressions from air measurements. In addition, ocean covers 71% of the planet surface and thus dominates surface temperature estimates. Eventually we will likely have reliable means of recording water temperatures at depth.
Recently, Dr. Ole Humlum reported from his research that air temperatures lag 2-3 months behind changes in SST. He also observed that changes in CO2 atmospheric concentrations lag behind SST by 11-12 months. This latter point is addressed in a previous post Who to Blame for Rising CO2?
After a technical enhancement to HadSST3 delayed March and April updates, May resumed a pattern of HadSST updates mid month. For comparison we can look at lower troposphere temperatures (TLT) from UAHv6 which are now posted for January. The temperature record is derived from microwave sounding units (MSU) on board satellites like the one pictured above. Recently there was a change in UAH processing of satellite drift corrections, including dropping one platform which can no longer be corrected. The graphs below are taken from the new and current dataset.
The UAH dataset includes temperature results for air above the oceans, and thus should be most comparable to the SSTs. There is the additional feature that ocean air temps avoid Urban Heat Islands (UHI). The graph below shows monthly anomalies for ocean temps since January 2015.
To enlarge open image in new tab.
Note 2020 was warmed mainly by a spike in February in all regions, and secondarily by an October spike in NH alone. End of 2020 November and December ocean temps plummeted in NH and the Tropics. In January SH dropped sharply, pulling the Global anomaly down despite an upward bump in NH. Both SH and the Tropics are now as cold as any time in the last five years, and all regions are comparable to to 2015 prior to the 2016 El Nino event.
Land Air Temperatures Tracking Downward in Seesaw Pattern
We sometimes overlook that in climate temperature records, while the oceans are measured directly with SSTs, land temps are measured only indirectly. The land temperature records at surface stations sample air temps at 2 meters above ground. UAH gives tlt anomalies for air over land separately from ocean air temps. The graph updated for January is below.
Here we have fresh evidence of the greater volatility of the Land temperatures, along with an extraordinary departure by SH land. Land temps are dominated by NH with a 2020 spike in February, followed by cooling down to July. Then NH land warmed with a second spike in November. Note the mid-year spikes in SH winter months. In December all of that was wiped out. Then January showed a sharp drop in SH, but a rise in NH more than offset, pulling the Global anomaly upward. All regions are roughly comparable to early 2015, prior to the 2016 El Nino.
The Bigger Picture UAH Global Since 1995
The chart shows monthly anomalies starting 01/1995 to present. The average anomaly is 0.04, since this period is the same as the new baseline, lacking only the first 4 years. 1995 was chosen as an ENSO neutral year. The graph shows the 1998 El Nino after which the mean resumed, and again after the smaller 2010 event. The 2016 El Nino matched 1998 peak and in addition NH after effects lasted longer, followed by the NH warming 2019-20, with temps now returning again to the mean.
TLTs include mixing above the oceans and probably some influence from nearby more volatile land temps. Clearly NH and Global land temps have been dropping in a seesaw pattern, more than 1C lower than the 2016 peak. Since the ocean has 1000 times the heat capacity as the atmosphere, that cooling is a significant driving force. TLT measures started the recent cooling later than SSTs from HadSST3, but are now showing the same pattern. It seems obvious that despite the three El Ninos, their warming has not persisted, and without them it would probably have cooled since 1995. Of course, the future has not yet been written.
Among those who’ve watched the tragic and needless lockdowns unfold over the last 11 months, a frequent question has come up: what if the coronavirus had spread, but had never been diagnosed or detected? Would life have been any different absent the discovery of what has caused a massive global panic among politicians?
It’s not an unreasonable question. Really, ask yourself what politicians and nail-biting media members would have done 100 years ago if the virus had revealed itself. Since work was a destination for realistically everyone, there’s no way there could have been lockdowns. People would have revolted.
As for deaths, life expectancy was already relatively low in the 1920s. This is relevant when it’s remembered that the coronavirus in a death sense has largely been associated with nursing homes. These homes weren’t very common one hundred years ago, and they weren’t mainly because pneumonia, tuberculosis and other major killers had a tendency to get to us long before we reached old age. Translated, there likely weren’t enough old people in the 1920s for the virus to have had any kind of lethal impact.
Due to a lack of old people, the virus perhaps wouldn’t have been discovered in the first place. Think about it.
As this column has long stated, the coronavirus is a rich man’s virus. It’s not just that the rich and generally well-to-do had portable jobs that mostly survived the mindless lockdowns., it’s not just that the break from reality we were forced to endure could have only happened in a rich country, it’s also the case that only in a country and world in which the elderly are truly old would the virus have any notable association with death. People live longer today, and they do because major healthcare advances born of wealth creation made living longer possible. We wouldn’t have noticed this virus 100 years ago. We weren’t rich enough.
Which brings us to a recent article by Leah Rosenbaum at Forbes. She wrote about a NIH paper indicating that almost 17 million coronavirus cases went uncounted last summer. In Rosenbaum’s words, this discovery “suggests the pandemic was much more widespread in the U.S. than previously thought.” Well, of course.
Lest readers forget, the virus began spreading sometime in the fall of 2019, if not sooner. The epicenter is widely thought to have been China, and flights between the U.S. and China, along with flights from China to the rest of the world, were rather numerous right up until 2020.
Considering how connected China was and still is to the rest of the world, logic dictates that the virus was infecting people globally long before politicians panicked. In that case, it’s not surprising that estimates made about the number of infected Americans were always way too low. The virus is said to spread easily, even easier than the flu, and it once again started working its way around the world sometime in 2019.
Notable about its rapid spread is that life went on as it made its way around the world.
As the closing months of 2019 make plain, people lived with the virus. What is most lethal to older people isn’t much noticed by those who aren’t old. A rapidly spreading virus was seemingly not much of a factor until politicians needlessly made it one.
Indeed, a virus most lethal to the very old has meek qualities when met by younger people. If they’re are infected with it, all-too-many don’t find the symptoms worrisome enough that they actually get tested.
That’s what Rosenbaum’s report seems to indicate. The NIH study covered blood tests of 11,000 Americans who hadn’t been previously diagnosed with Covid-19. 4.6% of the participants had Covid-19 antibodies, but their actual infection phase was never apparent to them. This is what Holman Jenkins has been pointing out all along. The number of those infected has always well exceeded estimates precisely because the symptoms of infection haven’t been worth going to the doctor over for the vast majority of those infected.
Looking back 100 years once again, ask yourself how many would have consulted a doctor then if something resembling the coronavirus had been spreading. Or better yet, ask yourself how many would have been tested in a U.S. that was quite a bit poorer relative to today. The questions answer themselves.
The virus would have spread rapidly within a younger population in the 1920s, and infected people would have developed immunity.
From Rosenbaum’s report it’s not unreasonable to speculate that far more Americans are immune to the virus than is known, and that the best approach all along would have been freedom. Let people live their lives. More important, let them get infected. For centuries they’re pursued immunity by – gasp – infecting one another.
So, what would have happened if the coronavirus had gone undetected? We will never know, but it’s not unrealistic to conclude that we have an idea. The virus didn’t suddenly start spreading in March of 2020 just because politicians decided it had. 2019 is the likelier beginning. Early 2020 too. Life was pretty normal as a virus made its way around the world then.
Politicians made it abnormal. Let’s never forget the sickening carnage they can create when they find reasons to “do something.”
My Comment: An additional point seen in the history of environmental scares is that mass media first frightens the public, and then politicians have to be seen “doing something.” And as we are seeing now, they have difficulty to stop those things even when shown to be ineffective and harmful on top.
Perhaps you noticed how public health officials direct the war on coronavirus. The generals obsess over “cases” and “deaths” while hiding numbers of “recoveries” and “cures.” The military paradigm has led pandemic policies seriously astray, as explained by Norman Doidge in his Tablet article Mad Science, Sane Science. Excerpts in italics with my bolds.
There are more reasonable approaches to science and COVID-19 than the ‘eradication’ mentality that we lean on.
One cannot underestimate the extent to which modern medicine took up Bacon’s military metaphor of conquest and applied it to itself. This involved rejecting the ancient Hippocratic idea of healing, which—being part of that Greek worldview that saw us as of nature, and not against it—saw the physician as trying to work in alliance with nature, the patient (mind and body and spirit) and the patient’s family. But by the mid-1600s Thomas Sydenham, who became known as the “English Hippocrates,” saw medicine in a new way: “I attack the enemy within by means of cathartics and refrigerants, and by means of a diet”; he wrote, “a murderous array of disease has to be fought against, and the battle is not a battle for the sluggard …” Little has changed since. We see ourselves as engaged in endless wars: “The war against the virus,” “the war against cancer,” or against AIDS, “the war on drugs,” the “battle against heart disease,” we “combat” Alzheimer’s, and so on. As modern physicians came to see themselves as warriors and disease as “the enemy,” treatments became “weapons,” and drugs went from being healing potions to “magic bullets” and vaccines became “shots.”
We combat the enemy with “doctor’s orders,” from the medical “armamentarium,” or “arsenal” as we physicians call our bag of therapeutic tricks.
This military metaphor in medicine gives rise to a mentality that esteems invasive high-tech treatments as somehow more serious than less invasive ones—any collateral damage be damned. Of course, there is a time for a martial attitude in medicine, as, say, in emergencies: If a blood vessel in the brain bursts, the patient needs invasive surgery and a neurosurgeon with nerves of steel, to operate. But there are times when it sets us back. Today, rather than work with the patient as a key ally, we physicians often barely have time to listen to him or her speak. In this metaphor, the patient’s body is less an ally than the battlefield, and the patient is rendered passive, a helpless bystander, as he watches the confrontation that will determine his fate between the two great antagonists, the doctor (plus the scientific research establishment) and the disease (or pathogen). And of course, in the “war against the virus,” it is total “eradication” of such an enemy that is the goal. That, it would seem to us, Bacon’s offspring, as the only sensible approach.
As it turns out, so much of what ails us today are products of modern science and technology gone wild: lethal antibiotic-resistant organisms that our “total eradication of disease mentality” produced because we vastly overused the antibiotics we had (which, by the way, were originally natural products of nature, not the lab); pollution (of every element), chemicals in our baby food, toys, floors, and mattresses causing skyrocketing childhood illnesses; bioterrorism; loss of biodiversity affecting the food chain; fabulous totalitarian surveillance tools called cellphones, global networks that allow our enemies thousands of miles away to reach into the controls of our electrical grids, water systems, food delivery systems, banks, nuclear systems, computers, and control them, turning them on and off with a keystroke; 3D printers to make assault weapons in the basement, nuclear weapons to empower lunatics, industrialized death camps with cyanide showers, and, not to mention man-made environmental disruptions causing ecological catastrophes.
On this list of course, is also a pandemic that spread so rapidly because of air travel, and the “efficient” design of our urban centers which maximize overcrowding—and a microbe that may have originated in a lab known to be unsafe, and experimenting with bat viruses. “Just last year,” an article in Newsweek reported, “the National Institute for Allergy and Infectious Diseases, the organization led by Dr. Fauci, funded scientists at the Wuhan Institute of Virology and other institutions for work on gain-of-function research on bat coronaviruses.”
“Gain-of-function research” in this case means augmenting the virus’s contagiousness, and even lethality for the purpose of getting a head start on developing therapeutics or vaccines should it mutate in that direction. Such research is also the meat and potatoes germ-warfare research.. . . Whether or not Wuhan’s gain-of-function work involved creating an artificially enhanced coronavirus has been made almost impossible for outsiders to ascertain, because that lab’s government conveniently insisted it destroy its virus samples and records before an outside investigation could be done.
We are so reliably surprised and caught off guard by the unforeseen consequences of our technologies, and there are now so many serious cases of “science going wrong,” that it might be argued that, in practice, modern science (and the tech it produces) seems to be a machine designed to generate and maximize unintended consequences. And is hence, along with being powerful, also, quite often, ridiculous.
All of this is relevant to the current pandemic. In a way, there are three grand “strategies” to deal with a pandemic. But only one of them indulges the more lunatic strains of military metaphor in medicine.
The first strategy is never let it in.
The second, the approach most widely used at present, is to go to rather blunt lockdowns, while we develop therapeutics and vaccines to eradicate the virus.
The third is to resist lockdowns whenever possible, and instead focus on more differentiated measures than total societal closures, again while we develop therapeutics and vaccines to eradicate the virus.
If the virus doesn’t get in, people are not dying, there isn’t talk of eradication and the military metaphor isn’t used. That strategy has worked so far in Nauru, an island speck, in the paradise of Oceania, a country that is isolated, and small enough to walk across and around in one day, and which, along with Oceania’s Tuvalu, is tied for the record as being the least visited country in the world.
Even the relatively isolated, double-island paradise of New Zealand, was still too connected with the rest of the world to keep the virus out. When it did arrive there, New Zealand tried the second strategy, to eradicate it with a blunt lockdown.
The military metaphors began. Prime Minister Jacinda Ardern set the goal of “complete elimination of the virus.” France’s President Emmanuel Macron said, “We are at war … The enemy is there—invisible, elusive—and it is advancing.” Donald Trump described himself as “a wartime president.” War requires emergency measures, which require emergency powers, which demand the immediate suspension of civil liberties—with executives not bothering to go to legislatures because the enemy is coming at us “in waves,” and “surges,” is “killing us in droves.” We “hunker in our bunkers”—in total lockdown. Home’s the only place that’s safe. We must “mobilize” all society in immobility. Punish those who disobey orders. We do it, too, for the health care workers, the heroes on “the frontline,” who risked their lives.
But these undeniable similarities do not mean that medicine is war, any more than war is healing.
Perhaps the biggest problem with the military metaphor, is how it causes us to narrow our focus almost exclusively on “eradicating the virus,” and “cases of the infected.” This causes us to miss other important ways of dealing with it, that might help us survive it. Public health officials in the “the eradication mode” almost never mention how we can boost our immune systems with vitamins D and C, and zinc, exercise and weight loss. Not their focus. And the narrow focus on eradicating the virus is now causing serious “collateral” harm and death.
But it was not maliciousness but rather the virus eradication mindset that has caused much of the harm. That mindset has led many politicians, and also public health officials, to become oblivious to the death, illness, and devastation that have resulted from the lockdowns. Tedros’ own language speaks this obliviousness, when he says he knows people are “understandably frustrated with being confined to their homes” as though “frustration” is the extent of the problem. What is actually happening is that people’s worlds are collapsing. Fauci early on called the lockdown measure “inconvenient.”
Tedros and other lockdown supporters are almost all themselves employed, and working comfortably, many from home.
They are part of a class that has government, bureaucratic, educational, media, and corporate salaries, or are in Big Tech, which thrives in lockdown. With an often staggering indifference, they gloss over that fact that the measures they recommend “for all of us” are devastating to those working-class people, the poor, and small-business owners who are losing or have already lost their life savings, health insurance, health, and who are at risk of, or who have already been evicted from their apartments. By September we knew that nearly 60% of (mostly small) businesses that had been forced to close in lockdown were destroyed so their workers would have no jobs to return to. Many more have gone under since. They were closed by often illegal edicts, that left their large corporate competitors like Costco and Walmart open. Thus, instead of going to small widely separated community stores, that admitted a few at a time, people crowded into a few stores without social distancing—the complete reverse of a sensible, scientifically based policy. How did public health officials get away with destroying small business? This is war! Ignore that a meta-analysis of 10 countries and their regions, shows that during last spring, stringent stay and home and business closures did no better in slowing the virus than those that rely on voluntary measures (such as hand washing, social distancing, discouraging travel and large gatherings, successful case tracking, and testing). Gov. Andrew Cuomo’s own latest scientific statistics confirm that 74% of all New York COVID-19 transmission comes from indoor gatherings in private homes, and only 1.4% from in-restaurant dining (all set up for COVID now). The commander in chief says no to indoor restaurant dining in December. Now, even the WHO, which supported lockdowns, is claiming that closed Western economies are devastating poorer countries that are trading partners, and its special envoy for COVID-19, Dr. David Nabarro, has said the WHO anticipates a doubling of world poverty and a doubling of childhood malnutrition because of lockdowns.
The officials, blinded by the eradication at all costs mentality, discarded the practical wisdom required to respond to such a crisis, and endorsed an intervention that defies the standard public health practice of taking a holistic approach and always taking into account a measure’s total effects, and not just its immediate effects on the pathogen labeled as “the invisible enemy.”
“COVID denial” is real. So is “COVID-management-induced-devastation denial.”
What does a scientific approach look like, one that takes the best of our modern instruments that Bacon helped to facilitate, but which does not get us tangled up in the military metaphor, or make delusional attempts to artificially cut us off from the rest of nature?
That would be the approach of Janelle Ayres, Ph.D., a brilliantly original and constructive molecular and systems physiologist, and expert in both immunology and evolution, who heads two labs affiliated with the Salk Institute. Ayres’ work opens up a radically different approach to infectious disease—radical in the original sense of the word, meaning having to do with the root, i.e., the broader biological foundations of infectious disease and health in the “biome,” the sphere of living organisms in which we dwell, and which dwell within us. Thus, to my mind, her work has echoes with some of the ancient insights and intuitions about biological interconnectedness, though I’ve not seen her make this claim.
Ayres’ work is helping us reconceive our relationship to microbial organisms, including pathogens, and showing how they can, for instance, influence our evolution, and we theirs, and it gives us a much more detailed picture of how we actually survive serious infections. She happens to have written one of the best articles ever on COVID-19, that shows a breadth and depth of biological comprehension that is extremely rare among modern scientists who are often specialists in very circumscribed areas, who analyze things into ever smaller parts, and know an incredible amount about incredibly little. Ayres is both a first-rank specialist, and a big-think generalist.
She says, “The way we have been thinking about treating infectious diseases is that we have to annihilate the pathogens through vaccines and antimicrobials.” She completely reframes the problem, and challenges our thinking:
“Instead of asking how do we fight infections, we should be asking ‘how do we survive infections?’”
Changing that single word—“fight” to “survive”—transforms everything. Consider, for example, that new organisms, and strains are evolving all the time. A new coronavirus strain identified in December is said to be 70% more transmissible. Some new strains may be resistant to our existing vaccines and antivirals. Developing different antibiotics or vaccines to eradicate each of them, is not always possible, and when it is, generally takes a long time, and costs a fortune. But if, as is often the case, death is caused by our bodies’ own reactions to the infection, reactions which are very similar, regardless of the pathogen that caused them, learning to block the body from going into overdrive should help people survive multiple infections. As well, there is no reason to believe this approach will cause antibiotic-resistant, antiviral-resistant, or vaccine-resistant strains, because it is not targeting the pathogen per se.
In cooperative co-evolution, there is an incentive for us (or any infested animal) to develop methods to both prevent collateral damage to ourselves, as well as fix it when it occurs. That is the essence of the tolerance system. What Ayres and her colleagues are doing is describing these mechanisms—in minute molecular detail—in the body, and learning to read how organisms that are co-evolving with their hosts are communicating with them—sending signals back and forth. Ideally, the lab would ultimately learn how to use this information to enhance co-evolution in some way, to treat disease.
Ayres’ approach to COVID is not to minimize other approaches but point out that “if we can step beyond our focus on the virus,” there is much more we can learn. For instance, it was assumed early in the pandemic, that severe cases were caused by high viral load, and now we know it is the secondary collateral damage caused by our bodies that is the real killer.
Fewer and fewer medical schools now require the graduating physician to take the ancient Hippocratic oath, the first recorded articulation of medical ethics, that sanctified medical confidentiality and the idea that the doctor worked for his or her patient, and not a third party. How sad, how telling.
It is the same Hippocrates, who boiled all medicine down to two principles in his Epidemics Book I, “Practice two things in your dealing with disease: either help or do not harm the patient.”
And, in this light—of doing no harm, or at least far less—we might remember that we are part of nature, depend on it, it lives in us, and we have links to parts we think remote from us, that we often cannot even see. We might consider setting aside the utopian dream that always becomes a nightmare, because all too often we can’t conquer nature without conquering ourselves.
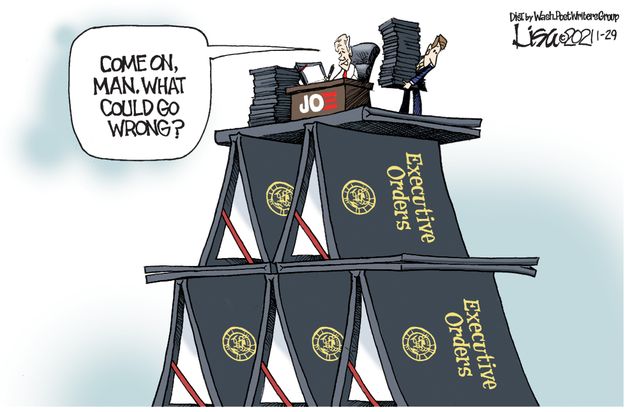


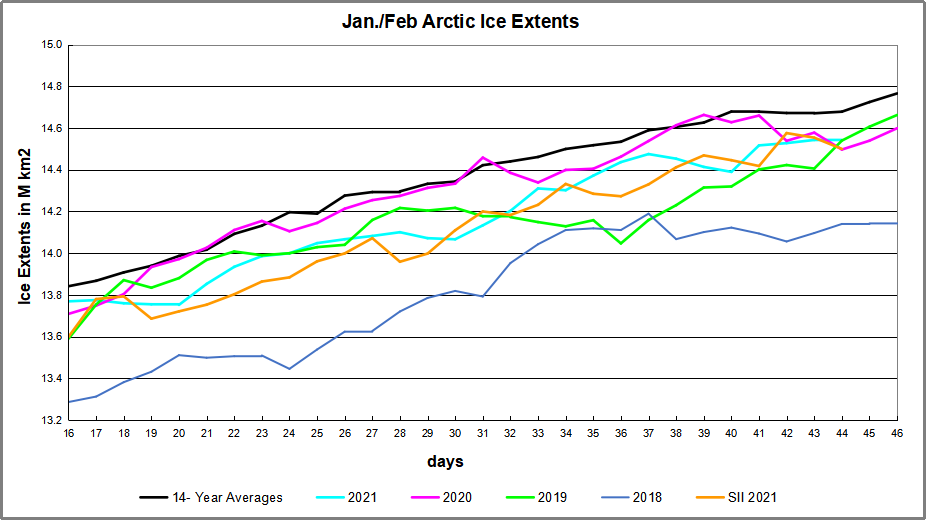


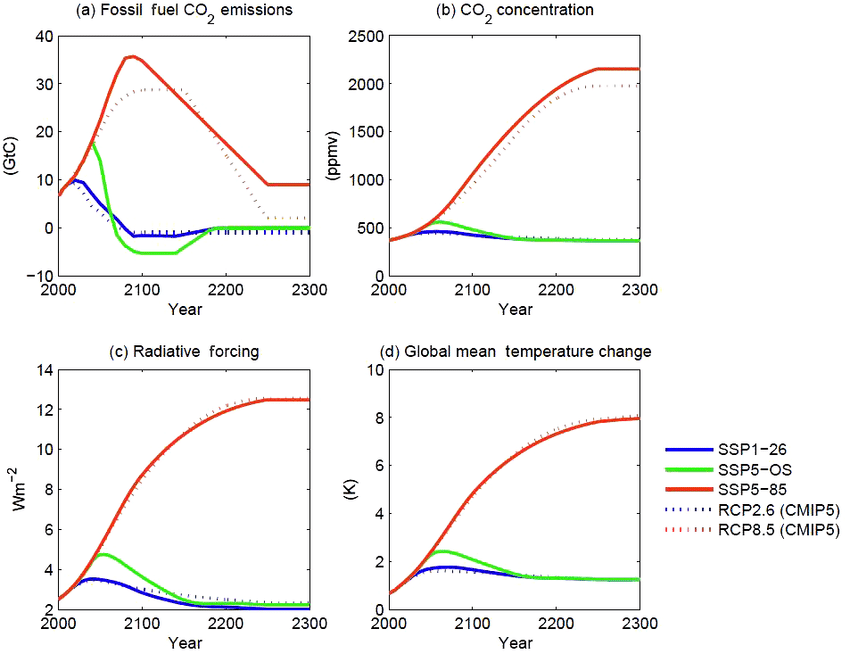
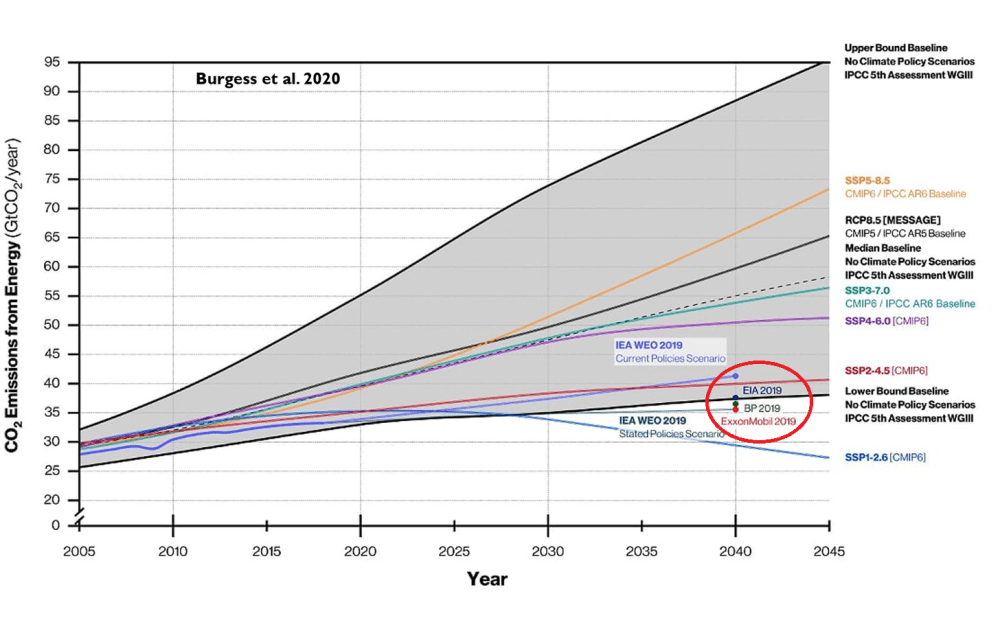
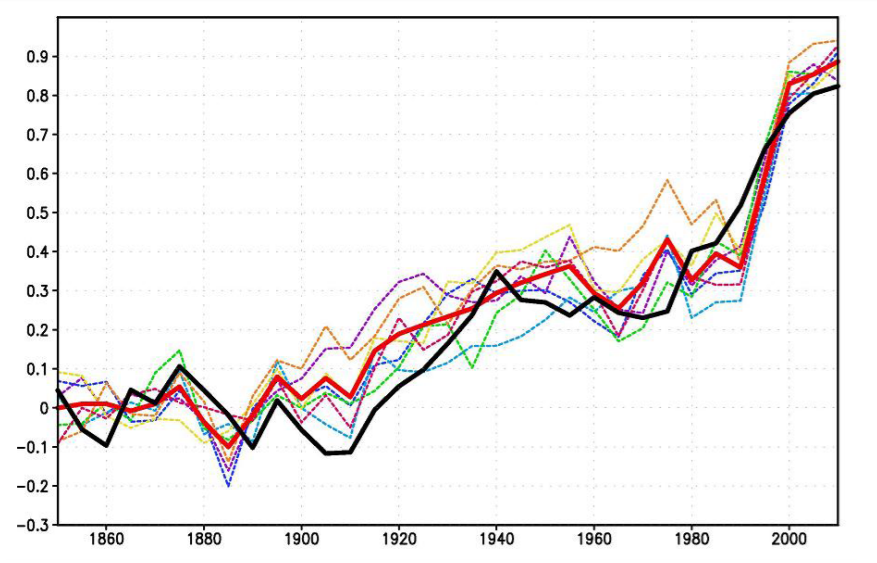
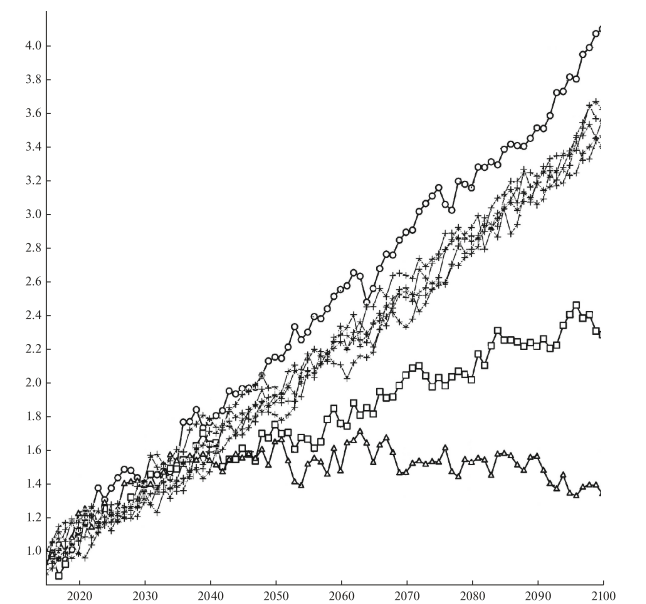
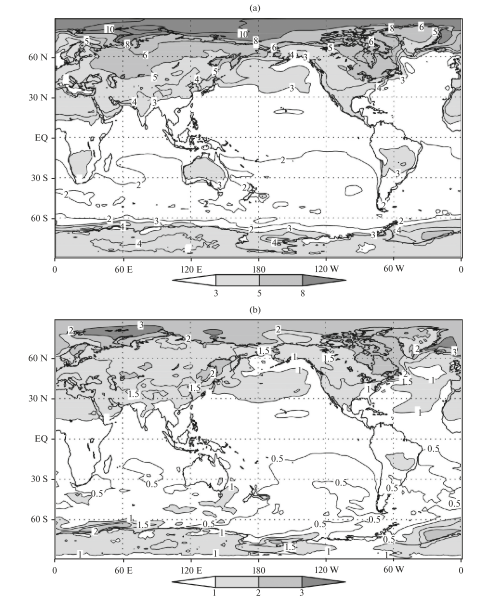


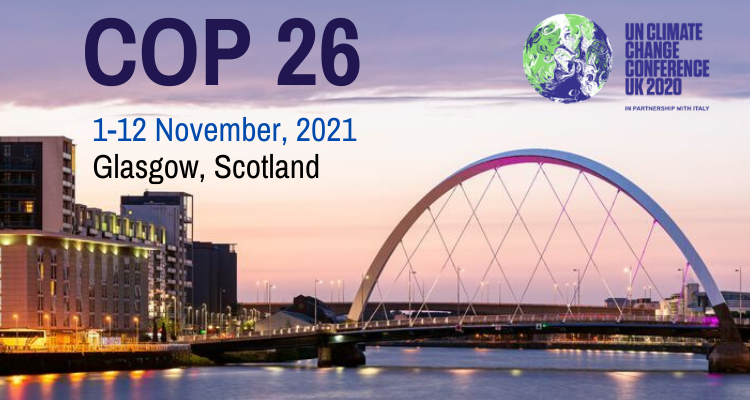


 But: Sea Level Rise is not accelerating.