 The images above come from AARI (Arctic and Antarctic Research Institute) St. Petersburg, Russia. Note how the location of remaining ice at start of August varies greatly from year to year. The marginal seas are open water, including the Pacific basins, Canadian Bays (Hudson and Baffin), and the Atlantic basins for the most part. Note ice extent fluctuations especially in Eurasian seas (lower right) and in Can-Am seas (upper right). Notice the much greater ice extent in 2022 compared to 2020. As discussed later on, some regions retain considerable ice at the annual minimum, with differences year to year. [Note: Images prior to 2008 are in a different format. AARI Charts are (here)

The annual competition between ice and water in the Arctic ocean is approaching the maximum for water, which typically occurs mid September. After that, diminishing energy from the slowly setting sun allows oceanic cooling causing ice to regenerate. Those interested in the dynamics of Arctic sea ice can read numerous posts here. This post provides a look at mid August from 2007 to yesterday as a context for anticipating this year’s annual minimum. Note that for climate purposes the annual minimum is measured by the September monthly average ice extent, since the daily extents vary and will go briefly lowest on or about day 260. In a typical year the overall ice extent will end September slightly higher than at the beginning.
The melting season mid July to mid August shows 2022 melted slower than average and the month end extents were much higher than average.
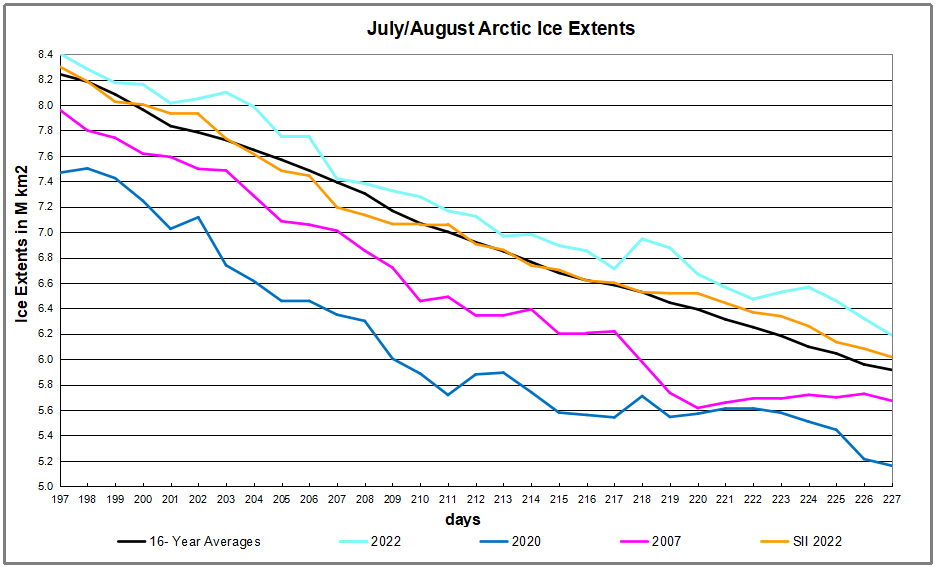
Firstly note that on average this period shows ice declining 2.3M km2 down to 5.9M km2. But 2022 started slightly higher and on day 227 was 273k km2 above average. The extents in Sea Ice Index in orange were somewhat lower during the period. The table for day 227 show how large are the 2022 surpluses and how the ice is distributed across the various seas comprising the Arctic Ocean. The surplus this year over 2020 is more than 1 Wadham (1M km2 ice extent).
| Region | 2022227 | Day 227 Average | 2022-Ave. | 2020227 | 2022-2020 |
| (0) Northern_Hemisphere | 6189078 | 5916128 | 272950 | 5162062 | 1027016 |
| (1) Beaufort_Sea | 887005 | 713937 | 173069 | 838854 | 48151 |
| (2) Chukchi_Sea | 494679 | 425089 | 69591 | 410757 | 83922 |
| (3) East_Siberian_Sea | 609573 | 566607 | 42966 | 276845 | 332728 |
| (4) Laptev_Sea | 291275 | 234785 | 56490 | 24033 | 267241 |
| (5) Kara_Sea | 60113 | 97484 | -37371 | 22002 | 38111 |
| (6) Barents_Sea | 0 | 25520 | -25520 | 3285 | -3285 |
| (7) Greenland_Sea | 227813 | 229100 | -1288 | 265814 | -38001 |
| (8) Baffin_Bay_Gulf_of_St._Lawrence | 135675 | 53150 | 82525 | 12720 | 122955 |
| (9) Canadian_Archipelago | 388671 | 420628 | -31957 | 366453 | 22218 |
| (10) Hudson_Bay | 19911 | 70416 | -50505 | 53142 | -33232 |
| (11) Central_Arctic | 3070974 | 3078423 | -7450 | 2887486 | 183487 |
The main deficit to average is in Hudson Bay, with smaller losses in CAA, Kara and Barents seas, overcome by surpluses almost everywhere, especially in BCE (Beaufort, Chukchi, East Siberian seas), as well as Laptev and Baffin Bay. And as discussed below, the marginal basins have little ice left to lose.
The Bigger Picture
We are close to the annual Arctic ice extent minimum, which typically occurs on or about day 260 (mid September). Some take any year’s slightly lower minimum as proof that Arctic ice is dying, but the image above shows the Arctic heart is beating clear and strong.
Over this decade, the Arctic ice minimum has not declined, but since 2007 looks like fluctuations around a plateau. By mid-September, all the peripheral seas have turned to water, and the residual ice shows up in a few places. The table below indicates where we can expect to find ice this September. Numbers are area units of Mkm2 (millions of square kilometers).
| Day 260 | 15 year | ||||||||||
| Arctic Regions | 2007 | 2010 | 2014 | 2015 | 2016 | 2017 | 2018 | 2019 | 2020 | 2021 | Average |
| Central Arctic Sea | 2.67 | 3.16 | 2.98 | 2.93 | 2.92 | 3.07 | 2.91 | 2.97 | 2.50 | 2.95 | 2.90 |
| BCE | 0.50 | 1.08 | 1.38 | 0.89 | 0.52 | 0.84 | 1.16 | 0.46 | 0.65 | 1.55 | 0.89 |
| LKB | 0.29 | 0.24 | 0.19 | 0.05 | 0.28 | 0.26 | 0.02 | 0.11 | 0.01 | 0.13 | 0.15 |
| Greenland & CAA | 0.56 | 0.41 | 0.55 | 0.46 | 0.45 | 0.52 | 0.41 | 0.36 | 0.59 | 0.50 | 0.47 |
| B&H Bays | 0.03 | 0.03 | 0.02 | 0.10 | 0.03 | 0.07 | 0.05 | 0.01 | 0.02 | 0.04 | 0.03 |
| NH Total | 4.05 | 4.91 | 5.13 | 4.44 | 4.20 | 4.76 | 4.56 | 3.91 | 3.77 | 5.17 | 4.44 |
The table includes two early years of note along with the last 8 years compared to the 15 year average for five contiguous arctic regions. BCE (Beaufort, Chukchi and East Siberian) on the Asian side are quite variable as the largest source of ice other than the Central Arctic itself. Greenland Sea and CAA (Canadian Arctic Archipelago) together hold almost 0.5M km2 of ice at annual minimum, fairly consistently. LKB are the European seas of Laptev, Kara and Barents, a smaller source of ice, but a difference maker some years, as Laptev was in 2016. Baffin and Hudson Bays are inconsequential as of day 260.

For context, note that the average maximum has been 15M, so on average the extent shrinks to 30% of the March high before growing back the following winter. In this context, it is foolhardy to project any summer minimum forward to proclaim the end of Arctic ice.
Resources: Climate Compilation II Arctic Sea Ice


It’s all bullshit started by Gore and governments to instill fear in the people and give governments excuses to increase taxes for their personal gain. Governments are all corrupt by suppressing the uneducated people. Wake up people
LikeLike
Ron,
Good article.
I smiled when I saw the Al Gore cartoon… as I had photoshopped a change to it several years ago:
In a few more years, I’ll have to make another change!
Best,
Bob Webster, author Looking Out The Window https://www.amazon.com/Looking-out-Window-Responsible-Changing/dp/1662429207/ref=sr_1_1?crid=30XOIGYR9SP91&keywords=looking+out+the+window,+bob+webster&qid=1660772218&s=books&sprefix=Looking+Out+The+,stripbooks,72&sr=1-1 / Are Humans Really Responsible for Climate Change? / The Trial of Carbon Dioxide in the Court of Public Opinion
>
LikeLike