John Christy: The Climate Real Deal

BizNews TV interviewed Dr. John Christy last week as shown in the video above.  For those who prefer to read what was said, I provide a lightly edited transcript below in italics with my bolds and added images.  BN refers to questions from the interviewer and JC refers to responses from Christy.

BN: Joining me today is Dr John Christy, climate scientist at the University of Alabama in Huntsville and Alabama State climatologist since 2000. Dr Christy, thank you so much for your time. You’ve described yourself as a climate nerd and apparently you were 12 when your unwavering desire to understand weather and climate started. Why climate?

JC: Well I think it was more like 10 years old when I was fascinated with some unusual weather events that happened in my home area of California. So that began a fascination for me, and I wanted to try to figure out why things happen the way they did. Why did one year have more rain–that’s a big story in California, does it rain or not–and another year would be very dry. Why were the mountains covered with snow in one April and not another. In fact I have here April 1967 that I recorded as a teenager. This has been a passion of mine forever, and as it turns out now that I’m as old as I am, I still can’t figure out why one year is wetter than the other.

BN: Well you seem to be getting a lot closer than most people would. I think it was in 1989 when you and NASA scientist Roy Spencer pioneered a new method of measuring and monitoring temperature records via satellites, since that time up until now. Why did you feel you needed to develop a new method to begin with, and how did it differ in terms of the readings of established methods at the time?

JC: Well the issue was we only had surface temperature measurements and they are scattered over the world. They don’t cover much of the world at all, actually mainly just the land regions and scattered places on the ocean. And the measurement itself is not that robust. The stations move, the instruments changed through time, and so it’s a very difficult thing to detect. In fact a small little change in the area right around the station can really affect the temperature of that station

So Roy Spencer and Dick Mcknight came up with an idea about looking at some satellite data. This is the temperature of the deep layer of the atmosphere, so this is like the surface to about 8000 meters. And so if we could see the temperature of that bulk atmospheric layer, we would have a very robust measurement, and the microwave sensors on the NOAA Polo orbiting satellites did precisely that. And so we were the first to really put those data into a simple data set that had the temperature, at that time, for month by month since about November 1978.

BN: Okay, and how do readings differ from the climate science at the time?

JC: First of all they differed because we had a global measurement. We really did see the entire Globe from satellite, because the orbit of that satellite is polar and the Earth spins around underneath. So every day we have 14 orbits as the Earth spins around underneath. We see the entire planet so that’s one big difference.

The other one is that the actual result did not show as much warming as what the surface temperatures showed. And we’re doing even more work now to demonstrate that a lot of the surface stations are spuriously affected by the growth of an infrastructure around them. And so there’s kind of a false warming signal there. You don’t get the background climate signal with surface temperature measurements; you get a bit of what’s happening in the local area.

BN: Your research has to do with testing the theories posited by climate model forecasts, so you don’t actually do any modeling yourself. But what criteria do you use to test these theories?

JC: That’s a very good question, because in climate you hear all kinds of claims and theories being thrown out there. For a lot of people who don’t really understand the climate system it’s a quick and easy answer just to say: Oh humans caused that, you know it’s global warming, something like that is the answer. When in fact the climate system is very complex, so we look at these claims and Roy Spencer and I are just a few of the people around the world that actually build data sets from scratch. I mean we start with the photon counts of the satellite radiometers, or the original paper records of 19th century East Africa, for example. We do all this from scratch so that we can test the claims that people make.

Once we build the data set, we test it to make sure we have confidence in the data set, that it’s telling us a truth about what’s happening over time. And then we check the claim. So for example, we make surface temperature data sets that go back to the 19th century. Someone will say: Well this is now the hottest decade, or that more records happen this decade than in the past. And we can demonstrate, in the United States especially, that’s not the case. You would need to go back to the 1930s if you want to see real record temperatures that occurred at that time.

And for climate models we like to use the satellite data set since it’s a robust deep layer measurement; it’s measuring lots of mass of the atmosphere, the heat content really. That’s a direct value we can get out of the climate model, so we are comparing Apples to Apples: What the satellite produces and observes is what the climate model also generates, and we can compare them one to one.

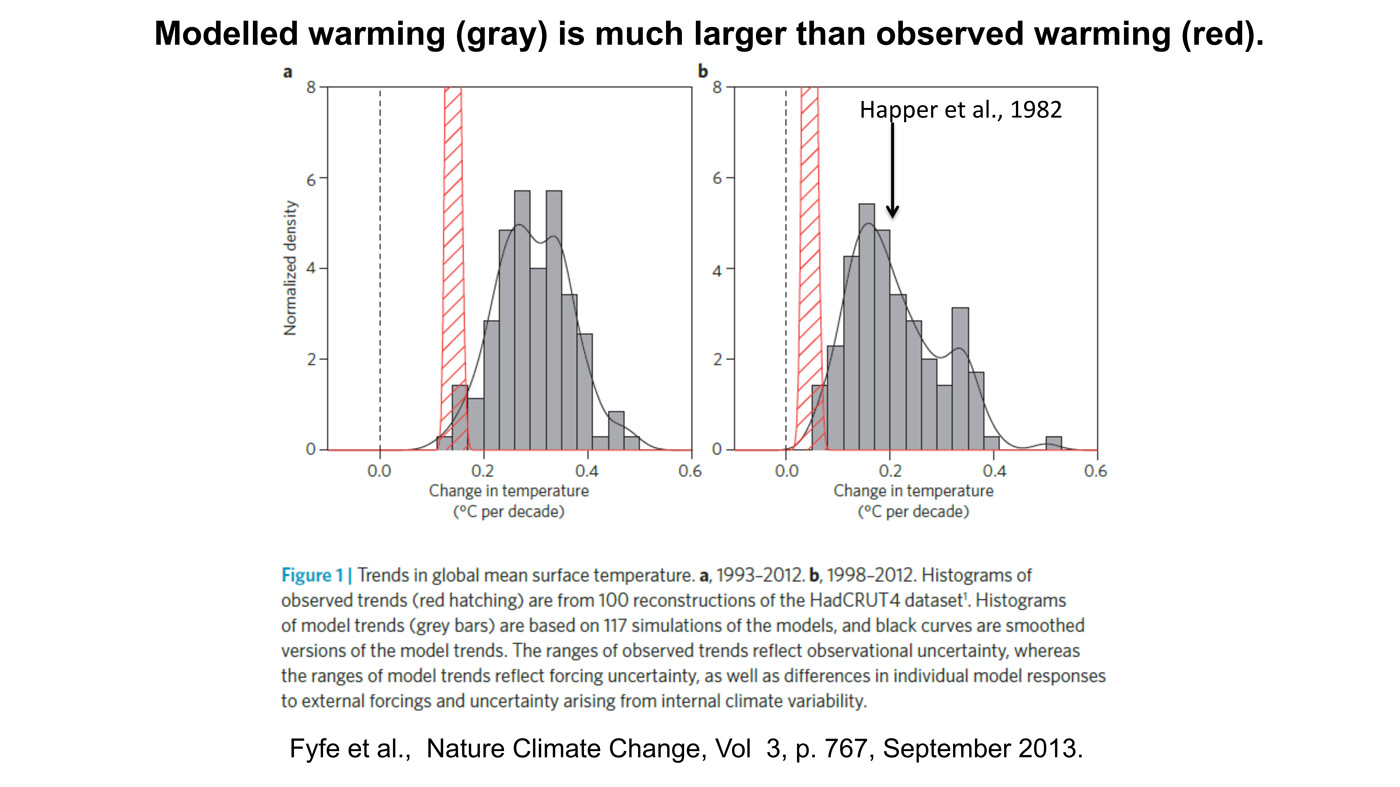
In a paper Ross McKitrick and I wrote a couple of years ago, we found that 100 of the climate models we’re warming the atmosphere faster than it was actually warming. So that’s not a good result if you’re trying to test your theory of how the climate works with the model against what actually happens.

BN: How much do you think the deeply over-exaggerated predictions of Doom and Gloom have to do with the methodology substantiated by confirmation bias?

JC: That’s an interesting question because we’re a bit confused as well. We have been publishing these papers since 1994 that have demonstrated models warm too much relative to the actual climate, and yet we don’t see an improvement in climate models and trying to match reality with their model output. Now I think a number of modelers understand that: yes the there is a difference there and the models are just too hot. But what is the process that’s gone wrong in the models is a difficult question for these folks. Because models have hundreds of places you can turn a little knob, change a coefficient, and that will change the result. It’s not a physical thing, it’s not based on physics; it’s the model parameterizations— the little pieces of the model that try to represent an actual part of the atmosphere. For example, when do clouds form? That’s a pretty big question. How much humidity in the atmosphere is required to create a cloud? Because once the cloud forms it reflects sunlight and cools the Earth. So that’s it that’s one of the big questions.

So in testing the models we like to use the bulk atmospheric temperature; it’d a very direct measurement that models produce and so we can then say there’s a problem here with climate models.

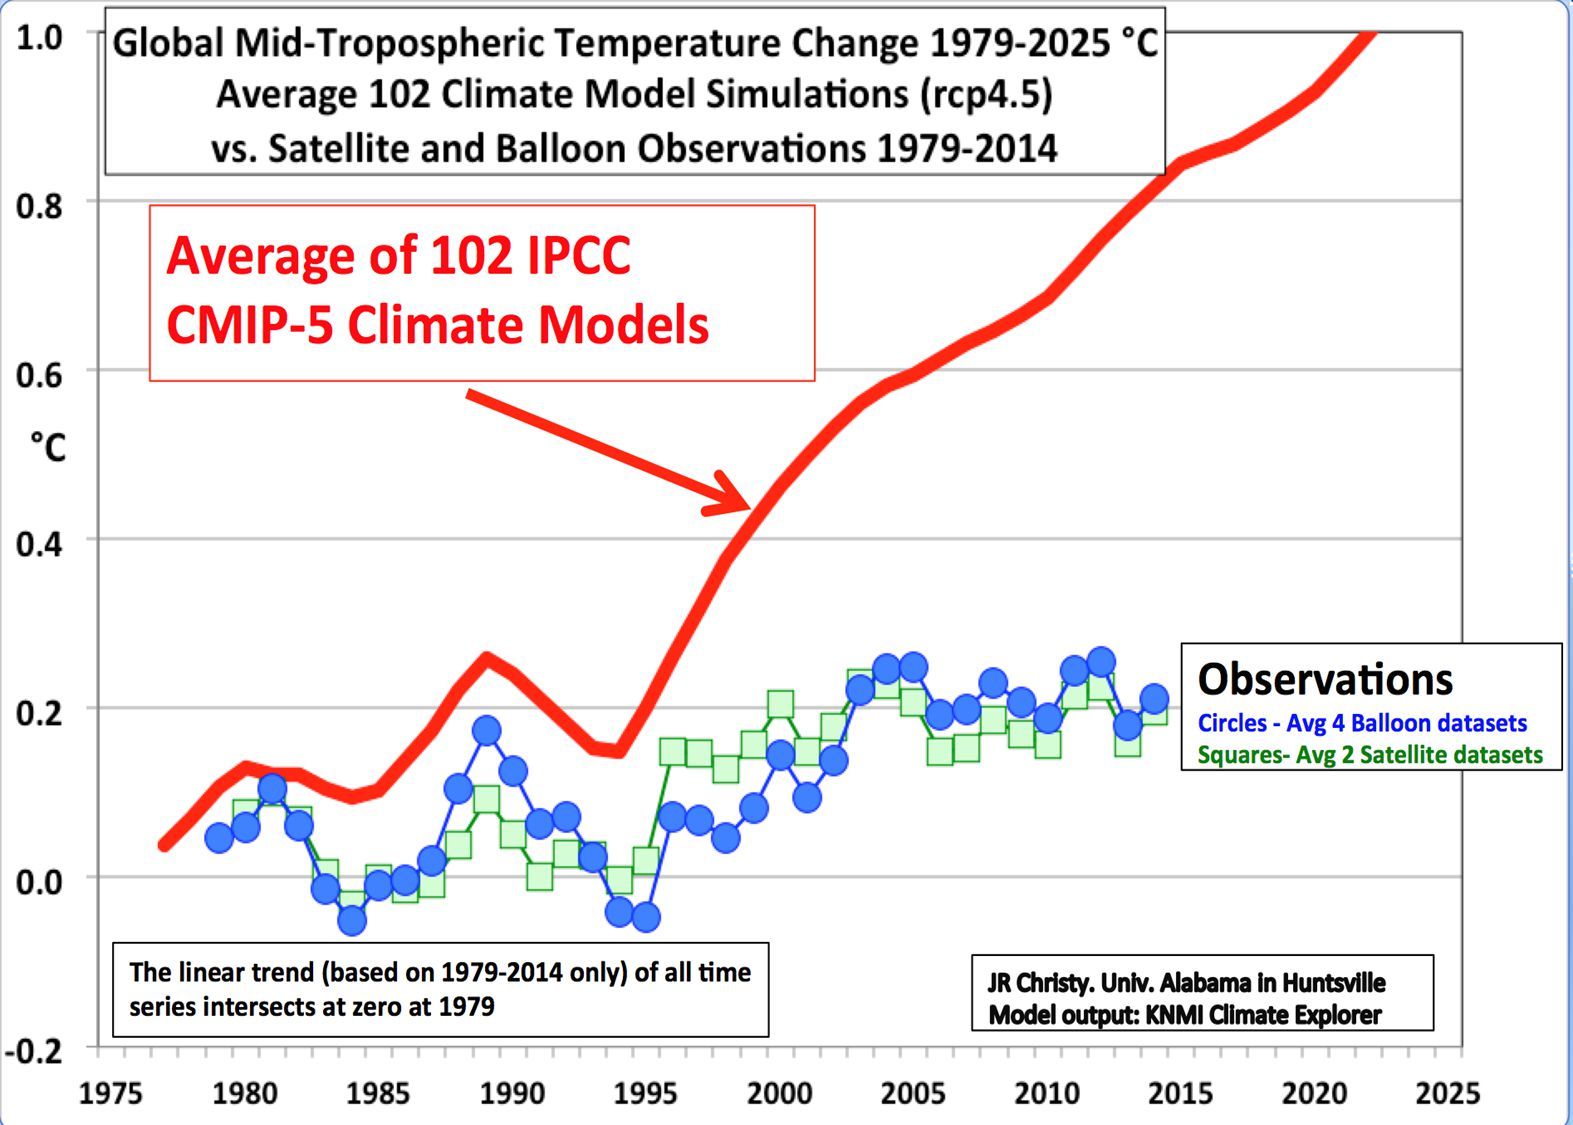
BN: To what degree did your observation on data differ from their forecasts?

Generally it’s about a factor of two. At times it’s been more, but on average the latest models (CMIP6) for the Deep layer of the atmosphere are warming about twice too fast, and that’s a real problem. I think when now we’re looking at over 40 years with which we can test these models, and they’re already that far off.

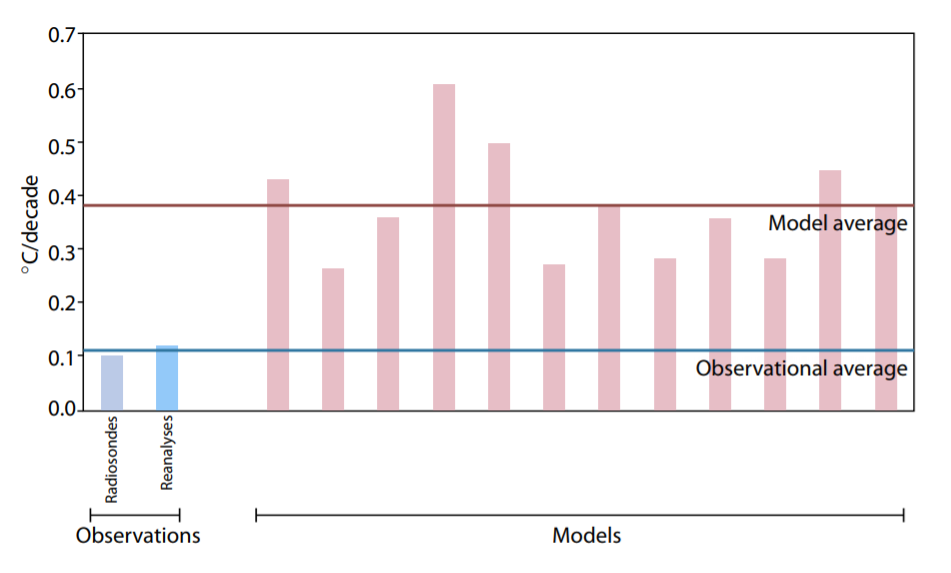
Figure 8: Warming in the tropical troposphere according to the CMIP6 models.
Trends 1979–2014 (except the rightmost model, which is to 2007), for 20°N–20°S, 300–200 hPa.

So we should not use them to to tell us what’s going to happen in the future since they haven’t even gotten us to the right place in the last 40 years.

BN: Given that your real world data refuted what the forecasts were every time for decades, why then (and I recognize that this is conjecture) why are, let’s say, 97 or 99 % of scientists so firmly behind climate crisis narrative?

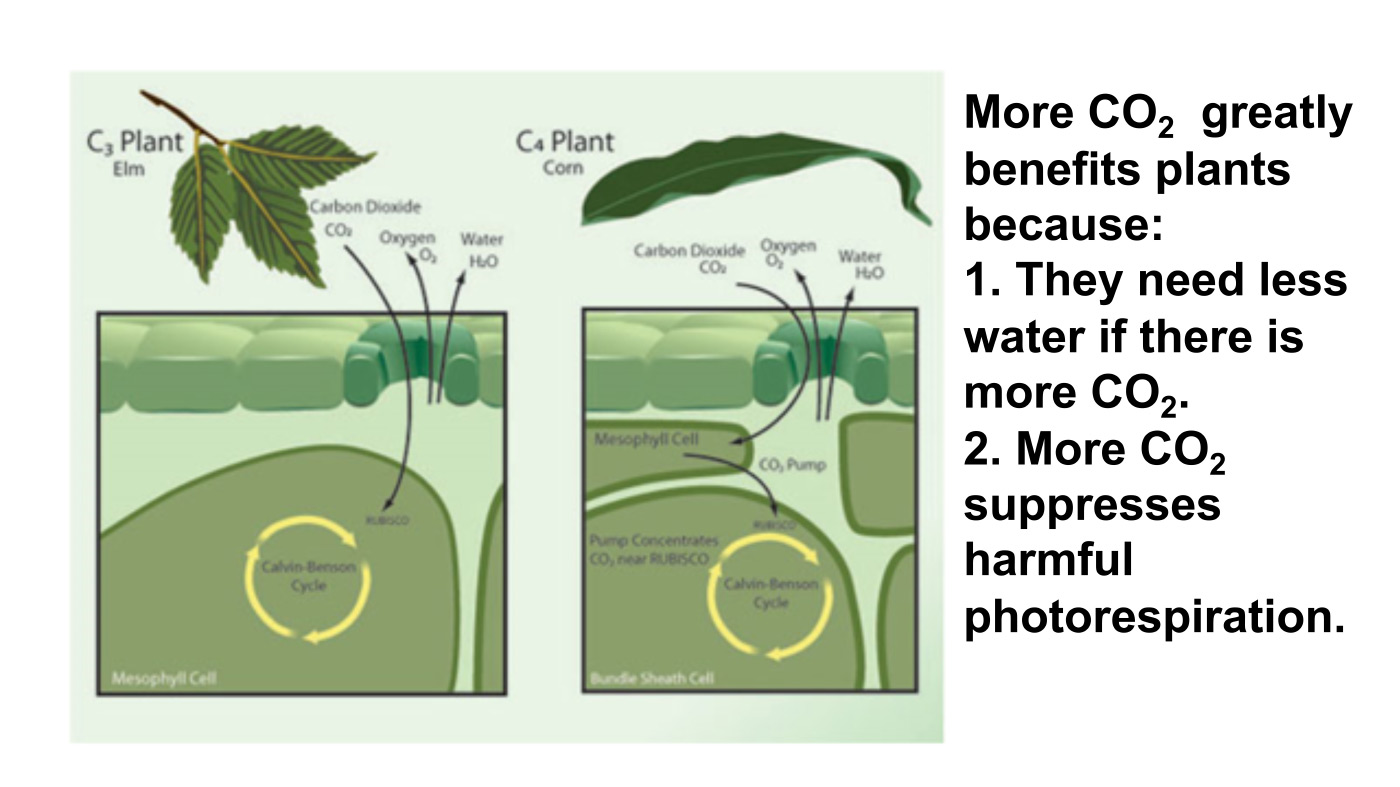
JC: Yeah I don’t know how many are really fully behind that crisis climate narrative. I saw a recent survey where about 55 percent might have been of the opinion that the climate warming was going to be a problem. Warming itself is not a problem: I mean the Earth has been warmer in the past than it is today, so the Earth has survived that before. And I don’t think putting extra plant food in the atmosphere is going to be a real problem for us to overcome. I do think the world is going to warm some from the extra CO2, but there are a lot of benefits that come from that.

You’re you’re dealing with a question about human nature and funding and so on. I think we all know that the more dramatic the story is, especially in the political world, the more attention you will get. Therefore your work can be highlighted and that helps you with funding and attention and so on. And part of what’s going on here. Then there’s the other real stronger political narrative: that there are groups and in the world political Elite that like to have a narrative that scares people, so that they can then offer a solution. And so it’s a simple way to say: elect me to this office and I will be able to solve this problem.

Then you are facing people like us who actually produce the data and we can report on extreme events and so on and say: Well you know there isn’t any change in these extreme events, so what’s the problem you’re trying to solve? And then we look at the other side of that issue and say: Okay if you actually implement this regulation or this law, it’s not going to make any difference on the climate end, so it’s a you kind of lose on two ends on that story.

BN: You’re a distinguished professor of atmospheric science and also director of Earth Sciences also at Alabama in Huntsville, these are prominent positions. How have you managed to hold on to them with climate views that are so divergent from the norm?

JC: Well the environment in the state of Alabama is different than what you have in Washington. I’m from California way across the country, and I tell people that one of the reasons I like to live in Alabama because in Alabama you can call a duck a duck; that you can just be direct about what’s going on and and you’re not going to be given the evil eye or cast out. As it is now in the climate establishment, you know, saying that all the models are warming too much and that there is not a disaster arising that causes great consternation. Because the narrative has been built over the last 30 years that we are supposed to be in a catastrophe. To come out and say, well here’s the data and the data show there is no catastrophe looming; we’re doing fine, the world is doing fine, human life is thriving in places it’s allowed to. So what’s the problem here you’re trying to solve.

BN: Did you ever manage to get your findings to policy makers that have influence to do something about it?

[An important proof against the CO2 global warming claim was included in John Christy’s testimony 29 March 2017 at the House Committee on Science, Space and Technology. The text and diagram below are from that document which can be accessed here.

IPCC Assessment Reports show that the IPCC climate models performed best versus observations when they did not include extra GHGs and this result can be demonstrated with a statistical model as well.

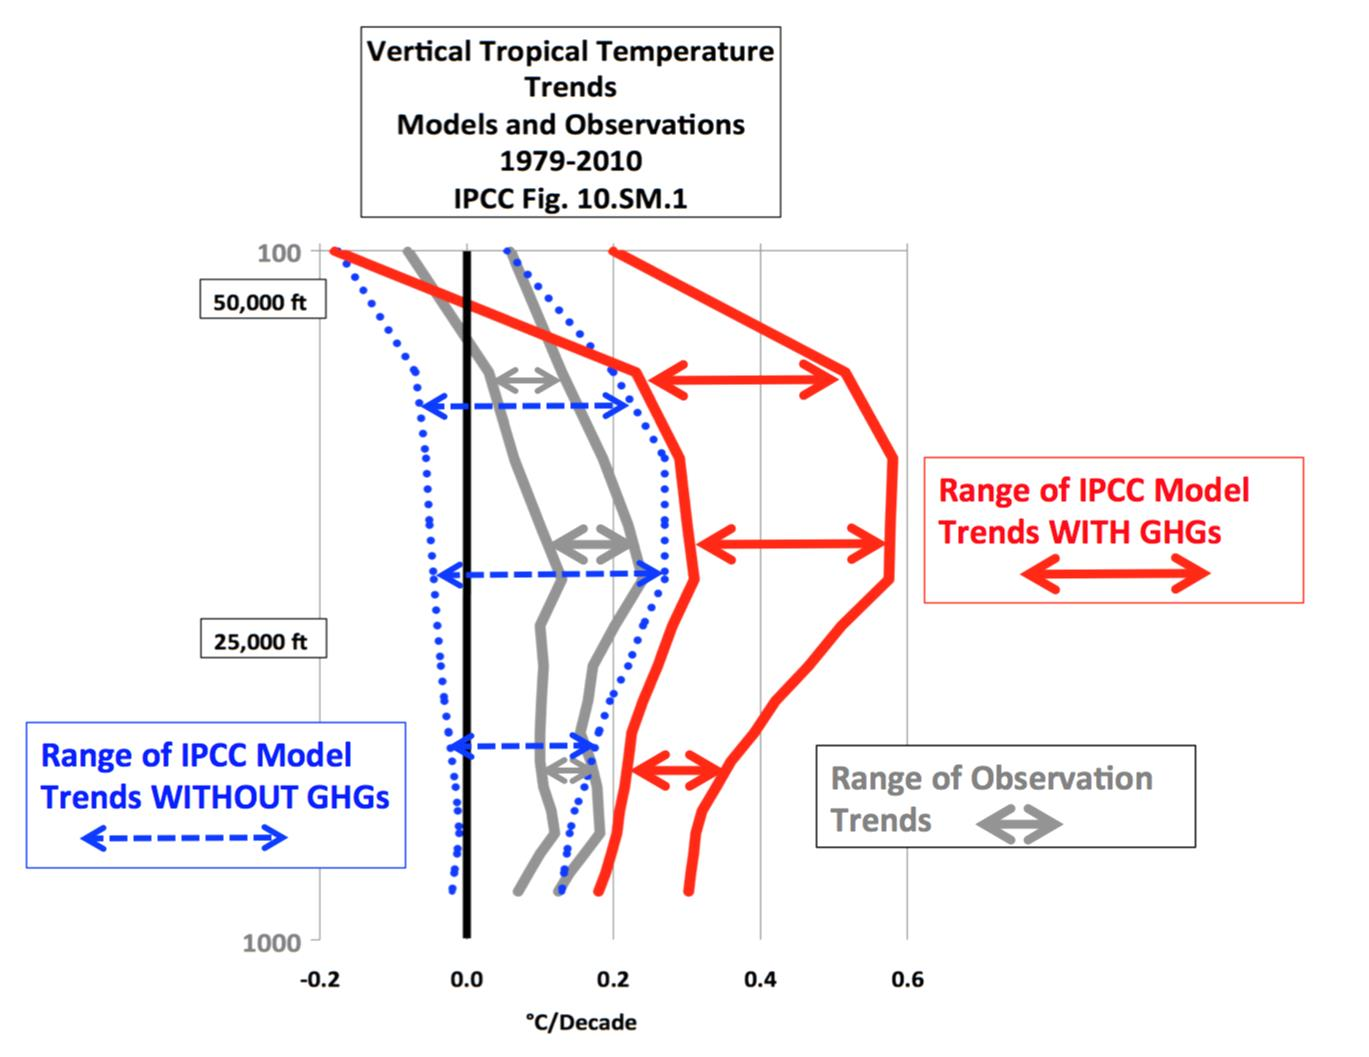
Figure 5. Simplification of IPCC AR5 shown above in Fig. 4. The colored lines represent the range of results for the models and observations. The trends here represent trends at different levels of the tropical atmosphere from the surface up to 50,000 ft. The gray lines are the bounds for the range of observations, the blue for the range of IPCC model results without extra GHGs and the red for IPCC model results with extra GHGs.The key point displayed is the lack of overlap between the GHG model results (red) and the observations (gray). The nonGHG model runs (blue) overlap the observations almost completely.

JC: Well, I’ve been to Congress 20 times, testified before hearings. So the information is there and available, but I can’t force Congress to make legislation that matches the real world. The Congressional world is a political world, and things happen there that are kind of out of my reach and ability to influence.

BN: According to your research, you’ve also said that the climate models underestimate negative feedback loops. Can you explain to me what is this mechanism and the effect of overestimation of the loops on understanding climate for what it is?

JC: That’s a very complicated issue, and I don’t understand it all for sure, but we can say just from some general results and general observation what’s going on here. One of those General observations is that when a climate model warms up the atmosphere one degree Kelvin, it sends out 1.4 watts per meter squared so the air atmosphere warms up and energy escapes to space 1.4 watts. When we use actual observations of the atmosphere, when the real atmosphere warms up one Kelvin it sends out 2.6 watts of energy. That’s almost twice as much so that tells you right there that the climate models are retaining or holding on to energy that the real world allows to escape when it warms. So that’s a negative feedback: as the atmosphere warms for a bit the real real world knows how to let that heat escape; whereas the models don’t and they retain it and that’s why they keep building up heat over time.

BN: What other variables do you look at?

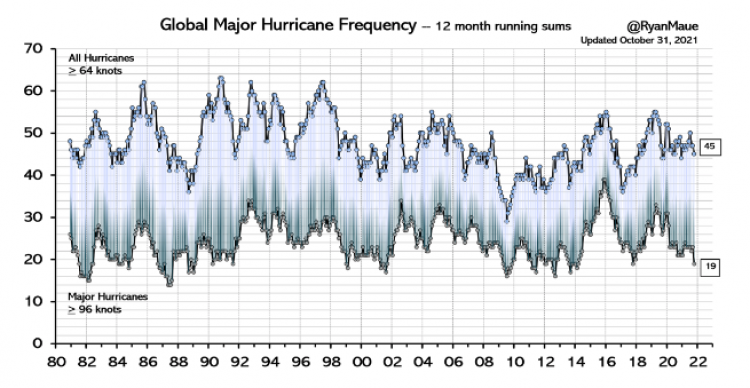
JC: The state climatologists I deal a lot get very practical questions that people ask. They want to know: is it getting hot or is it getting wetter. Are rain storms getting heavier and are the Hurricanes getting worse and so on. I actually wrote a booklet called a practical guide to climate change in Alabama. But it covers a lot of the country as well. It’s free, you can download it from the first page of my website The Alabama State climatologist. I answer a lot of these very practical questions and as we go down the list: droughts are not getting worse over time, heavy rainstorms are not getting worse over time, here in the Southeast in fact. Ross McKitrick and I also had a paper where we went back to 1878 and demonstrated that the trends are not significant. Hurricanes are not going up at all; in fact 2022 is going to be one of the quietest that we’ve had in a while. Tornadoes are not becoming more numerous, heat waves are not becoming worse. So one after another, the weather that people really care about, that if it changes could cause problem or catastrophe, we find those events are not changing, they’ve always been around.[Title below in red is link to Christy’s booklet.]

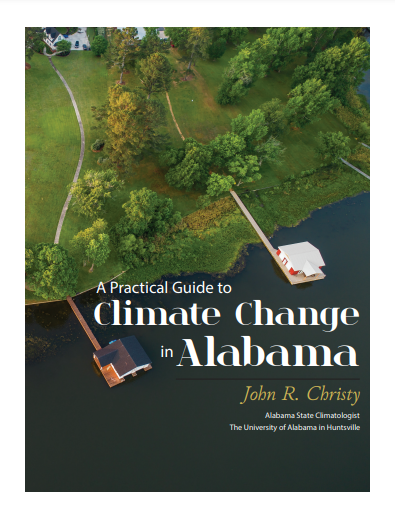
A Practical Guide to Climate Change in Alabama

BN: Some of the biggest critics of climate skeptics say: okay yeah it’s not fair one extreme weather event doesn’t say much, but they argue that there are very particular trends that have been on the increase. Recently have you observed this at all?

JC: That’s exactly the kind of thing we build data sets to discover. For example there is a story, and there is some evidence for it, that in the last hundred years there’s been an increase in in heavy rain events in part of our country, not all of it just part of the country. So I built a data set that went back in fact back to the 1860s. And we looked at that very carefully, and found that when you go back far enough, there were a lot of heavy events back then. And so over the long time period of 140 years or more we don’t see an upward trend. It’s unusual in that sample of time 140 years that we don’t see a change in those kind of events. So that’s why I think it has great value to build these data sets so you can specifically answer the question and the claim that is being made

One of the worst ones was made by the New York Times when they were talking about how many record high temperatures occurred in a recent heat wave around the country. So I looked at that carefully, and they were allowing stations to be included that only had 30 years or even less than 30 years of data. Some had a hundred years but a lot of them just had 30 years. Well when you become very systematic, you say: I’m only going to allow stations that have a hundred years so that every station that measured in 2022 can be compared with the entire time series. Then their story falls apart because the 1930s and the 50s were so hot in our country that they still hold the records for the number of high temperature events.

The scary thing for me is that as much as it completely falls apart, there’s no logic to it,
yet it’s still firmly stands as what most people believe.

You have to credit those in the climate establishment and the media or whoever is behind all this, that they have been successful in scaring people about the climate. Because now you find that even in grade school textbooks. Almost every new story that comes out, and this is where this establishment is very good, they make sure every story has some kind of line in it about climate change. They don’t ever go back and talk to someone who actually builds these data sets who says is that really the worst it’s been was 120 years ago. They just make those claims.

Other than the fact that sea level is rising a bit, the extreme events are just not there to really cause problems now. We are in a problem of having greater damages occur because of extreme events, and mainly because we’ve just built so much more stuff and placed It In harm’s way. Our coastlines are crowded with Condominiums, entertainment parks and retirement villages, and so on. There’s so many more of them that when a hurricane does come, it’s going to wipe out a lot more and so for the absolute value of those damages has gone up. But the number of hurricanes, their strength and so on, the background climate has not caused that problem. It’s just that we like to build things in places that are dangerous.

We have records of sea level rise, and it’s on the order of about an inch per decade, except in places where the land’s sinking. You can find that on the Louisiana Gulf Coast and places like that, but otherwise it’s about an inch per decade. I tell folks that an inch per decade, two and a half centimeters a decade is not your problem. It’s 10 feet in six hours from the next hurricane that’s your problem. If you can withstand a rise of sea level of 10 feet in six hours then you’re probably going to be okay. But if you can’t then a hurricane can really cause problems, and so we just have more exposure to that kind of his situation now than we’ve had before.

BN: What about the trend with sea level rise? Should we be worried about future Generations having to deal with issues that might not affect us in our lifetime but eventually will threaten their lives?

I think your listeners would need to understand that sea level is a dynamic variable–It goes up, it goes down. It has been over a hundred meters lower than today just in the last 25,000 years, and there was a period from about 15 000 years ago to 8 000 years ago where the sea level rose about 12 centimeters per decade for seven thousand years. That’s a lot more than two and a half centimeters a decade as it’s doing now, so the world has managed to deal with rising sea levels before. If we go back to the last warm period about 130 000 years ago, the sea level then was higher than it is now by about five meters or so. So just naturally we would expect at least another five meters of sea level; it won’t happen tomorrow, it won’t happen this Century. But slowly it will likely continue to rise and so that should be placed in your thinking if you’re building a dock for say a military port or something you want to last a long time. Put a cushion in there, a way to handle another half meter of seat level rise in the next hundred years, and you should be okay.

BN: About your temperature records: How much has the Earth warmed let’s say over the last four years?

JC: Yes. With this November we finished 43 years of measurements. In that time the temperature has risen half a degree Celsius. And you might want to look at other things about the world. World agricultural production has expanded tremendously. Nations are now exporting grain more than they had before, because people are pretty smart and figure out how to do things better all the time. Growing food is one thing they figured out how to do better as time passed, so the climate warming of a half degree has not caused a a major catastrophe at all. Wealth has increased around the planet, now some governments are trying to prevent you from growing your wealth, but that’s a hard thing to stop people who like to have food; they like to have conveniences in their life and that’s hard to pass laws that say you can’t enjoy the life the way you want to.

BN: How much of the warming are you reliably able to say is as a result of human activity?

JC: Okay. The answer is none in the sense that you said reliably. I can’t come up with an answer for that reliably. Warming from humans assumes warming that is not due to El Nino; or warming that’s not due to volcanic suppression of temperatures earlier in the record, which comes up to about a tenth of a degree per decade.

Are there other factors that we can say for sure have played a role in the incremental warming of the planet over the last few decades.  We see that we’ve had a couple of volcanoes in the first half of that period Eyjafjallajökull and Pinatubo and those cool the planet in the first half of that 40 years. So that tilted the trend up and that’s where I come up with a one-tenth per decade is the warming rate, which means the climate is not very sensitive to carbon dioxide or greenhouse gas warming. It’s probably half or even less as sensitive as models tend to report.

BN: So if CO2 exposure or insertion into the atmosphere were to double what would the results be?

JC: I actually had a little paper on that and we’re kind of expecting maybe about 2070 or 2080 it will be double from what it was back in 1850. And the warming of that amount uh will be about a degree, 1.3 C is what I calculated. The general rule I found about people is they don’t mind an extra degree on their temperature. In fact if you look at the United States the average American experiences a much warmer temperature now than they did a hundred years ago. Because the average American has moved South; the average American has moved to much warmer climates–California, Arizona Texas, Alabama, Florida and so on. Because cold is not a whole lot of fun. You know, skiing, snowmobiling and ice fishing and so on, that’s fine. But the average person likes it to be warm and so that’s why many people in our country have moved to warmer areas. So I don’t think that 1.3 Kelvin is going to matter much whether people really care about those extreme events and so on.

BN: What do you your temperature records tell you about previous hotter temperatures?

JC: Since 1979, what we see is an upward trend in the in the global temperature that I think is manageable. But it goes up and down the 1997-98 El Nino was a big event and in 2016 El Nino was a big event. We also see the downs that come from a volcano that might go off and cool off the planet. Those are bigger effects than that small trend that’s going up. The global temperature can change by two tenths of a degree from month to month when we’re talking about a tenth per decade. Then people say, you know a month to month we can handle but we can’t handle 20 years worth of a small change. That just doesn’t make sense and and the real world evidence is pretty clear that that humans have done extremely well as our planet has been warming a little bit, whether it’s natural or not.

BN: Can you tell me about the Milankovich Cycles?

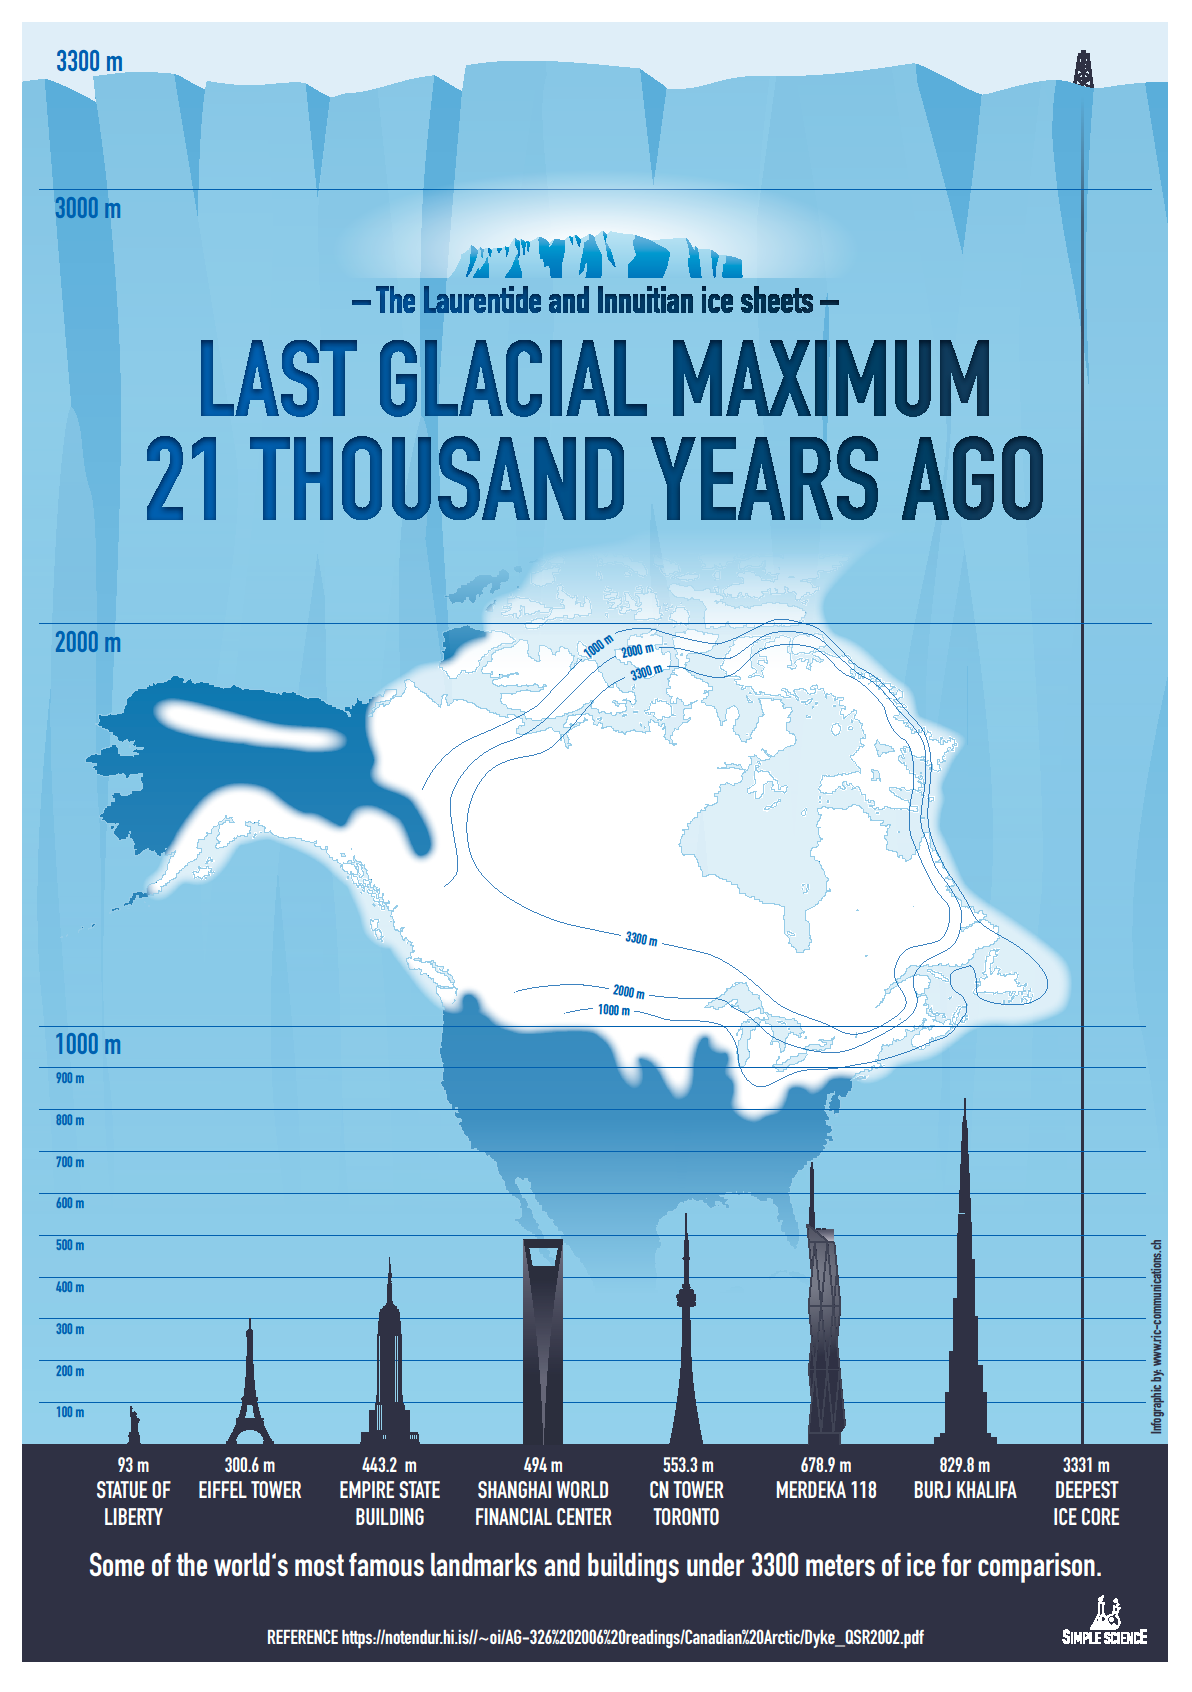
Milankovich Cycles are the orbital cycles of the earth orbit around the Sun and its tilt of the axis and the distance from the Sun. It is not a perfect circular orbit around the sun, it’s kind of an ellipse and it changes through time. All those factors work together to put a little bit more solar energy in certain places and less than others. These cycles are likely related to the Ice Ages we talk about.

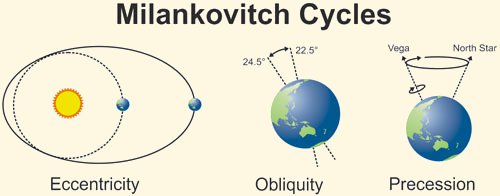
If you can melt the snow in Canada in the summer, then you won’t have an ice age. So the snow falls in the winter and if you can’t melt the snow in Canada in the summer because the Earth is tilted away a bit in July and August. Then the snow hangs around all summer long, the next winter more snow that piles up the next summer it doesn’t melt and so on the next year. You get this mechanism that adds and extends snow cover leading to an ice age

So the tilt of the axis and other parameters I just mentioned can moderate how much sunlight comes in the summertime in Canada. And it’s up to 100 watts per meter squared which is a lot of energy difference over time. That’s probably the strongest theory that has a good amount of evidence that those orbital changes can cause huge changes in the climate from ice ages to the current interglacial.

BN: There’s claims that the way that humans are living is causing daily Extinction of two to three hundred different species. Is this a natural course of Evolution?

JC: You know 99 % of the species that have ever lived are extinct, so extinction is is pretty natural.  Obviously humans cause some extinctions. When you destroy the environment of a small place and that was the only place that particular species lived then yes you know humans caused that extinction Did climate change from humans cause any extinctions? I think that jury is still out because most species love the extra carbon dioxide. Plants do specifically and then everything that eats plants loves that, so you might want to say the extra carbon dioxide actually helped in some sense the whole biosphere.

But I think that what humans do to the surface and to water, if it’s not clean properly and if you just really poison the surface in the air, then that can cause some real problems for the species that are living out there. And that’s why we have rules about not putting poison in air or in the water.

BN: Does that qualify as climate change?

JC: No.  To say carbon dioxide is a poison, you really have to scratch your head on that because plants love the stuff. It invigorates the biosphere. When did all of this Greenery evolve and the corals occur and grow and develop? it was when there was two to four or five times as much CO2 as is in the air now. Carbon dioxide invigorates the biosphere, so we’re just actually putting back carbon dioxide that had been in the atmosphere earlier. And I don’t think the world is going to have much problem with that in terms of its biosphere. The issue is about the climate going to become so bad that some things can’t handle it and I don’t really see the evidence for that happening.

BN: Critics of your views on climate have argued that you undercut your credibility by making claims that exceed your data and that you’re unwilling to agree with different findings. How do you respond to that?

JC: Show me a finding and let me look at it and if it’s a valid finding, fine I’ll agree with it. But you know you can find anything on the web these days about claims that someone might make but you show me the evidence. Let me see what you’re complaining about and we can have a discussion about that. I just had a paper published last week on snowfall in the western states of the United States that shows for the main snowfall regions there is no trend in snowfall. The amount of snow that’s falling right now is the same as it was 120 years ago. So snow is still falling out in the western mountains of the United States–that’s evidence, that’s data. And so when someone claims that oh my, snowfall is going away out in the west, I said well well here look at this evidence from real station data that people recorded back in 1890 to now.

So I can answer that question with real information. You don’t see many people like me in debates because they’re not offered to me. In fact I’ve been uninvited you know. Someone on a particular panel would say hey let’s get this guy to come here and speak to us, and then I receive the disinvitation because I was not going to go along with the theme of their climate change as a catastrophe presentation

BN: You referred to times in the past that CO2 levels were significantly higher than they are now. Do records show any negative effects as a result of such high CO2?

JC: Well when you say negative, that’s almost a moral question: good or bad that the dinosaurs went extinct? I think they’d the dinosaurs would have an opinion about that. Let me rephrase: If it had to be on those levels today would it negatively impact Humanity? We see carbon dioxide has increased as humans are producing energy so that their lives can be enhanced. There’s a direct relationship between how much carbon or energy you’re able to use and carbon is the main source today and your ability to thrive.

Think about it we didn’t leave the Stone Age because we ran out of rocks. We left the Stone Age because something better came along, you know, Iron, Bronze and so on. In terms of energy we didn’t leave the wood and dung age because we ran out of trees or excrement, we found a better source that was carbon: coal, oil and so on. And transportation: we didn’t leave the horse and buggy age because we ran out of horses. It was because Henry Ford made a vehicle that was cheap and affordable. My great grandfather who was in destitute poverty in Oklahoma in the 1930s had a Model T. And another thing about Henry Ford: He didn’t go around getting the government to kill all the horses so you’d have to buy his cars. Horses were still available for the poorest people you know. And he didn’t make the government go out and build gas stations or drill for oil, that was done at the market for the private level.

But today we have a government that says this is what we want for the energy structure, and so we’re going to be using your taxpayer money to put out all these charging stations and force you to buy electric cars or at least subsidize them tremendously, and put up all these windmills and so on at Great expense and great environmental wreckage.

I can assure you that without energy life is brutal and short, and so energy is a thing that has caused our lifespans to double so that children no longer fear about diseases that used to wipe out Millions. Because of the advances that energy has brought through electricity and experimentation and all the sciences that we have developed now. All that’s based upon that access to energy.

So yes developing countries are going to get their energy, they’re going to find the energy they need. I’m not making this as a prediction, just using this as an observation. Right now it’s carbon that’s the cheapest and most effective and very high density. So we will see these countries use carbon to advance and we should not stand in their way. Because they want to live like us who already have pretty big carbon Footprints.

If you want to have some comfort in that, remember the carbon dioxide we’re putting back into the atmosphere is invigorating the biosphere and it also represents people living longer and better lives.  Just no question that as energy is made available and affordable people live longer and better lives. I think that’s going to ultimately be the the inertia that’s going to carry forward this issue past all the preaching about carbon dioxide problems.

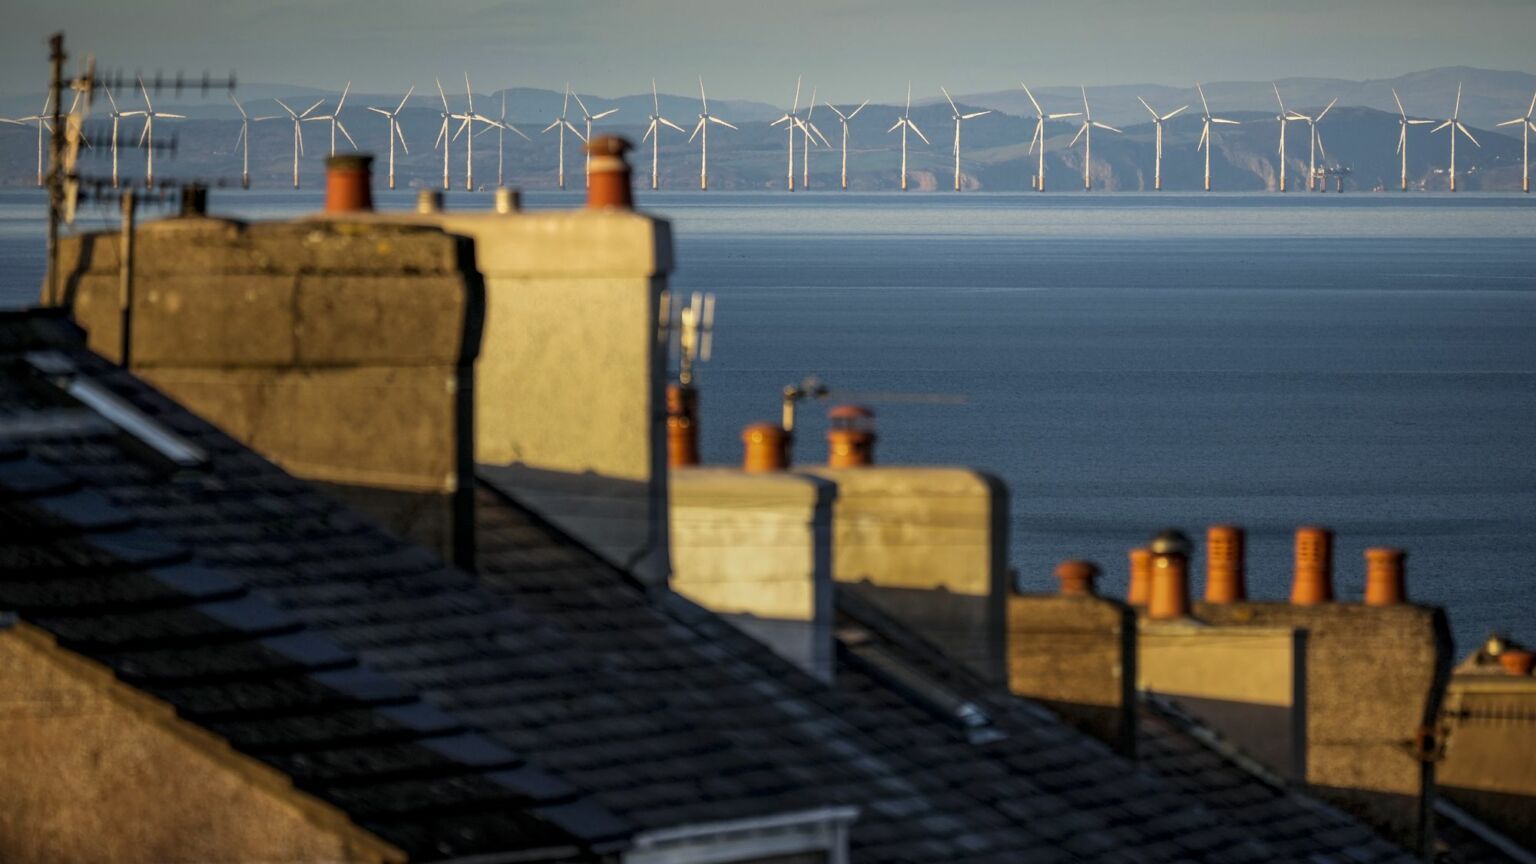
Environmentalists would argue that they’re not against electricity and prosperity, they’re just advocating for a better cleaner way to do it. It’s a tremendous misconception that a windmill or a solar panel can somehow give you cleaner and more reliable energy than what you have now. That’s just not true. To build a windmill, there’s tremendous environmental wreckage that you have to go through in terms of all the minerals you have to yank out of the earth and process. And processing takes energy by the way. And then building all these transmission lines. The energy is so diffuse, it is so weak in wind and solar that you have to gather up huge amounts of land to put it together. Robert Price said it well when he called it the iron law of power: the weaker the source of energy the more stuff and material you need to gather it, to concentrate it and to make it useful.

You have to spend huge amounts of dollars in environmental cost to make a windmill or make a solar panel, which by the way doesn’t last forever. So this carbon that already has a tremendous amount of energy in a very small dense space means that its environmental footprint is much much smaller than what you have with solar or wind. In fact it’s about one to a thousand or two thousand in terms of the square footage you need.

Look at windmill and solar panel farms. Not only are they just ugly but they cause tremendous environmental damage in their construction and maintenance. What are the long-term effects decades from now? If we just continue to get our energy from fossil fuels how bad can it get?

Well start with how good it can get. People will have access to affordable energy so they’re going to live longer and they’re going to live better lives when you have access to this. The impact on the climate is about the only thing you can think of. Well the sea level is going to continue to rise since it’s been rising for several hundred years, and at a manageable rate by the way. And the atmosphere might warm some more, but certainly not in terms of some catastrophic effect that will cause us to lose our ability to thrive.

I’m just very optimistic that people are clever and they can figure out how to adapt to whatever is going to happen. The real issues I deal with as a state climatologist are the extreme events that we know are going to happen that you’re not ready for. I mean that flood that happened 50 years ago is going to come back again. And it’s going to cause some real problems if you don’t build your infrastructure and put your houses or industry where they can be safe. If you don’t build up on the coast too much, so then you won’t be clobbered by a hurricane or something like that. It’s these kind of natural extreme events to which we’re far more vulnerable right now, rather than some small and gradual change that the climate system might undergo.

BN: I did read somewhere that someone has said, and I’m sure you must get it a lot, whether you get any funding from the fossil fuel industry. Do you?

JC: No I do not, and I made that decision way back in the early 1990s. I might make a fossil fuel company mad by some of them information I would produce, but so be it. I can put my head to bed at night and not be worried about: Did I accommodate some agenda somewhere? I’m just after what observations say. Can I build the best observational data sets to answer the questions of climate that we have, and that’s what I want to do.

BN: I suppose one of the biggest tragedies about it would be that it would discredit the real science and the fundamental research that you’re doing. Just that it’ll be a non-starter because people will immediately dismiss it.

JC: That’s unfortunate because the perception then is that, well if a fossil fuel company paid someone to do some research they really wanted to know the answer about something and this person was completely honest did the work properly and provided the answer to the fossil fuel companies is as. Well that answer would be tainted because it came from a fossil fuel company. Well hello: Think about what environmental advocacy groups and pressure groups do all of the time. They pay tremendous sums to people so they can come up with an answer that gives them their leverage in claiming this is a catastrophic problem. So I can at least take that perception off the table.

BN: Lastly are you aware of any ways in which geoengineering could possibly be affecting the natural balance of things? Is it being done more than we’re aware of and could it backfire?

JC: Anytime humans do something they’re going to have an impact, no question about that. So you could call it geoengineering but inadvertently we have made some desert valleys cooler because now we irrigate crops. We have taken water that fell someplace and moved it to another place. So that’s a bit of geoengineering there. And by the way a lot of those places feed a lot of the world, so you can’t say it’s bad I suppose.

But the other question about geoengineering is:
Can we do something to prevent a perceived problem here?

And that’s the real danger I think, because you don’t know the consequences when you start tinkering with a very complex and dynamic system. And so I would say stay away from that. Suppose someone did a big geoengineering experiment and something bad happened somewhere. Well that country would sue the world and say: look you made this bad thing happen to us you are liable. And so then we’re getting nowhere in terms of preventing some problem on the planet.

Now is the Winter of Our Renewables Discontent

Ralph Schoellhammer writes from Vienna at Spiked Renewables won’t keep us warm this winter.  Excerpts in italics with my bolds and added images.

The cold snap is exposing the limits of wind and solar – and the insanity of the green agenda.

There are already many German loan words in the English language, but the latest addition should surely be the term ‘Dunkelflaute’. It describes a period of time in which virtually no energy can be generated using wind and solar power. It is a word that captures the grave problem that both Britain and Germany are facing today – namely, that you cannot run a modern economy on renewable energy. Especially during a windless and dark winter.

As real-time data from Electricity Maps shows, electricity production from renewables in Germany and the UK over the past few days has been abysmal. In Germany it is coal that is keeping the lights on, while in Britain it is gas. Falling temperatures are rapidly increasing both countries’ need for fossil fuels. It is not yet clear whether reserves for this winter are going to be sufficient.

Using electricity is a bit like breathing. Even a short break could prove lethal.

An economy needs constant access to energy (electricity in particular), or it will collapse. We cannot simply expect households to live without electricity for a few days, unless we are prepared for civil society to break down.

Some may argue that if humanity has lived without modern technology before, we should be able to do so again. Perhaps. But such a transition would be neither desirable nor entirely peaceful. Once the Promethean flame of modernity has been acquired, few will want to give it up.

The fact is that renewables simply do not offer a viable alternative energy source at the moment. The technology does not yet exist to effectively store electricity, meaning we cannot stockpile any surplus produced by wind and solar during summer. So it doesn’t matter how impressively renewables perform between June and August if they provide barely any energy between November and March. To keep an industrialised economy going requires energy all year round.

Most governments are aware of this. Which is why, despite the elites’ lip-service to renewables, both Germany and Britain have maintained a fleet of fossil-fuel power plants to make up for the unreliability of wind and solar. Unfortunately, those fuels are becoming more expensive as a result of the global energy crunch. With no proper alternatives in sight for energy production, it is consumers who increasingly have to pay the price.

And it is not as if this month’s Dunkelflaute is a bolt from the blue. Everyone knew that the current energy crisis was going to hurt us most during winter, when it is cold and dark, and when renewables, especially solar, are barely producing any power.

Yet still, green activists and politicians insist the answer to our energy crisis lies in expanding our use of wind and solar. This is a form of cognitive dissonance. It is like an ancient tribe, disappointed that throwing virgins into a volcano has not led to better harvests, deciding to double down on the child sacrifices. No amount of solar panels will brighten a northern European winter.

On 11 December, for instance, renewables contributed a measly three per cent of electricity generation in Britain – with solar clocking in at an impressive 0.00 gigawatts. The forms of energy keeping Britain going this winter are mostly gas, some nuclear (including imports from France) and even some coal.

In Germany, the situation is even worse. Last week, low renewable generation led Germany to burn more coal than it has in any week since 2019, and to burn more gas for electricity generation than ever before.

The German government has not only committed heavily to renewable energy, it is also determined to switch off its nuclear power plants. Green Party politicians, like economy minister Robert Habeck, have tried to claim that abandoning nuclear power will have no effect on electricity generation. This is despite the fact that during windless nights, Germany’s three remaining nuclear power plants contribute more to the grid than all of its wind farms and solar panels combined. This winter, nuclear will play a key role in keeping the lights on.

Yet these plants are slated to be decommissioned in April next year.

Greens will no doubt claim that the days when renewables are completely useless only materialise a few times a year – that these Dunkelflaute days are outliers. While that is true to an extent, it is tantamount to a doctor saying that your heart is in good condition, apart from a few days per year when it stops pumping blood through your system. A ‘blackout’ of this vital organ for even a few minutes is usually known as a heart attack. Statisticians might describe such an event as an ‘outlier’, but its consequences would surely be long-lived.

By favouring renewables ahead of more reliable sources of energy, many countries are currently creating all the conditions necessary for such blackouts. Although there are a few laudable exceptions, such as Poland, Finland, Hungary and the Netherlands, which are planning to give nuclear power another try.

It is not only the electricity grid that is suffering from the myopia of our green elites, but our finances, too. UK wholesale day-ahead electricity prices surged to a record high on Monday due to the disappointing performance of Britain’s wind farms.

Activists may claim that a switch to renewable energy is a scientific and moral imperative. But making our energy needs ever more dependent on the whims of the weather is neither scientific nor moral. Higher electricity prices will ultimately lead to higher prices of everything. This will impoverish those who are already suffering financially.

There are signs, however, that outside the minds of pundits and politicians, the hype over renewables is already fading. For instance, the most recent number of new orders for new offshore turbines at the world’s largest producer, Vestas Wind Systems, was the same as Britain’s solar electricity generation while I was writing this article: zero. So perhaps the winds are already changing.

If so, it would signal a welcome return to sanity on energy production.

Ralph Schoellhammer is an assistant professor in economics and political science at Webster University Vienna.


Road Safety Alert: Watch Out for Unvaccinated Drivers!

Extra!  Extra!  Read All About It!

COVID Vaccine Hesitancy and Risk of a Traffic Crash

Could be a parody, or not.  This twitter thread digs into the background:

Double click on image above to link to Greg’s twitter thread.

Climatists Aim Forks at Our Food Supply

It’s not enough to apply Chinese-style lockdowns in the name of “fighting climate change.”  Now climatists want to stick forks in our food supply, thereby reducing populations to a more “sustainable” number.  The attack on world food supply has four prongs to it, just like the forks in the image above.

1.  Exaggerate the Minor Climate Impact of Methane (CH4)

2.  Oppose Methane from Livestock as a Fossil Fuel, like Coal and Oil.

3. Freak Out over N2O as an Excuse to Ban Fertilizers

4.  Meat Shame People’s Diets Because Vegans Love Animals

Background:  The Carbon Cycle is Natural

This diagram of the fast carbon cycle shows the movement of carbon between land, atmosphere, and oceans in billions of tons per year. Yellow numbers are natural fluxes, red are human contributions, white indicate stored carbon.

Instead of delusions about CO2 as the planet’s climate “control knob”, Viv Forbes provides us a wise, sane view how the carbon cycle works, and what we know and don’t know about it. And rather than exaggerate the effects of humans recycling fossil fuels, he puts the carbon cycling sources and sinks into a sensible perspective. His recent article is entitled: Carbon Delusions and Limited Models

The IPCC models misread the positive and negative temperature feedbacks from water vapour (the main greenhouse gas) and their accounting for natural processes in the carbon cycle is based on very incomplete knowledge and numerous unproven assumptions.

The dreaded “greenhouse gases” (carbon dioxide and methane) are natural gases. Man did not create them — they occur naturally in comets and planets, and have been far more plentiful in previous atmospheres on Earth. They are abundant in the oceans and the atmosphere, and are buried in deposits of gas, oil, coal, shale, methane clathrates and vast beds of limestone. Land and sea plants absorb CO2 and micro-organisms absorb methane in the deep ocean.

Earth emits natural carbon-bearing gases in huge and largely unknown and unpredictable quantities. Carbon dioxide, carbon monoxide and various hydrocarbons such as ethane, methane and propane bubble out of the ocean floor, seep out of swamps, bubble naturally out of rivers, are released in oil seeps, water wells and bores, and are sometimes delivered via water pipes into drinking water. They are also released whenever carbon-bearing rocks such as coal and shale are eroded naturally, catch fire or are disturbed by earthquakes, construction activities or mining. The vast offshore deposits of frozen methane are released naturally when geothermal heat or volcanic intrusions melt the ice containing the methane.

The Minor Climate Impact of Methane (CH4)

Methane  
Natural gas is 75% Methane (CH4) which burns cleanly to carbon dioxide and water. Methane is eagerly sought after as fuel for electric power plants because of its ease of transport and because it produces the least carbon dioxide for the most power. Also cars can be powered with compressed natural gas (CNG) for short distances.

In many countries CNG has been widely distributed as the main home heating fuel. As a consequence, in the past methane has leaked to the atmosphere in large quantities, now firmly controlled. Grazing animals also produce methane in their complicated stomachs and methane escapes from rice paddies and peat bogs like the Siberian permafrost.

It is thought that methane is a very potent greenhouse gas because it absorbs some infrared wavelengths 7 times more effectively than CO2, molecule for molecule, and by weight even 20 times. As we have seen previously, this also means that within a distance of metres, its effect has saturated, and further transmission of heat occurs by convection and conduction rather than by radiation.

Note that when H20 is present in the lower troposphere, there are few photons left for CH4 to absorb:

Even if the IPCC radiative greenhouse theory were true, methane occurs only in minute quantities in air, 1.8ppm versus CO2 of 390ppm. By weight, CH4 is only 5.24Gt versus CO2 3140Gt (on this assumption). If it truly were twenty times more potent, it would amount to an equivalent of 105Gt CO2 or one thirtieth that of CO2. A doubling in methane would thus have no noticeable effect on world temperature.

However, the factor of 20 is entirely misleading because absorption is proportional to the number of molecules (=volume), so the factor of 7 (7.3) is correct and 20 is wrong. With this in mind, the perceived threat from methane becomes even less.

Further still, methane has been rising from 1.6ppm to 1.8ppm in 30 years (1980-2010), assuming that it has not stopped rising, this amounts to a doubling in 2-3 centuries. In other words, methane can never have any measurable effect on temperature, even if the IPCC radiative cooling theory were right.

Because only a small fraction in the rise of methane in air can be attributed to farm animals, it is ludicrous to worry about this aspect or to try to farm with smaller emissions of methane, or to tax it or to trade credits.

The fact that methane in air has been leveling off in the past two decades, even though we do not know why, implies that it plays absolutely no role as a greenhouse gas.  (From Sea Friends (here):

More information at The Methane Misconceptions by Dr. Wilson Flood (UK) here.

Give Daisy a Break!

Methane Risk from Livestock is Overstated

Frank M. Mitloehner is Professor of Animal Science and Air Quality Extension Specialist, University of California, Davis.  He writes at the Conversation Yes, eating meat affects the environment, but cows are not killing the climate.  Excerpts in italics with my bolds.

A key claim underlying these arguments holds that globally, meat production generates more greenhouse gases than the entire transportation sector. However, this claim is demonstrably wrong, as I will show. And its persistence has led to false assumptions about the linkage between meat and climate change.

My research focuses on ways in which animal agriculture affects air quality and climate change. In my view, there are many reasons for either choosing animal protein or opting for a vegetarian selection. However, foregoing meat and meat products is not the environmental panacea many would have us believe. And if taken to an extreme, it also could have harmful nutritional consequences.

Many people continue to think avoiding meat as infrequently as once a week will make a significant difference to the climate. But according to one recent study, even if Americans eliminated all animal protein from their diets, they would reduce U.S. greenhouse gas emissions by only 2.6 percent. According to our research at the University of California, Davis, if the practice of Meatless Monday were to be adopted by all Americans, we’d see a reduction of only 0.5 percent.

Moreover, technological, genetic and management changes that have taken place in U.S. agriculture over the past 70 years have made livestock production more efficient and less greenhouse gas-intensive. According to the FAO’s statistical database, total direct greenhouse gas emissions from U.S. livestock have declined 11.3 percent since 1961, while production of livestock meat has more than doubled.

Removing animals from U.S. agriculture would lower national greenhouse gas emissions to a small degree, but it would also make it harder to meet nutritional requirements. Many critics of animal agriculture are quick to point out that if farmers raised only plants, they could produce more pounds of food and more calories per person. But humans also need many essential micro- and macronutrients for good health.

The world population is currently projected to reach 9.8 billion people by 2050. Feeding this many people will raise immense challenges. Meat is more nutrient-dense per serving than vegetarian options, and ruminant animals largely thrive on feed that is not suitable for humans. Raising livestock also offers much-needed income for small-scale farmers in developing nations. Worldwide, livestock provides a livelihood for 1 billion people.

Climate change demands urgent attention, and the livestock industry has a large overall environmental footprint that affects air, water and land. These, combined with a rapidly rising world population, give us plenty of compelling reasons to continue to work for greater efficiencies in animal agriculture. I believe the place to start is with science-based facts.

N2O is No Excuse to Ban Fertilizers

Methane and Climate is a paper by W. A. van Wijngaarden (Department of Physics and Astronomy, York University, Canada) and W. Happer (Department of Physics, Princeton University, USA) published at CO2 Coalition November 22, 2019. It is a summary in advance of a more detailed publication to come. Excerpts in italics with my bolds. [Note the paper is a thorough and deep expert analysis of atmospheric radiation physics which I do not fully comprehend.  So the excerpts below are necessarily superficial, but intend to provide the core findings from these scientists.]

Figure 2: Left. A standard atmospheric temperature profile [9], T = T(z). The surface temperature is T(0)= 288.7 K. Right. Standard concentrations [10], Csd = Nsd /N for greenhouse molecules versus altitude z.  The total number density of atmospheric molecules is N and the number density of molecules of type i is Nsd. At sea level the concentrations are 7750 ppm of H2O, 1.8 ppm of CH4 and 0.32 ppm of N2O. The O3 concentration peaks at 7.8 ppm at an altitude of 35 km, and the CO2 concentration was approximated by 400 ppm at all altitudes. The data is based on experimental observations.

As shown in Fig. 2, the most abundant greenhouse gas at the surface is water vapor (H2O). However, the concentration of water vapor drops by a factor of a thousand or more between the surface and the tropopause. This is because of condensation of water vapor into clouds and eventual removal by precipitation.  Carbon dioxide CO2, the most abundant greenhouse gas after water vapor, is also the most uniformly mixed because of its chemical stability. Methane, the main topic of this discussion is much less abundant than CO2 and it has somewhat higher concentrations in the troposphere than in the stratosphere where it is oxidized by OH radicals and ozone, O3. The oxydation of methane [8] is the main source of the stratospheric water vapor shown in Fig. 2. 

Figure 9: Projected midlatitude forcing increments at the tropopause from continued increases of CO2 and CH4 at the rates of Fig. 7 and Fig. 8 for the next 50 years. The projected forcings are very small, especially for methane, compared to the current tropospheric forcing of 137 W m−2.

The paper is focused on the greenhouse effects of atmospheric methane, since there have recently been proposals to put harsh restrictions on any human activities that release methane. The basic radiation-transfer physics outlined in this paper gives no support to the idea that greenhouse gases like methane (CH4), carbon dioxide (CO2) or nitrous oxide (N2O) are contributing to a climate crisis. Given the huge benefits of more CO2 to agriculture, to forestry, and to primary photosynthetic productivity in general, more CO2 is almost certainly benefitting the world.  Radiative effects of CH4 and N2O are so small that they are irrelevant to climate.

The chart above informs on the scale of N2O concentrations. At first glance, it appears comparable to CO2, but on closer inspection the amounts are in ppb (parts per billion), not ppm (parts per million) as with CO2. To get comparable amounts requires dividing by 1000, thus the vertical axis goes from 0.315 ppm to 0.340 ppm. Yes, the dramatic rise over the last 22 years is 0.025ppm.

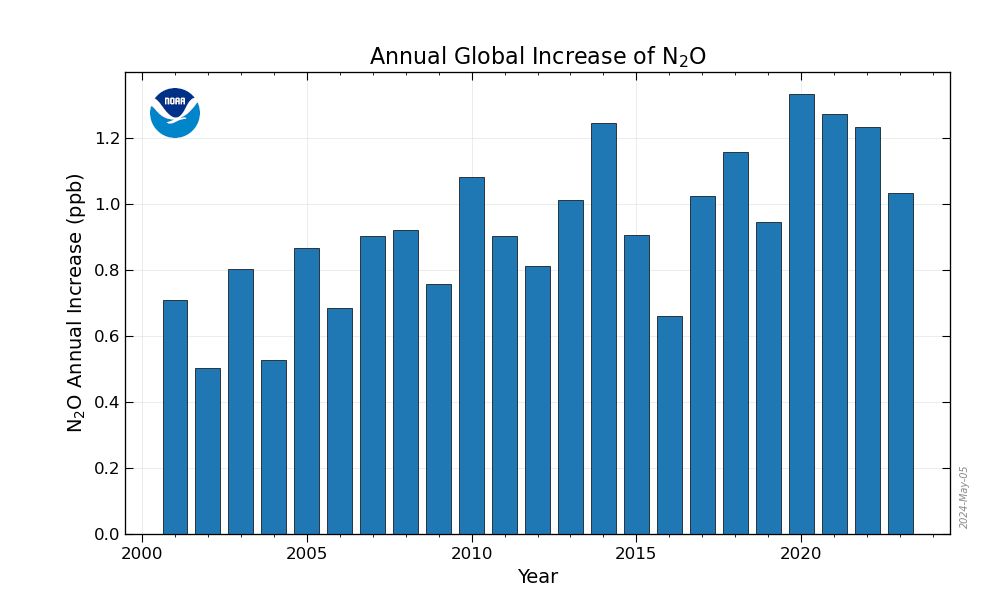
Then we have the annual global increase of N2O from all sources ranging from about 0.5 to 1.3 ppb. Does anyone believe they can measure N2O down to 0.0005 ppm?

 Vegans Pushing Their Anti-Meat Agenda

The origin of these alarms are studies published in Lancet, once highly reputed but recently given over to climate ideology rather than objective science. Most recently is Food in the Anthropocene: the EAT–Lancet Commission on healthy diets from sustainable food systems  The preceding Lancet study stated this main finding:

Following environmental objectives by replacing animal-source foods with plant-based ones was particularly effective in high-income countries for improving nutrient levels, lowering premature mortality (reduction of up to 12% [95% CI 10–13] with complete replacement), and reducing some environmental impacts, in particular greenhouse gas emissions (reductions of up to 84%). However, it also increased freshwater use (increases of up to 16%) and had little effectiveness in countries with low or moderate consumption of animal-source foods. (here).

Georgia Ede MD writes in Psychology Today EAT-Lancet’s Plant-based Planet: 10 Things You Need to Know. Excerpts in italics below with my bolds. Title is link to full text which is recommended reading.  Georgia Ede, MD, is a Harvard-trained psychiatrist and nutrition consultant practicing at Smith College. She writes about food and health on her website DiagnosisDiet.com.

We all want to be healthy, and we need a sustainable way to feed ourselves without destroying our environment. The well-being of our planet and its people are clearly in jeopardy, therefore clear, science-based, responsible guidance about how we should move forward together is most welcome.

Unfortunately, we are going to have to look elsewhere for solutions, because the EAT-Lancet Commission report fails to provide us with the clarity, transparency and responsible representation of the facts we need to place our trust in its authors. Instead, the Commission’s arguments are vague, inconsistent, unscientific, and downplay the serious risks to life and health posed by vegan diets.

To the best of my knowledge, there has never been a human clinical trial designed to test the health effects of simply removing animal foods from the diet, without making any other diet or lifestyle changes such as eliminating refined carbohydrates and other processed foods. Unless and until such research is conducted demonstrating clear benefits to this strategy, the assertion that human beings would be healthier without animal foods remains an untested hypothesis with clear risks to human life and health. Prescribing plant-based diets to the planet without including straightforward warnings of these risks and offering clear guidance as to how to minimize them is scientifically irresponsible and medically unethical, and therefore should not form the basis of public health recommendations.

Summary:

Natural Gas (75% methane) burns the cleanest with the least CO2 for the energy produced.

Leakage of methane is already addressed by efficiency improvements for its economic recovery, and will apparently be subject to even more regulations.

The atmosphere is a methane sink where the compound is oxidized through a series of reactions producing 1 CO2 and 2H20 after a few years.

GWP (Global Warming Potential) is CO2 equivalent heat trapping based on laboratory, not real world effects.

Any IR absorption by methane is limited by H2O absorbing in the same low energy LW bands.

There is no danger this century from natural or man-made methane emissions.

Conclusion

This is a bogus war on fertilizers, farmers and food. Everything is exaggerated for the sake of an extreme agenda to impose controls on free enterprise developed societies. It is true that use of fertilizers results in some release of N2O into the air, but even this has been overstated. And as the video demonstrates, farmers have a vested interest in using fertilizers wisely and are applying techniques that improve efficiency. As well, there is evidence of efficiency gains in the process of producing ammonia and then urea from air and natural gas. The attack on food supply is in effect an effort to reduce the population.

Resources

Much Ado About Methane

More Methane Madness

Washing Methane Away: Atmospheric Chemistry

Mastering Methane Mania

Let Them Eat Steak!

Climate Ideology = Bad Nutritional Advice

Carbon Sense and Nonsense


Arctic Ice Tops 12 Wadhams mid-December 2022

The animation shows the last two weeks of Arctic ice recovery from November 29 to December 13, 2022. On the lower far right, Hudson Bay starts this period at 550k km2 ice extent and grows to 1.2M km2 (from 44% to 96% of its maximum).  On the far left Sea of Okhotsk starts with 42k km2 and grows to 380k km2 of ice extent, now at 45% of its max last March. In the center Beaufort Sea reaches its max.

The graph below shows Mid December daily ice extents for 2022 compared to 16 year averages, and some years of note. As of yesterday, Arctic ice extent topped 12 Wadhams, or 12M km2.

The black line shows so far during this period  on average Arctic ice extents increased ~1.0M km2, while 2022 (cyan line) started December 200k km2 in deficit, reaching then holding a surplus to average for the last six days.  The Sea Ice Index in orange (SII from NOAA) lagged MASIE this month, but also topped 12M km2 on day 247.  Both 2007 and 2020 had much lower extents early in December, making up most of the deficit later on.  

Why is this important?  All the claims of global climate emergency depend on dangerously higher temperatures, lower sea ice, and rising sea levels.  The lack of additional warming is documented in a post Still No Global Warming March 2022

The lack of acceleration in sea levels along coastlines has been discussed also.  See USCS Warnings of Coastal Flooding

Also, a longer term perspective is informative:

post-glacial_sea_level
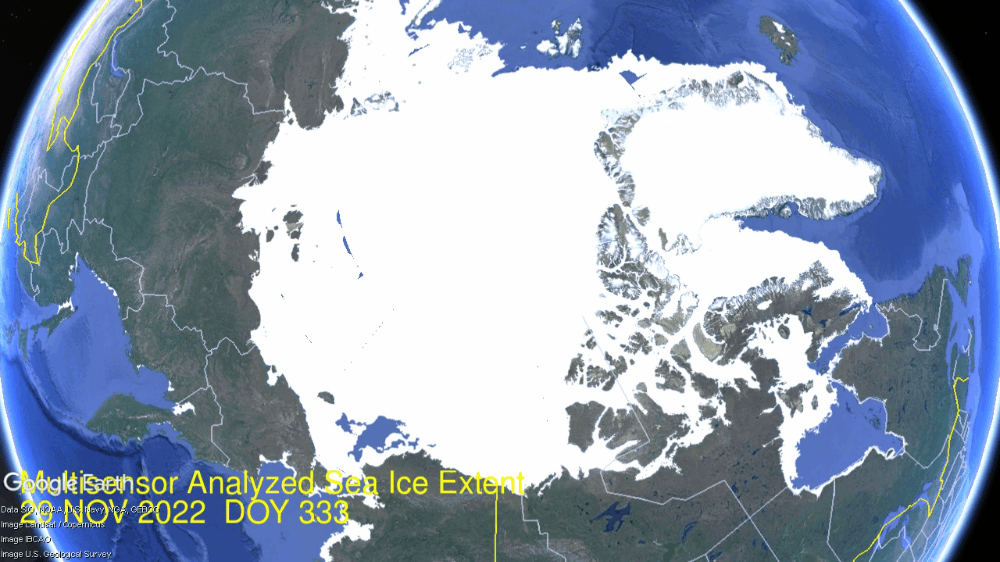
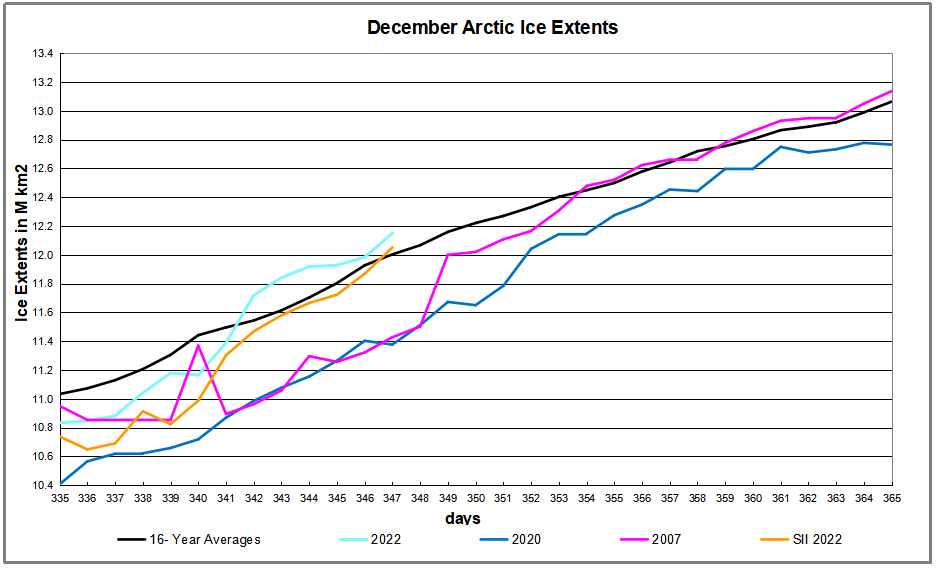
The table below shows the distribution of Sea Ice on day 347 across the Arctic Regions, on average, this year and 2007.

Region 2022347 Day 347 Average 2022-Ave. 2007347 2022-2007
 (0) Northern_Hemisphere 12151093 12003311  147782  11428288 722805 
 (1) Beaufort_Sea 1070966 1069874  1092  1062676 8290 
 (2) Chukchi_Sea 895943 906386  -10443  677993 217949 
 (3) East_Siberian_Sea 1087137 1085009  2129  1053584 33553 
 (4) Laptev_Sea 897845 897835  10  897845
 (5) Kara_Sea 801884 845212  -43328  800920 964 
 (6) Barents_Sea 221598 331366  -109768  236964 -15366 
 (7) Greenland_Sea 587354 544864  42489  488595 98758 
 (8) Baffin_Bay_Gulf_of_St._Lawrence 792277 806543  -14266  782889 9388 
 (9) Canadian_Archipelago 854843 853331  1512  852556 2286 
 (10) Hudson_Bay 1203872 1046825  157047  1209339 -5467 
 (11) Central_Arctic 3214028 3204979  9049  3186190 27837 
 (12) Bering_Sea 119070 225887 -106817  54836 64234 
 (13) Baltic_Sea 11482 9900  1582  2898 8584 
 (14) Sea_of_Okhotsk 379132 166880  212251  119667 259464 

The overall surplus to average is 148k km2, (2%).  Main deficits in Bering and Barents seas are more than offset by surpluses elsewhere, especially Okhotsk and Hudson Bay. 2022 ice extent exceeds that of 2007 by 3/4 Wadham, most of the difference being in Chukchi and Okhotsk.

bathymetric_map_arctic_ocean

Illustration by Eleanor Lutz shows Earth’s seasonal climate changes. If played in full screen, the four corners present views from top, bottom and sides. It is a visual representation of scientific datasets measuring Arctic ice extents.

Today’s Mildly Icy Climate in Perspective


The diagram at the top shows how grateful we should be for living in today’s climate instead of a glacial icehouse. (H/T Raymond Inauen)  For most of its history Earth has been frozen rather than the mostly green place it is today.  And the reference is to the extent of the North American ice sheet during the Last Glacial Maximum (LGM).

To see this geologically recent glacial period in perspective, consider the maps created by paleo climatologist Christopher Scotese, leader of the Paleomap Project.

The animation below shows how the planet surface changed over the past millions of years (Ma means Millions of years Ago). 

Note that in 66 Ma Earth was a “hothouse” with little ice and green polar land masses.  By 50 Ma cooling resulted in polar ice caps and glaciers. By 14 Ma both Greenland and Antarctica are ice covered. 18Ka a severe “icehouse” world is evidenced by the Laurentian icecap. Then the Modern world appears with the ice retreating, but still covering the two poles. Continental drifts are also shown by India starting as an island and later joining Asia, and by Africa isolated but later approaching Europe.

For further context consider that geologists refer to our time as a “Severe Icehouse World”, among the various conditions in earth’s history, as diagramed below by Christopher Scotese. Referring to the Global Mean Temperatures, it appears after many decades, we are slowly rising to “Icehouse World”, which would seem to be a good thing.

His compete evidence and analysis can be reviewed in his article Some thoughts on Global Climate Change: The Transition from Icehouse to Hothouse.  In that essay Scotese shows where we are presently in this cycle between icehouse and hothouse.

As of 2015 earth is showing a GMT of 14.4C, compared to pre-industrial GMT of 13.8C.  According to the best geological evidence from millions of years of earth’s history, that puts us in the category “Severe Icehouse.”  So, thankfully we are warming up, albeit very slowly. Moreover, progress toward a warming world means flattening the profile at the higher latitudes, especially the Arctic.  Equatorial locations remain at 23C throughout the millennia, while the gradient decreases in a warmer world.

We have many, many centuries to go before the earth can warm up to the “Greenhouse” profile, let alone get to “Hothouse.” Regional and local climates at higher latitudes will see slightly warming temperatures and smaller differences from equatorial climates. These are facts based on solid geological evidence, not opinions or estimates from computer models.

It is still a very cold world, but we are moving in the right direction. Stay the course.

Instead of fear mongering over a bit of warming, we should celebrate our good fortune, and do our best for humanity and the biosphere.  Matthew Ridley takes it from there in a previous post.

Background from previous post The Goodness of Global Warming

LAI refers to Leaf Area Index.

As noted in other posts here, warming comes and goes and a cooling period may now be ensuing. See No Global Warming, Chilly January Land and Sea.  Matt Ridley provides a concise and clear argument to celebrate any warming that comes to our world in his Spiked article Why global warming is good for us.  Excerpts in italics with my bolds and added images.

Climate change is creating a greener, safer planet.

Global warming is real. It is also – so far – mostly beneficial. This startling fact is kept from the public by a determined effort on the part of alarmists and their media allies who are determined to use the language of crisis and emergency. The goal of Net Zero emissions in the UK by 2050 is controversial enough as a policy because of the pain it is causing. But what if that pain is all to prevent something that is not doing net harm?

The biggest benefit of emissions is global greening, the increase year after year of green vegetation on the land surface of the planet. Forests grow more thickly, grasslands more richly and scrub more rapidly. This has been measured using satellites and on-the-ground recording of plant-growth rates. It is happening in all habitats, from tundra to rainforest. In the four decades since 1982, as Bjorn Lomborg points out, NASA data show that global greening has added 618,000 square kilometres of extra green leaves each year, equivalent to three Great Britains. You read that right: every year there’s more greenery on the planet to the extent of three Britains. I bet Greta Thunberg did not tell you that.

The cause of this greening? Although tree planting, natural reforestation, slightly longer growing seasons and a bit more rain all contribute, the big cause is something else. All studies agree that by far the largest contributor to global greening – responsible for roughly half the effect – is the extra carbon dioxide in the air. In 40 years, the proportion of the atmosphere that is CO2 has gone from 0.034 per cent to 0.041 per cent. That may seem a small change but, with more ‘food’ in the air, plants don’t need to lose as much water through their pores (‘stomata’) to acquire a given amount of carbon. So dry areas, like the Sahel region of Africa, are seeing some of the biggest improvements in greenery. Since this is one of the poorest places on the planet, it is good news that there is more food for people, goats and wildlife.

But because good news is no news, green pressure groups and environmental correspondents in the media prefer to ignore global greening. Astonishingly, it merited no mentions on the BBC’s recent Green Planet series, despite the name. Or, if it is mentioned, the media point to studies suggesting greening may soon cease. These studies are based on questionable models, not data (because data show the effect continuing at the same pace). On the very few occasions when the BBC has mentioned global greening it is always accompanied by a health warning in case any viewer might glimpse a silver lining to climate change – for example, ‘extra foliage helps slow climate change, but researchers warn this will be offset by rising temperatures’.

Another bit of good news is on deaths. We’re against them, right? A recent study shows that rising temperatures have resulted in half a million fewer deaths in Britain over the past two decades. That is because cold weather kills about ’20 times as many people as hot weather’, according to the study, which analyses ‘over 74million deaths in 384 locations across 13 countries’. This is especially true in a temperate place like Britain, where summer days are rarely hot enough to kill. So global warming and the unrelated phenomenon of urban warming relative to rural areas, caused by the retention of heat by buildings plus energy use, are both preventing premature deaths on a huge scale.

Summer temperatures in the US are changing at half the rate of winter temperatures and daytimes are warming 20 per cent slower than nighttimes. A similar pattern is seen in most countries. Tropical nations are mostly experiencing very slow, almost undetectable daytime warming (outside cities), while Arctic nations are seeing quite rapid change, especially in winter and at night. Alarmists love to talk about polar amplification of average climate change, but they usually omit its inevitable flip side: that tropical temperatures (where most poor people live) are changing more slowly than the average.

My Mind is Made Up, Don’t Confuse Me with the Facts. H/T Bjorn Lomborg, WUWT

But are we not told to expect more volatile weather as a result of climate change? It is certainly assumed that we should. Yet there’s no evidence to suggest weather volatility is increasing and no good theory to suggest it will. The decreasing temperature differential between the tropics and the Arctic may actually diminish the volatility of weather a little.

Indeed, as the Intergovernmental Panel on Climate Change (IPCC) repeatedly confirms, there is no clear pattern of storms growing in either frequency or ferocity, droughts are decreasing slightly and floods are getting worse only where land-use changes (like deforestation or building houses on flood plains) create a problem. Globally, deaths from droughts, floods and storms are down by about 98 per cent over the past 100 years – not because weather is less dangerous but because shelter, transport and communication (which are mostly the products of the fossil-fuel economy) have dramatically improved people’s ability to survive such natural disasters.

The effect of today’s warming (and greening) on farming is, on average, positive: crops can be grown farther north and for longer seasons and rainfall is slightly heavier in dry regions. We are feeding over seven billion people today much more easily than we fed three billion in the 1960s, and from a similar acreage of farmland. Global cereal production is on course to break its record this year, for the sixth time in 10 years.

Nature, too, will do generally better in a warming world. There are more species in warmer climates, so more new birds and insects are arriving to breed in southern England than are disappearing from northern Scotland. Warmer means wetter, too: 9,000 years ago, when the climate was warmer than today, the Sahara was green. Alarmists like to imply that concern about climate change goes hand in hand with concern about nature generally. But this is belied by the evidence. Climate policies often harm wildlife: biofuels compete for land with agriculture, eroding the benefits of improved agricultural productivity and increasing pressure on wild land; wind farms kill birds and bats; and the reckless planting of alien sitka spruce trees turns diverse moorland into dark monoculture.

Meanwhile, real environmental issues are ignored or neglected because of the obsession with climate. With the help of local volunteers I have been fighting to protect the red squirrel in Northumberland for years. The government does literally nothing to help us, while it pours money into grants for studying the most far-fetched and minuscule possible climate-change impacts. Invasive alien species are the main cause of species extinction worldwide (like grey squirrels driving the red to the margins), whereas climate change has yet to be shown to have caused a single species to die out altogether anywhere.

Of course, climate change does and will bring problems as well as benefits. Rapid sea-level rise could be catastrophic. But whereas the sea level shot up between 10,000 and 8,000 years ago, rising by about 60 metres in two millennia, or roughly three metres per century, today the change is nine times slower: three millimetres a year, or a foot per century, and with not much sign of acceleration. Countries like the Netherlands and Vietnam show that it is possible to gain land from the sea even in a world where sea levels are rising. The land area of the planet is actually increasing, not shrinking, thanks to siltation and reclamation.

Environmentalists don’t get donations or invitations to appear on the telly if they say moderate things. To stand up and pronounce that ‘climate change is real and needs to be tackled, but it’s not happening very fast and other environmental issues are more urgent’ would be about as popular as an MP in Oliver Cromwell’s parliament declaring, ‘The evidence for God is looking a bit weak, and I’m not so very sure that fornication really is a sin’. And I speak as someone who has made several speeches on climate in parliament.

No wonder we don’t hear about the good news on climate change.


Ocean Temps Dropping November 2022


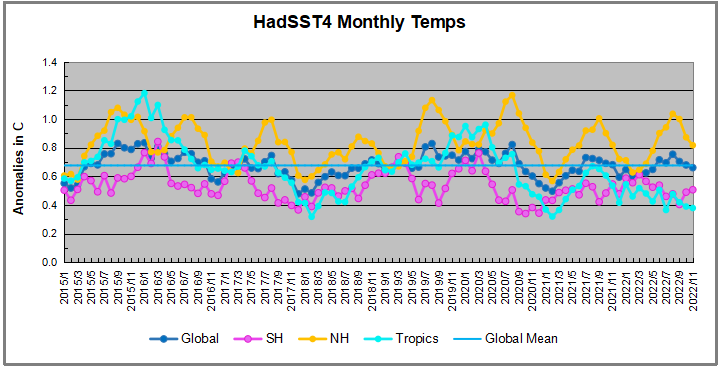
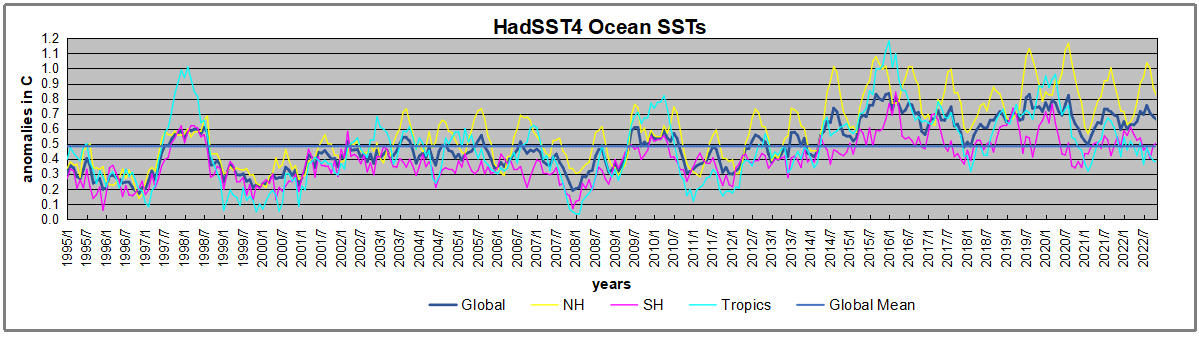
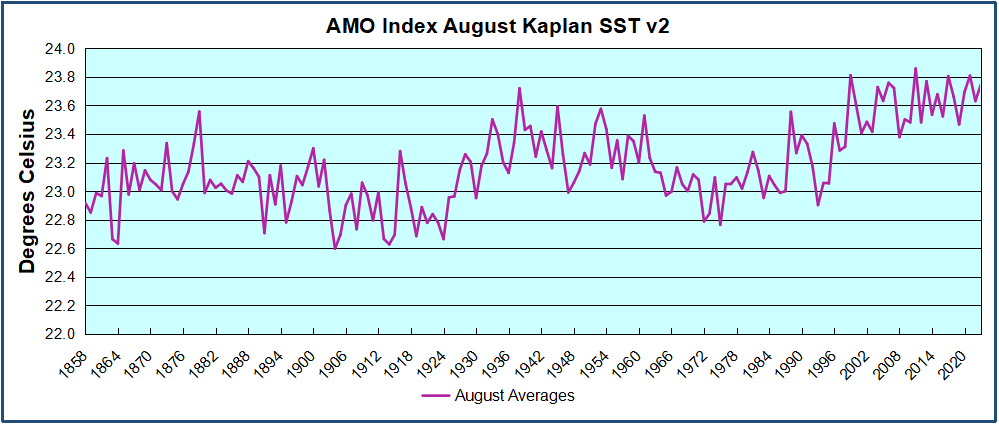
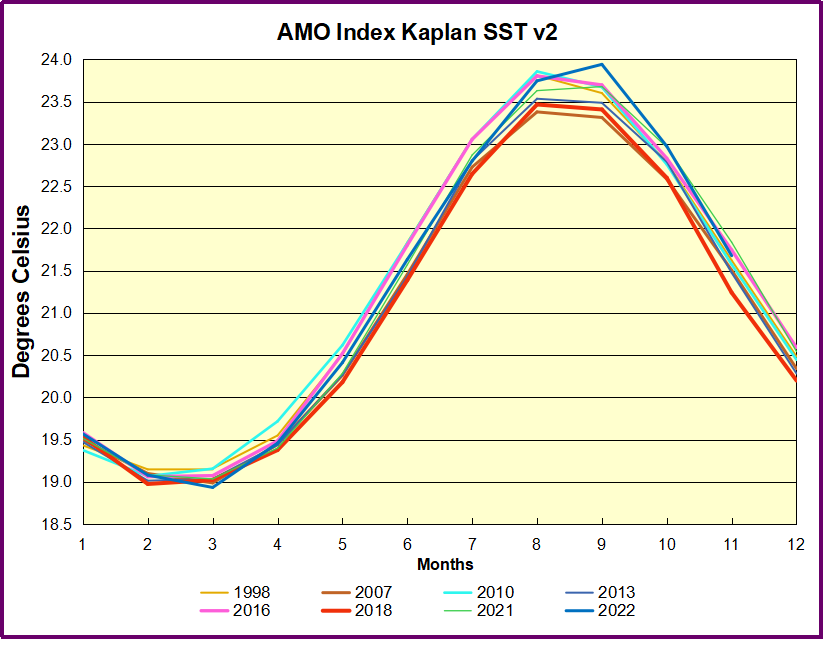
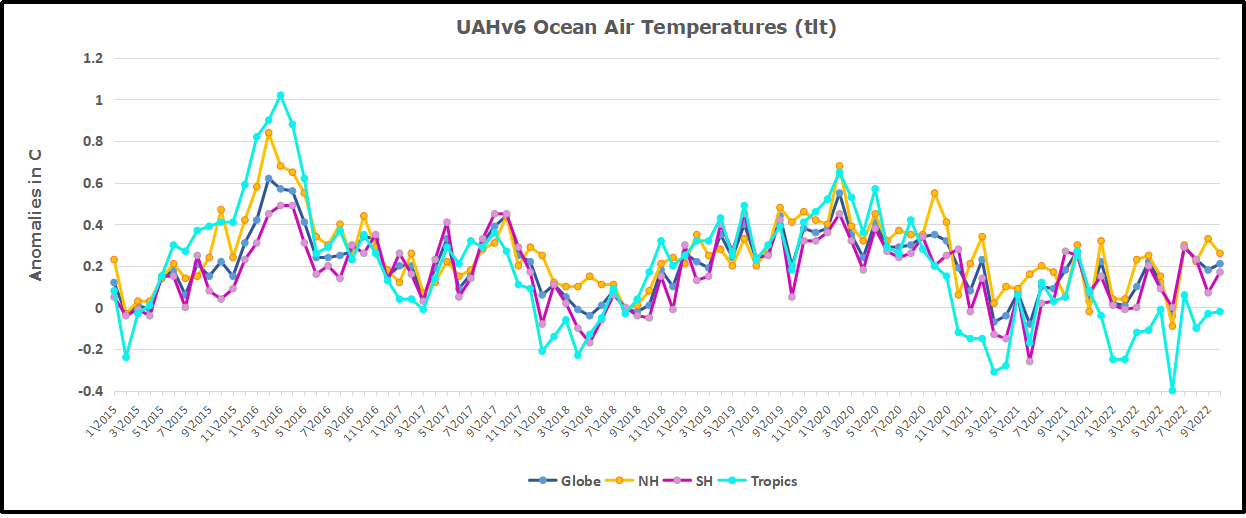
The best context for understanding decadal temperature changes comes from the world’s sea surface temperatures (SST), for several reasons:

  • The ocean covers 71% of the globe and drives average temperatures;
  • SSTs have a constant water content, (unlike air temperatures), so give a better reading of heat content variations;
  • A major El Nino was the dominant climate feature in recent years.

HadSST is generally regarded as the best of the global SST data sets, and so the temperature story here comes from that source. Previously I used HadSST3 for these reports, but Hadley Centre has made HadSST4 the priority, and v.3 will no longer be updated.  HadSST4 is the same as v.3, except that the older data from ship water intake was re-estimated to be generally lower temperatures than shown in v.3.  The effect is that v.4 has lower average anomalies for the baseline period 1961-1990, thereby showing higher current anomalies than v.3. This analysis concerns more recent time periods and depends on very similar differentials as those from v.3 despite higher absolute anomaly values in v.4.  More on what distinguishes HadSST3 and 4 from other SST products at the end. The user guide for HadSST4 is here.

The Current Context

The chart below shows SST monthly anomalies as reported in HadSST4 starting in 2015 through November 2022.  A global cooling pattern is seen clearly in the Tropics since its peak in 2016, joined by NH and SH cycling downward since 2016. 

Note that in 2015-2016 the Tropics and SH peaked in between two summer NH spikes.  That pattern repeated in 2019-2020 with a lesser Tropics peak and SH bump, but with higher NH spikes. By end of 2020, cooler SSTs in all regions took the Global anomaly well below the mean for this period.  In 2021 the summer NH summer spike was joined by warming in the Tropics but offset by a drop in SH SSTs, which raised the Global anomaly slightly over the mean. Now in 2022, another strong NH summer spike has peaked in August, but this time both the Tropic and SH are countervailing, resulting in only slight Global warming, now receding to the mean.  Now dropping Oct./Nov. temps in NH and the Tropics have taken the Global anomaly below the average for this period. Note that 2022/11 Tropical SSTs are 0.8C below their peak in 2015.

A longer view of SSTs

To enlarge image open in new tab.

The graph above is noisy, but the density is needed to see the seasonal patterns in the oceanic fluctuations.  Previous posts focused on the rise and fall of the last El Nino starting in 2015.  This post adds a longer view, encompassing the significant 1998 El Nino and since.  The color schemes are retained for Global, Tropics, NH and SH anomalies.  Despite the longer time frame, I have kept the monthly data (rather than yearly averages) because of interesting shifts between January and July.1995 is a reasonable (ENSO neutral) starting point prior to the first El Nino. 

The sharp Tropical rise peaking in 1998 is dominant in the record, starting Jan. ’97 to pull up SSTs uniformly before returning to the same level Jan. ’99. There were strong cool periods before and after the 1998 El Nino event. Then SSTs in all regions returned to the mean in 2001-2. 

SSTS fluctuate around the mean until 2007, when another, smaller ENSO event occurs. There is cooling 2007-8,  a lower peak warming in 2009-10, following by cooling in 2011-12.  Again SSTs are average 2013-14.

Now a different pattern appears.  The Tropics cooled sharply to Jan 11, then rise steadily for 4 years to Jan 15, at which point the most recent major El Nino takes off.  But this time in contrast to ’97-’99, the Northern Hemisphere produces peaks every summer pulling up the Global average.  In fact, these NH peaks appear every July starting in 2003, growing stronger to produce 3 massive highs in 2014, 15 and 16.  NH July 2017 was only slightly lower, and a fifth NH peak still lower in Sept. 2018.

The highest summer NH peaks came in 2019 and 2020, only this time the Tropics and SH were offsetting rather adding to the warming. (Note: these are high anomalies on top of the highest absolute temps in the NH.)  Since 2014 SH has played a moderating role, offsetting the NH warming pulses. After September 2020 temps dropped off down until February 2021.  Now in 2021-22 there are again summer NH spikes, but in 2022 moderated first by cooling Tropics and SH SSTs, now in October and November by deeper cooling in NH and Tropics.

What to make of all this? The patterns suggest that in addition to El Ninos in the Pacific driving the Tropic SSTs, something else is going on in the NH.  The obvious culprit is the North Atlantic, since I have seen this sort of pulsing before.  After reading some papers by David Dilley, I confirmed his observation of Atlantic pulses into the Arctic every 8 to 10 years.

But the peaks coming nearly every summer in HadSST require a different picture.  Let’s look at August, the hottest month in the North Atlantic from the Kaplan dataset.

The AMO Index is from from Kaplan SST v2, the unaltered and not detrended dataset. By definition, the data are monthly average SSTs interpolated to a 5×5 grid over the North Atlantic basically 0 to 70N. The graph shows August warming began after 1992 up to 1998, with a series of matching years since, including 2020, dropping down in 2021.  Because the N. Atlantic has partnered with the Pacific ENSO recently, let’s take a closer look at some AMO years in the last 2 decades.

This graph shows monthly AMO temps for some important years. The Peak years were 1998, 2010 and 2016, with the latter emphasized as the most recent. The other years show lesser warming, with 2007 emphasized as the coolest in the last 20 years. Note the red 2018 line is at the bottom of all these tracks. The heavy blue line shows that 2022 started warm, dropped to the bottom and stayed near the lower tracks.  Note the strength of this summer’s warming pulse, in September peaking to nearly 24 Celsius, a new record for this dataset. Now in November the SSTs are closer to the middle.

Summary

The oceans are driving the warming this century.  SSTs took a step up with the 1998 El Nino and have stayed there with help from the North Atlantic, and more recently the Pacific northern “Blob.”  The ocean surfaces are releasing a lot of energy, warming the air, but eventually will have a cooling effect.  The decline after 1937 was rapid by comparison, so one wonders: How long can the oceans keep this up? If the pattern of recent years continues, NH SST anomalies will likely decline in coming months, along with ENSO also weakening will probably determine a cooler outcome.

Footnote: Why Rely on HadSST4

HadSST is distinguished from other SST products because HadCRU (Hadley Climatic Research Unit) does not engage in SST interpolation, i.e. infilling estimated anomalies into grid cells lacking sufficient sampling in a given month. From reading the documentation and from queries to Met Office, this is their procedure.

HadSST4 imports data from gridcells containing ocean, excluding land cells. From past records, they have calculated daily and monthly average readings for each grid cell for the period 1961 to 1990. Those temperatures form the baseline from which anomalies are calculated.

In a given month, each gridcell with sufficient sampling is averaged for the month and then the baseline value for that cell and that month is subtracted, resulting in the monthly anomaly for that cell. All cells with monthly anomalies are averaged to produce global, hemispheric and tropical anomalies for the month, based on the cells in those locations. For example, Tropics averages include ocean grid cells lying between latitudes 20N and 20S.

Gridcells lacking sufficient sampling that month are left out of the averaging, and the uncertainty from such missing data is estimated. IMO that is more reasonable than inventing data to infill. And it seems that the Global Drifter Array displayed in the top image is providing more uniform coverage of the oceans than in the past.

uss-pearl-harbor-deploys-global-drifter-buoys-in-pacific-ocean

USS Pearl Harbor deploys Global Drifter Buoys in Pacific Ocean

Footnote Rare Triple Dip La Nina Likely This Winter

Here’s Where a Rare “Triple Dip La Niña” Might Drop the Most Snow This Winter Ski Mag

The unusual weather phenomenon might result in the snowiest season in years for some parts of the country.

The long-range winter forecast could be good news for skiers living in the certain parts of the U.S. and Canada. The National Oceanic and Atmospheric Administration (NOAA) estimates that the chance of a La Niña occurring this fall and early winter is 86 percent, and the main beneficiary is expected to be mountains in the Northwest and Northern Rockies.

If NOAA’s predictions pan out, this will be the third La Niña in a row—a rare phenomenon called a “Triple Dip La Niña.” Between now and 1950, only two Triple Dips have occurred.

Smith also notes that winters on the East Coast are similarly tricky to predict during La Niña years. “In the West, you’re simply looking for above-average precipitation, which typically translates to above-average snowfall, but in the East, you have temperature to worry about as well … that adds another complication.” In other words, increased precip could lead to more rain if the temperatures aren’t cooperative.

The presence of a La Niña doesn’t always translate to higher snowfall in the North, either, as evidenced by last ski season, which saw few powder days.

However, in consecutive La Niña triplets, one winter usually involves above-average snowfall. While this historical pattern isn’t tied to any documented meteorological function, it could mean that the odds of a snowy 2022’-’23 season are higher, given the previous two La Niñas didn’t deliver the goods.


Corrupt Fourth Estate (News Media)


Overview

France under the Ancien Régime (before the French Revolution) divided society into three estates: the First Estate (clergy); the Second Estate (nobility); and the Third Estate (commoners). The king was considered part of no estate.  In the 19th century, fourth estate came to refer exclusively to the press, and now it’s applied to all branches of the news media. 

In the United States, the term fourth estate is sometimes used to place the press alongside the three branches of government: legislative, executive and judicial. The fourth estate refers to the watchdog role of the press, one that is important to a functioning democracy.

The Fifth Estate is a socio-cultural reference to groupings of outlier viewpoints in contemporary society, and is most associated with bloggers, journalists publishing in non-mainstream media outlets, and the social media or “social license”.

As discussed below, the Fourth Estate has been corrupted,
suborned by political ideology,
while parts of the Fifth Estate have also lost their independence.

Rex Murphy writes at National Post The Hunter Biden story should make us think twice about censorship.  Excerpts in italics with my bolds. and added images.

There’s a lesson for Canadians in the shocking Twitter Files revelations

You’ve been hearing a lot about misinformation from the present government. And disinformation, which is simply a respelling of the same word brought in by those pushing for censorship (they call it by a different name) to pump up their case that there’s a huge need for government oversight of all online information sources, particularly blogs, independent reporters and independent news agencies.

I think it is an axiom that the very last authority anybody wants to be deciding what is real or true news, and what is not, is a government. As it is also an axiom, or used to be, that the press and the government exist as opposed categories, that a democratic press in particular has a predominantly oppositional role to state authority.

It questions, tests, investigates and challenges. At least it used to. But that was a distant yesterday. Today the press, or what we may call the institutional or mainline press, is suffering a mighty loss of trust. Many major outlets are seen by the public, and in very many cases should so be seen, as having adopted partisan or ideological roles, reporting only what coincides with owners’ or editors’ or reporters’ own predispositions, party affiliations and personal biases.

The biggest story in the 2020 presidential race — let me rephrase that, what I think should have been the biggest story — was the New York Post’s report on Hunter Biden, Joe Biden’s son. The Post had obtained the contents of a forgotten laptop (it was left at a computer repair shop) that appeared to belong to Hunter Biden. It contained much salacious material. If anything comparable had shown up on a laptop belonging to Donald Trump Jr., the story would have been blasted on every television screen in America and treated to 24-hours-a-day coverage on National Public Radio.

The New York Post’s story, however headlined, was not the salacious stuff but the more significant news that — possibly — Hunter Biden had used his father’s influence to enrich himself in foreign business dealings. The online headline went: “Smoking-gun email reveals how Hunter Biden introduced Ukrainian businessman to VP dad.”

I have to skip a lot of details here. They are easily found. Now this story was near the end of the presidential election campaign. It had, if confirmed, the power to explode the race. But, almost instantly, it was smothered, ignored by all the big outlets, condemned as likely Russian disinformation. Since then, it is very important to record, the same outlets have verified that much of what the New York Post reported was correct.

The most egregious action was taken by the multibillion-dollar Twitter organization.
It disabled the New York Post’s account.

A useful summary of what was involved comes in a recent column from Douglas Murray: The Post “dared to print information that was of public interest. It was information that exposed corruption on an extraordinary scale in what is now the first family. Not just the president’s son being paid to sit on the board of a Ukrainian energy company when he had no knowledge of energy or Ukraine. But things like the almost $5 million that Hunter and his Uncle James raked in over 14 months from just one Chinese energy conglomerate.”

That’s what Twitter, joined by Facebook, suppressed and actively censored. It closed down a whole newspaper’s feed and labelled it as misinformation — as well as closing down the account of the White House press secretary. And the most smug outlet of all, NPR, at the time, had the gall to publish this prissy dismissal from its public editor: “We don’t want to waste our time on stories that are not really stories, and we don’t want to waste the listeners’ and readers’ time on stories that are just pure distractions.”

Need I add that later, much later, well after the election, pious NPR issued a “correction” to an online article that had falsely asserted U.S. intelligence had discredited the laptop story.

Jump ahead to today. Thanks to the Elon Musk takeover, the machinations of Twitter, its manipulations and biases, its patrolling of accounts, its secret monitoring, shadow-banning or full shutdown of conservative viewpoints, is now clear and utterly undeniable. And scandalous in the full sense.

This revelation is itself huge news. It reveals the lie behind the drive to oversee the internet under the guise of protecting the public from misinformation. Because in addition to Twitter doing its own censoring, it also established contact with U.S. government and political actors. It was one big circle. Big government and big tech in collusion.

And, just to note the obvious: while the New York Post was being censored, you could hunt Canadian outlets — say the CBC — for news and reaction and find nothing. Should it have been Donald Trump Jr. involved, the panels and pundits would still be talking about it. Also, check Canadian outlets today for how much coverage this Twitter scandal gets.

Here’s a clue: when authorities talk about misinformation, they are spreading misinformation. And when the “most transparent administration in Canadian history” (just who was in that $6,000-a-night hotel room? Still waiting …) talks about “protecting the public” from misinformation, well, you have a choice: either laugh or cry.

Footnote: 

Liberals cite privacy laws when asked which media outlets got its $600M bailout.

The Trudeau government is citing confidentiality and “taxpayer information” to hide from the public which legacy media companies accepted money from its $600 million media bailout.

According to Blacklock’s Reporter, the Revenue Agency withheld the details of the cash payments in response to an Inquiry of Ministry tabled in the House of Commons.

Very few federal payments to media have been disclosed since the bailout was first crafted. 

Critics of the bailout including CWA Canada president Martin O’Hanlon called the program “heavily skewed” toward favoured papers.

“This is skewed heavily in favour of entrenched newspapers and their managers,” said O’Hanlon. “If this was supposed to be open and transparent, I don’t think that happened here. They chose the people they wanted to get the answers they wanted.”

More from American Thinker

Stick a fork in Canada

At this point, media companies become nothing more than state media outlets, mouthpieces of government, akin to Pravda or the Korean Central News Agency. They have abandoned all pretense of objectivity, neutrality, and “journalistic ethics” and simply voluntarily opted to be the propaganda arm of a political party. In Canada’s case, it’s the Liberal Party — in America’s, the Democrat party.

In days of yore, the Fourth Estate claimed that its job was to “speak truth to power.” Today, it is happy suckling on the government’s teat while hiding the truth from everyone still naïve or dumb enough to believe it.

Incredibly, in 2019, Canuck prime minister Justin Trudeau made an election-year promise that the Liberals would give the nation’s legacy media $595 million in federal assistance over four years. (And he won, proving that far too many Canadians’ brains are permanently frozen.) So much for a “free press.” And this is a kind of “feedback loop,” with a propagandizing press preventing people from accessing and processing unbiased, accurate information. Separation of church and state? How about separation of media outlets and state when “liberals” are in power?

After prevailing in the election, the Trudeau government promptly amended Canada’s Income Tax Act to allow for 25-percent payroll rebates to news companies, a measure subsequently approved by the minister of revenue.

The beat rolls on.

Dr. Li-Meng Yan: President Xi Jinping’s China

As noted in a previous post linked later on, Dr. Li-Meng Yan was one of the first to make the case for WuFlu created and released from Wuhan, China. Derided at the time (2020), she is now vindicated and goes further to explain current events in China, as reported in UncoverDC.  Excerpts in italics with my bolds.

Dr. Li-Meng Yan graciously agreed to speak with UncoverDC for two hours on Tuesday about President Xi’s terrifying grip on mainland China. Dr. Yan says Xi is, for all intents and purposes, now the “Emperor” of China, a “sociopath” who has been consolidating power for many years. Dr. Yan flew to the U.S. from Hong Kong, where she worked in a prominent virology lab at the University of Hong studying coronaviruses and other emerging viral diseases under Malik Peiris on April 28, 2020. Yan says she has a “duty” to inform the world about the dangers of Communist China under Xi Jinping.

Peiris is a powerful, CCP-linked virologist at The University of Hong Kong. In 2003, Professor Peiris and his research team “discovered SARS-CoV, a novel coronavirus, as the etiological agent for SARS.” Through her trustworthy network of mainland China friends and colleagues, Dr. Yan began to investigate the origins of SARS-CoV-2. She is exposing how Xi purposely allowed the highly transmissible virus to travel outside China, crushing Western economies and killing many people unnecessarily. She claims the virus was well-coordinated by the PLA in China and was not limited to the lab in Wuhan. Yan communicated anonymously with a Chinese broadcaster based in the West whose channel is Lude media. He helped her get the word out through his broadcasts.

Dr. Yan says there is no doubt that the pandemic is indirectly responsible for the current protests in response to the lockdowns in China. However, she clarifies that while the press—both in China and in Western countries—are reporting the lockdowns are because of reinstated COVID policies, she says the lockdowns have “nothing to do with COVID.” During the pandemic, it became brutally clear to the mainland Chinese that President Xi’s draconian Zero Covid policies were “anti-human” and really had very little to do with protecting the people of China. Rather, she says Xi used the pandemic as a way to further extend and tighten his grip on the country. Dr. Yan explains:

“It is not COVID at all. SARS-CoV-2 is a weapon, a weapon more powerful than traditional bioweapons. So you see that it was released to foreign countries. It created a lot of social problems and chaos, and when it happened in China, it actually gave Xi great pretext to launch this very strict policy to restructure China’s society, its culture, and its people.

I believe Xi Jinping is using the People’s Liberation Army now to transform China from a peaceful time to wartime policies. It is a period of reformation. He is reinforcing his power with policies to control people, minimize people’s living standards, concentrate the money in his favor in places like the biomedical technology and weapons industry. He is training people to become obedient to listen to these ridiculous anti-human rules. This type of policy has been adopted by emperors in China going back 2000 years. Xi Jinping is using it in a modern way. “

Xi’s social credit system is used masterfully to control the movement of citizens. It is a “digital cuff.” Those who have cell phones are tracked and monitored no matter where they go. They are forced to use a “traffic light system,” red for no-go zones, or to indicate an individual does not have permission to move. Green means you are free to move about based on whether you have been tested or, many times, whether you “know the right local authorities.” It is human-tracked, which means there are people, local police, volunteers, and Party members who monitor and control all movement. Elderly people who do not know how to use the digital system are tracked on paper at checkpoints. Cameras are collecting biometric data everywhere. The tracking system is everywhere, not just in big cities. This policy is a “national strategy,” just like the “one-child policy.”

Additionally, President Xi recruited people all over China who wear white PPE-type uniforms. These enforcers are called “Big Whites,” and they enforce the lockdowns and movement of Chinese citizens. Big Whites are civilians hired with the promise of “big salaries” during the pandemic. Few have been compensated, and local CCP officials are now punishing many for asking to be paid. According to Yan, “Big whites are allowed to legally break into people’s homes. They can rape girls, kill their pets, take their possessions, and people are not allowed to get help. If the people call to get help, the message will be deleted, and the police will come and tell them to shut up.”

Yan says the protests are much more widespread than in the days of Tiananmen Square. Over 170 Universities country-wide have organized protests simultaneously, and it is not just the young protesting. Yan referenced a December 3, 2022, column by the New York Post that documented four Chinese citizens and their reasons for protesting. Many protested because of a deadly apartment fire in northwestern China’s Xinjiang region that allegedly killed ten people. These people were locked in the building from the outside because of the Zero COVID policy. One resident said, “Xinjiang is an open-air prison.”

Background from Previous Post Why Wu Flu Virus Looks Man-made

Doctor Li-Meng Yan, a scientist who studied some of the available data on COVID-19 has published her claims on Zenodo, an open access digital platform. She wrote that she believed COVID-19 could have been “conveniently created” within a lab setting over a period of just six months, and “SARS-CoV-2 shows biological characteristics that are inconsistent with a naturally occurring, zoonotic virus”.

The paper by Yan, Li-Meng; Kang, Shu; Guan, Jie; Hu, Shanchang  is Unusual Features of the SARS-CoV-2 Genome Suggesting Sophisticated Laboratory Modification Rather Than Natural Evolution and Delineation of Its Probable Synthetic Route.   A brief synopsis in italics with my bolds.

We present three lines of evidence to support our contention that laboratory manipulation is part of the history of SARS-CoV-2:

i. The genomic sequence of SARS-CoV-2 is suspiciously similar to that of a bat coronavirus discovered by military laboratories in the Third Military Medical University (Chongqing, China) and the Research Institute for Medicine of Nanjing Command (Nanjing, China).

ii. The receptor-binding motif (RBM) within the Spike protein of SARS-CoV-2, which determines the host specificity of the virus, resembles that of SARS-CoV from the 2003 epidemic in a suspicious manner. Genomic evidence suggests that the RBM has been genetically manipulated.

iii. SARS-CoV-2 contains a unique furin-cleavage site in its Spike protein, which is known to greatly enhance viral infectivity and cell tropism. Yet, this cleavage site is completely absent in this particular class of coronaviruses found in nature. In addition, rare codons associated with this additional sequence suggest the strong possibility that this furin-cleavage site is not the product of natural evolution and could have been inserted into the SARS-CoV-2 genome artificially by techniques other than simple serial passage or multi-strain recombination events inside co-infected tissue cultures or animals.


How Climate Evangelists Took Over Your Local Weather Forecast


The battle by alarmists for hearts and minds is extending to many fronts, including recruiting family doctors, and in the case of this post, media weather reporters. Surveys have shown the meteorologists are not more convinced of global warming/climate change than is the American public (a slight majority). But efforts have been underway to convert them and use their telecasts and columns to promote climatism.

Luke Mullins writes at Washingtonian This George Mason Professor Trains Weathercasters to Be Climate Advocates.  Excerpts in italics with my bolds.

You’ve probably seen his handiwork on local TV and didn’t even know it.

About 13 years ago, Ed Maibach identified a TV meteorologist in Columbia, South Carolina, who was willing to use his airtime not just to provide tomorrow’s forecast but to show viewers how climate change was impacting their local community. Over the next decade, Maibach would expand this experiment into what you might call a weather underground—a coast-to-coast network of TV weathercasters who believe that educating their audiences about global warming is as crucial as telling them when to bring an umbrella. The initiative, known as Climate Matters, has forced Maibach to confront a series of entrenched problems inside the broadcast-­meteorology community, including alarming levels of climate denial and skepticism, fears about alienating audiences, and the occasional harassment of participating weathercasters.

Yet by the end of 2021, the Climate Matters network of meteorologists had penetrated into nearly every media market in the country, and Maibach had pioneered a promising new approach to a complex crisis.

Truth is, if you’ve recently watched the weather report on the local news in the Washington area, there’s a decent chance you’ve seen Maibach’s handiwork—the Climate Matters network now includes weathercasters at NBC4, WUSA9, WJLA7, and Fox 5. But like local-news consumers across the country, you wouldn’t have known that behind that telegenic meteorologist are a social scientist in his sixties and a team of academic researchers, data crunchers, and ex-weathercasters. “To a lot of our viewers, it’s lost on them how much work Climate [Matters] really is doing,” says Kaitlyn McGrath, a meteorologist at WUSA9. “But it is so far from lost on us.”

Background from previous post:

A balanced and analytical report appears in Bloomberg (an interesting place for such independent thinking).  Climate Evangelists Are Taking Over Your Local Weather Forecast Excerpts below.

Amber Sullins gets a minute or two to tell up to two million people about some extremely complicated science, using the tools of her trade: a pleasant voice, a green screen, and small icons denoting sun, clouds, rain, and wind. She is the chief meteorologist at ABC15 News in Phoenix, so her forecasts mostly call for sunshine. Within this brief window, however, Sullins sometimes manages to go beyond the next five days. Far beyond.

Amber Sullins, weather reporter at ABC15 News in Phoenix.

“We know climate change could affect everything about the way we live in the future, from agriculture and tourism to productivity and local business,” she once noted. “But at what cost?”

It was a 35-second segment in a nightly newscast, a mundane moment preceding reports about three fallen firefighters in Washington state and a dangerous development for air travelers. But that climate-focused scene, and hundreds of others like it playing out at local news stations across the country, marks a major shift in the way Americans hear about climate change. The safe and familiar on-air meteorologist, with little notice by viewers, has become a public diplomat for global warming.

There are about 500 broadcasters like Sullins and Morales, who each receive regular data dumps and ready-to-use graphics from Climate Matters, an organization whose mission is to turn TV meteorologists into local climate educators. The program was founded in 2010 by Climate Central, a research-and-journalism nonprofit, with help from George Mason University, the American Meteorological Society, and others. Newscasters who participate are sent possible topics for climate-related segments every week, with TV-ready data and graphics pegged to large-scale meteorological events, such as unusually high heat or precipitation, local trends, or seasonal themes.

Two-thirds of 18- to 64-year-olds in the U.S. watch a news broadcast, either on TV or a digital device, at least once a week, according to 2015 research by the market research company SmithGeiger LLC. Nearly 40 percent of people within this wide age group watch broadcast news on daily basis, and the reliable presence of an on-air meteorologist is a huge part of the draw.

“Local TV news wouldn’t exist any more if it weren’t for the weathercasts,” says Ed Maibach, director of George Mason University’s Center for Climate Change Communication.

Part of meteorologists’ reluctance to talk about the climate stems from the treacherous tools of their trade. Meteorologists learn very quickly that weather models are messy. Some no doubt sour on finicky climate models because of this experience. If short-term weather models make mistakes, it may seem reasonable to assume that a model projecting into the next century is ridiculous.

“Meteorologists are used to looking at models and being burned,” says Paul Douglas, a former TV weatherman-turned-serial entrepreneur, who recently published a book on climate change and faith.

Sullins, 34, knows there’s tension in telling her viewers about conditions in the 22nd century when she is reluctant to commit to a two-week forecast. “I can’t tell you what the high temperature is going to be on July 4 of this year, today,” Sullins says. “I can’t possibly tell you that. But I can tell you, based on climate, that in July, here in Phoenix, it’s going to be over 100 degrees. That’s easy.”

Her point is that weather and climate are “two entirely different beasts.” It’s like the difference between someone’s mood and disposition, Sullins says. She wants viewers of the nightly news to spend more time thinking about the planet’s disposition.

Summary

The PR campaign continues and intensifies with simplistic soundbites to persuade people to fear the future, in order to advance the anti-fossil fuel agenda. It is a Chinese water torture program well-funded and essential to the climate crisis industry.

But note the logical fallacy in Sullins’ statement above. She says: “I can tell you, based on climate, that in July, here in Phoenix, it’s going to be over 100 degrees.” That’s not climate change, that’s climate stability, something we depend on despite the fear-mongering.

How will viewers respond to this?  Will ratings improve by watching weather people jumping the shark? (It didn’t work for “Happy Days” TV show).  Or will people resent the attempted brainwashing and switch channels?

Footnote:

The hottest temperatures ever reported in Phoenix came in January 2015, when Fox 10 weatherman Cory McCloskey faced a malfunctioning temperature map on live television. “Wow, 750 degrees in Gila Bend right now,” he said, without breaking a sweat. “And 1,270 in Ahwatukee. Now, I’m not authorized to evacuate, but this temperature seems pretty high.” More than 6 million people have watched the blooper on YouTube.

See Also Urban Flooding: The Philadelphia Story