Climatists Against Growing Rice, Because . . .Methane

Beautiful rice terraces in the morning light near Tegallalang village, Ubud, Bali, Indonesia.

M Dowling reports at Independent Sentinel They’re Coming for Your Rice, But We Always Have Bugs.  Excerpts in italics with my bolds and added images.

Rice feeds half the world

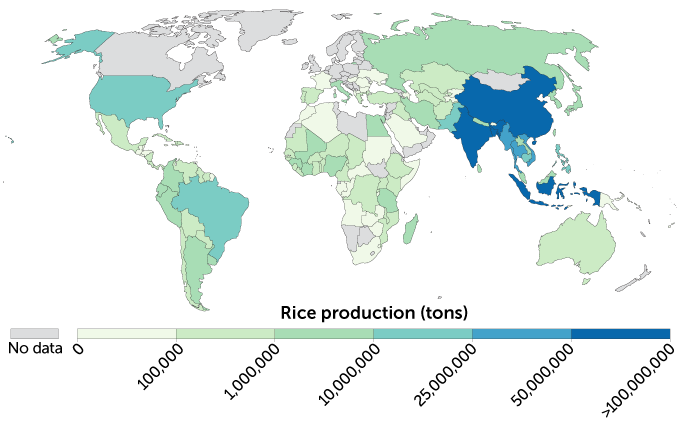
The top rice producers are in Asia The world’s top rice producer is China, at 214 million metric tons. India, Bangladesh, Indonesia and Vietnam are next. In Africa, Nigeria (6.8 million) is the largest producer. Brazil (11.8 million) and the United States (10.2 million) are also top producers, according to 2018 data from the U.N. Food and Agriculture Organization.

But Now This Warning


The new “crisis” came at us in 2019 from Klaus Schwab’s World Economic Forum:  This is how rice is hurting the planet   Global rice production is releasing damaging greenhouse gases into the atmosphere, doing as much harm as 1,200 average-sized coal power stations, according to the Environmental Defense Fund (EDF).

The UN Food and Agriculture Organization (FAO) estimates around 770 million tonnes of rice were produced in 2018, with China and India responsible for approximately half of that amount.

Flooding isn’t strictly necessary for rice to grow – it’s an efficient way of preventing the spread of invasive weeds. It’s so fundamental to how many rice farmers operate that it’s not easy to imagine it being grown any other way…

Microbes that feed off decaying plant matter in these fields produce the greenhouse gas methane. And because rice is grown so prolifically, the amount being created is not to be sniffed at – around 12% of global annual emissions.

This crisis is as bogus as the rest of the asbsurdities Schwab conjures up.
Dr. William Happer at C-Fact explains the issue with methane gas.

Methane, the molecule CH4, is the main constituent of natural gas. Animals like cattle and sheep belch methane as they chew their cud. They are able to get more energy from forage by digesting some of the cellulose with the aid of methane-generating microorganisms in their stomachs. Termites use the same trick to digest wood. Microorganisms in soils, notably rice paddies, also emit large amounts of methane.”

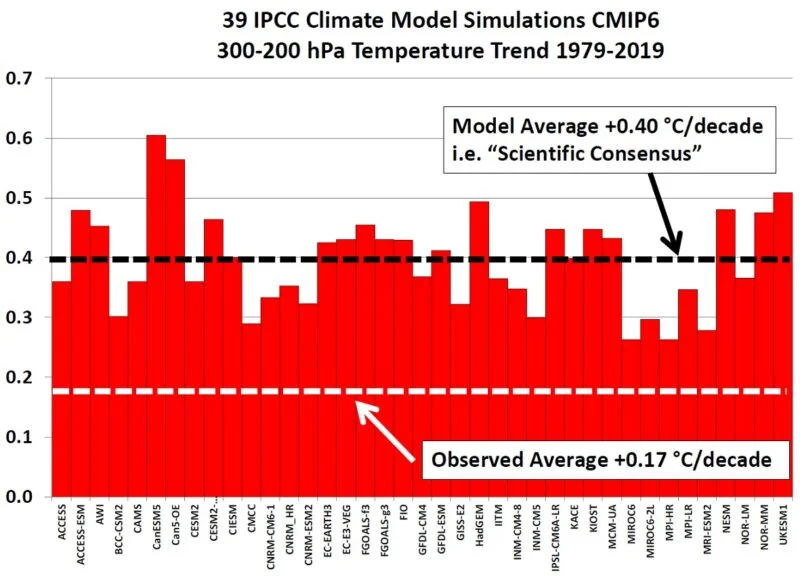
“Few realize that large increases in the concentrations of greenhouse gases cause very small changes in the heat balance of the atmosphere. Doubling the concentration of methane – a 100% increase, which would take about 200 years at the current growth rates – would reduce the heat flow to space by only 0.3%, leading to an average global temperature change of only 0.2 °C. This is less than one-quarter of the change in temperature observed over the past 150 years.

“Most of the predicted catastrophic warming from greenhouse gas emissions is due to positive feedbacks that are highly speculative, at best. In accordance with Le Chatelier’s principle, most feedbacks of natural systems are negative, not positive.

It wouldn’t do much!

“So, even if regulations on U.S. methane emissions could completely stop the increase of atmospheric methane (they can’t), they would likely only lower the average global temperature in the year 2222 by about 0.2 °C, a completely trivial amount given that humans have adapted to a much larger change over the past century while reducing climate deaths by over 98%. And U.S. regulations will have little influence on global emissions, where producers are unlikely to be as easily cowed.

“Given that consumption of fossil fuels is likely to increase over the next few decades as developing countries pull themselves out of poverty, restrictions on U.S. oil and gas production will simply shift production to autocratic nations such as Russia, which have much higher methane-emissions rates than U.S. producers do.

“In fact, there is no climate emergency and there will not be one,
with or without new regulations on methane emissions.”

“However, you can bet that if the Biden administration is successful in promulgating regulations on oil and gas producers, it will expand these efforts into ranching and agriculture, which emit about the same amount of methane as energy production. No sector of the economy will remain untouched by the EPA’s long arm of climate regulations.

Give Daisy and the Rice Farmers a Break!

Background Post Climatists Aim Forks at Our Food Supply

The attack on world food supply has four prongs to it, just like the forks in the image.

1.  Exaggerate the Minor Climate Impact of Methane (CH4)

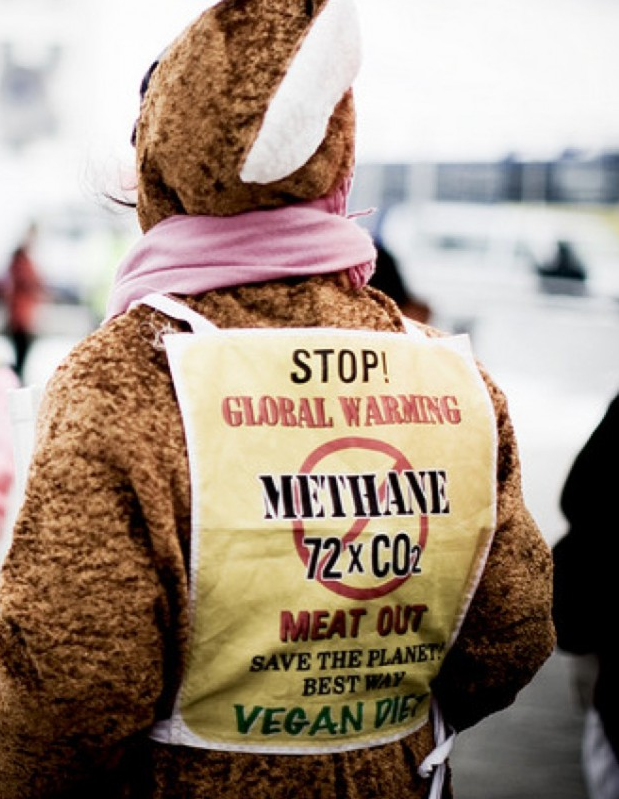
2.  Oppose Methane from Livestock as a Fossil Fuel, like Coal and Oil.

3. Freak Out over N2O as an Excuse to Ban Fertilizers

4.  Meat Shame People’s Diets Because Vegans Love Animals


More Federal Climate Lawfare

Todd Rokita, AG Indiana, asks in his Newsweek article Why Did The U.S. Solicitor General Flip-Flop on Climate Change? Excerpts in italics with my bolds and added images.

In a case called Suncor Energy Inc. v. Board of County Commissioners of Boulder County, U.S. Solicitor General Elizabeth Prelogar recently told the Supreme Court that climate-change cases should be heard not in federal courts, but in deep-blue, progressive state courts.  Calling this proposal politically opportunistic would be an understatement.

Sixteen states disagree, as we have made known through a brief
filed by my office. Federal law should govern this and similar cases,
according to legal precedent.

My office always stands for the rule of law and fights for it in the courtroom. This case is no different, as it represents a sharp departure from the Justice Department’s longstanding view that global climate change is a federal issue that belongs in federal court.

The jurisdictional issue may seem mundane, but the stakes are high.  At a time when energy costs already burden hardworking families, environmental activists insist on banning cost-efficient, safe energy production practices. Unable to push their environmental agenda through Congress, they have turned to a series of multi-billion-dollar lawsuits against energy companies in state courts across the country alleging that state and local governments suffer harm from climate change.

The central claims of these cases are that fossil fuel extraction imposes net harm on the world, leading to climate change, and that energy production and promotion are a “public nuisance” for which energy companies must pay.

Federal courts would undoubtedly reject these claims, which is why activists
are fighting to keep their claims in front of their favorite state courts.

The Office of the Solicitor General had previously taken a stand against such gamesmanship, recognizing that climate change claims are inherently federal. But the current solicitor general’s abrupt departure from that position confirms that politics has replaced law in her office.

The solicitor general represents the United States before the Supreme Court and is the only federal officer required by statute to be “learned in the law”—a high calling. Past solicitors general described their obligation to speak “on behalf of the rule of law.”

The Supreme Court relies on the solicitor general to be a non-partisan, trustworthy representative and interpreter of the law. In the words of Seth P. Waxman, solicitor general during the Clinton administration, this “special relationship to the Court is not one of privilege, but of duty”—a duty that includes an obligation “to respect and honor the principle of stare decisis,” meaning consistency over time regardless of the political interests of the current administration.

Interstate environmental issues, especially those relating to air pollution and climate change, have long been governed by federal law and resolved by federal courts.   In 2011, the Supreme Court reaffirmed it “would be inappropriate” to apply state law to claims arising from transboundary greenhouse-gas emissions and climate change.

This makes good sense. Greenhouse gas emissions inherently transcend state borders—the term, after all, is “global climate change” not “Boulder County climate change.”

The Supreme Court has recognized that allowing state courts to interfere with federal regulation of energy production and emissions would “undermine the important goals of efficiency and predictability” and “lead to chaotic confrontation between sovereign states.”

The Office of the Solicitor General has embraced this position for decades, and solicitors general appointed by presidents from both parties have defended it—including left-wing Democrats who used climate change as part of their political platform.

So, in 2022, when the Supreme Court asked the Office of the Solicitor General if lawsuits seeking damages for climate change implicate state or federal issues, and whether they should proceed in state or federal court, the answer should have been simple. But the solicitor general instead said these cases should proceed in state court.

This flip-flop lacks credible explanation.

Here, the solicitor general seems to be acting for special interests and attempting to fix President Joe Biden‘s failure to achieve the climate change outcomes he promised.

Perhaps, instead of “learned in law,” the current solicitor general is
“learned in politics.” My office refuses to stand idly by without a fight.

Footnote:  SCOTUS is expected to hear arguments on this issue later this month.


Net Zero Not Rational

Jonathan Lesser explains in his Real Clear Energy article Why “Net Zero” Is Not a Rational U.S. Energy Policy.  Excerpts in italics with my bolds and added images.

Cost of achieving net-zero carbon emissions would be staggering for neglible climate impact.

Despite Germany’s last-ditch attempt at realism, the European Union recently approved a 2035 ban on gas-powered cars, moving ahead with its “net zero” emissions agenda. In the U.S., the cost of achieving net-zero carbon emissions would be staggering – $50 trillion if the goal is reached by 2050 – as would the demand for raw materials, which in most cases would exceed current annual worldwide production. 

Global critical metal demand for wind and PV

The impact on world climate, however, would be negligible. Emissions in developing countries will continue to increase as those countries’ focus is economic growth for their citizens, not permanent economic misery to “save” the climate. Although a recent Washington Post article suggests that wealth be viewed in terms of “joy, beauty, friendship, community, [and] closeness to flourishing nature,” impoverished individuals who cook with animal dung – such as 80% of the population in the African nation of Burkina-Fasso – aren’t likely to find much joy and beauty in economic misery. Granted, having to cook with animal dung ensures “closeness to nature,” although probably not the one the article’s author envisions.

Rather than approaching energy policy clearly, the U.S. (and most of the western world) is pursuing so-called “net zero” energy policies aiming to fully electrify western economies, while relying almost entirely on wind and solar power. The additional required electricity – after all, the wind doesn’t always blow, and the sun sets nightly – would supposedly be supplied by energy storage batteries or hydrogen-powered generators.

Two factors drive these policies. 

First, there is climate hysteria, which promotes claims that have either proven to be false (the “end of snow” in Great Britain, the disappearance of glaciers in Glacier National Park) or posit extreme scenarios (complete agricultural collapse, massive sea level increases, more frequent hurricanes). The actual evidence is to the contrary, including increased agricultural yields, minimal sea level rise, and no increases in observed hurricane frequency. 

Second, these policies are driven by old-fashioned greed. Green energy subsidies, which were already large, have been hugely expanded under the Biden Administration’s Inflation Reduction Act (IRA). The IRA is a virtual smorgasbord of green energy subsidies for offshore wind, solar power, electric vehicles, and charging infrastructure. The green energy pork, which relies on climate alarmism for its justification, is increasing electricity costs and reducing standards of living, such as in Europe, where deindustrialization is taking place because of unaffordable energy costs. Even progressive California admits its zero-emissions goals primarily will benefit the wealthy at the expense of the poor.

Although the author of the Washington Post article may think differently, modern society requires ample supplies of reliable and affordable energy. A modern society that runs solely on electricity must have a foundation built upon three key pillars.  First, it must provide lots of electricity, far more than is generated today, because U.S. electricity consumption accounts for only about one-fifth of total energy consumption. Second, all of that electricity must be available 24-7. Third, it must be affordable. Those pillars cannot be supported by reliance on intermittent wind and solar power and huge banks of batteries to store electricity when the wind doesn’t blow and the sun doesn’t shine. Nor will those pillars be based on technologies that don’t even exist, such as generators that run on pure hydrogen. 

Even if one believes that addressing climate change is crucial and
that low- or zero-emissions technology will yield worldwide benefits,
the current approach is the most expensive way to achieve it. 

Despite the hyperventilation of some politicians, such as Senator Sheldon Whitehouse’s predictions of doom, climate change need not entail economic suicide. A far better approach is adaptation to and mitigation of potential future damages that may be caused by a changing climate, such as gradual sea level rise and slightly warmer temperatures.

It is doubtful the U.S. will adopt this approach in the near future, because political expediency nearly always beats rational economics. But as economist Herb Stein said long ago, something that cannot go on forever, won’t. The unrealistic energy policies in place today eventually will collapse under their own weight. The resulting costs to U.S. consumers and businesses will be staggering. 

See also Series of Four Posts– World of Hurt from Climate Policies

Part 1, Zero Carbon Means Killing Real Jobs with Promises of Green Jobs

Part 2, Reducing Carbon Emissions Means High Cost Energy Imports and Social Degradation

Part 3, 100% Renewable Energy Means Sourcing Rare Metals Off-Planet

Part 4, Leave it in the Ground Means Perpetual Poverty


European Energy Suffering, Now Hydro and Nuclear

Irina Slav explains at Oil Price Europe’s Energy Troubles Continue: Hydro And Nuclear Output Declining.  Excerpts in italics with my bolds.

♦  Europe’s hydro and nuclear output is declining, leading to more energy troubles.
♦  Renewables are struggling to fill the gap as wind and solar output increase.
♦  The EU may require increased LNG imports from the US to meet energy demands.

Last year, Europe was on the brink of an energy breakdown as Russian gas flows dried up and most of Europe doubled down on renewable energy.

The renewable energy bet paid off, in a way. Solar and wind electricity generation in Europe hit a record in 2022. In fact, for the first time in history, wind and solar together produced more electricity than natural gas-fired power plants.

There was just one problem with that. Lower hydro and nuclear output
more than wiped out the significance of that record output.

Droughts were severe in Europe last year. They threatened major trade routes such as the Rhein in Germany and the Po in Italy. And they also caused severe declines in hydropower electricity output. For example, in Spain, hydropower output dropped by almost half because of the droughts. All this might repeat this year as well.

Meanwhile, nuclear wasn’t doing so swell, either. France suddenly found that years of underinvestment in maintenance would have consequences: emergency reactor shutdowns for repairs and maintenance.

The problems cost EDF a massive annual loss of $19 billion as half of its reactors had to be shut down for maintenance. Most blamed the pandemic, but nuclear experts such as Mark Nelson saw the roots of the problem much further into the past when France decided to bet on renewables over nuclear.

That might have been the case in 2022, but this year things are different. Wind and solar are still producing electricity at a record rate, it appears, but declines in hydropower and nuclear output are so severe they are more than offsetting those record output rates, Reuters’ Gavin Maguire reported in a recent column.

Maguire noted that Europe managed to boost its wind and solar power capacity by 9 percent last year to 57.29 GW, which was a record high. At the same time, however, the troubles of hydro and nuclear dragged total electricity generation down and are still doing it.

Over the first quarter, European power generation stood at 1,213 terrawatt-hours, which was 6.4 percent lower than output for the first quarter of 2023. That’s according to climate change advocacy Ember. According to Maguire, this is not necessarily alarming in itself. This time last year, Europe was coming out of pandemic lockdowns, and demand was soaring.

Where things could become problematic is later in the year as business activity across the continent begins to rebound after the energy crunch of last year, the Reuters columnist noted. And most of the Russian gas that was available last year is no longer an option.

French nuclear is a major source of hope, but it will be a while yet before output recovers. At the moment, French nuclear power plants are producing 17.5 percent less than the average output rate for 2020 and 2021. That’s down from 23 percent for last year, so there is some progress, and that’s a good sign.

Hydro is trickier because, although to a lesser extent than wind and solar, hydro is weather-dependent. With Europe’s mild winter that saw a lot less snow than usual, a repeat of last year’s drought is not out of the question. In fact, it is a distinct possibility.

What this means is that Europe may need to import a lot more LNG from its new top supplier, the United States. Some have worried that the EU is building too much LNG import infrastructure that would become stranded assets before too long, but right now, those assets appear to be vital for the bloc’s energy survival.

Mid April Arctic Ice Recovery


The animation compares Arctic ice extents for day 105 for some years between 2007 and 2023.  2011 was close to the 17-year average, while 2007 was one of the lowest in the record.  The images show extensive variation in the Pacific (left) basins of Bering and Okhotsk, where typically the most open water appears. There are also fluctuations on the Atlantic side, Barents (top right) as well as Greenland Sea and Baffin Bay.  Overall there was recovery from 2007 to 2011, then some years of lesser extents before 2023 returns to the 17 year average, as shown in the table later below.

Over the last 30 days, there were gains and then losses, mostly in the Pacific basins.  The effect on NH total ice extents is presented in the graph below.  

The average ice loss is 787k km2 for this period.  While 2023 started 235k km2 in deficit, yesterday it nearly matched the 17-year average. SII showed even lower ice extents in mid March, before matching MASIE at the end.

The table below shows the distribution of sea ice across the Arctic regions.

Region 2023105 Day 105 Average 2023-Ave. 2007105 2023-2007
 (0) Northern_Hemisphere 14088856 14121549  -32693  13588722 500134 
 (1) Beaufort_Sea 1070966 1069753  1214  1068692 2274 
 (2) Chukchi_Sea 966006 964603  1403  961638 4369 
 (3) East_Siberian_Sea 1087137 1085478  1659  1078666 8471 
 (4) Laptev_Sea 897845 893275  4570  843501 54344 
 (5) Kara_Sea 933845 922316  11529  890594 43251 
 (6) Barents_Sea 609466 608807  659  439904 169562 
 (7) Greenland_Sea 716828 649460  67368  673585 43243 
 (8) Baffin_Bay_Gulf_of_St._Lawrence 1212523 1283822  -71300  1215526 -3003 
 (9) Canadian_Archipelago 854843 852840  2002  848812 6031 
 (10) Hudson_Bay 1260903 1246319  14585  1208588 52315 
 (11) Central_Arctic 3247017 3232496  14521  3235648 11369 
 (12) Bering_Sea 642984 647468  -4484  600281 42703 
 (13) Baltic_Sea 35258 45036  -9779  23534 11723 
(14) Sea_of_Okhotsk 550081 614303  -64222  491121 58960 

Overall NH extent March 31 was below average by 33k km2, or 0.2%.  The two largest deficits are Sea of Okhotsk and Baffin Bay, partly offset by a surplus in Greenland Sea.  The onset of spring melt is as usual in most regions, with slight surpluses nearly everywhere.


Notes on Florida Torrential Rainfall and Ft. Lauderdale

Concerning reports that 25 inches of rain fell in one day on Fort Lauderdale, some historical context is provided by the Florida Climate Center article Anticipating Heavy Rain in Florida.  Excerpts in italics with my bolds.

Abstract

Florida is situated within a part of the United States where torrential rain is a common occurrence. Torrential rain is here defined as at least 3 inches in a single day. Rain of at least this magnitude is far more frequent along Florida’s coasts than in its interior. The Panhandle and the Gold Coast experience such weather events more than elsewhere in the state. Except for North Florida, rainstorms are heavily concentrated in the warm months. Mid- latitude low pressure systems, that pass over or near North Florida in the winter, often produce heavy rain. As a consequence that part of the state has no seasonal concentration.

The distribution of torrential rain throughout the state is much more uneven during years when they are most frequent than when few such storms occur. During the 51 years of daily observations for 48 weather stations no cyclical pattern of torrential rain was discerned. However, when data were organized by Enso phase it was shown that during the La Niña phase torrential rainfall, especially of 5 inches or more in a day, was more frequent than during the phase named El Niño. This was most true of South Florida stations.

Florida lies within a broad region along the Gulf and Atlantic coastal plains of the southeastern U.S. that experiences frequent episodes of torrential rain (Map 1). Torrential rain in Florida is here defined as three inches or more in one calendar day. Rain of this magnitude contributes approximately ten percent of the total precipitation that falls on the state, more in some parts of it, less in others. Along the coasts of both northwestern and southeastern Florida torrential rain makes the heaviest contribution, while in the interior of the peninsula it contributes the least. For several decades a Florida weather station held the nations record for the most rain to fall in a 24-hour period. Yankeetown, a small fishing port on the northwestern side of the peninsula, during September 5th, 1950 was swamped by 38.7 inches of rain. The village retained the national record until July 25th-26th, 1979 when 43 inches fell on Alvin, Texas, situated between Houston and Galveston. This record still stands.

Torrential rain, since it is usually accompanied by intense atmospheric turbulence, has the potential of causing much property damage, as well as the destruction of agricultural crops and livestock. Florida is especially vulnerable to flooding because it is both low and flat. Although the sandy soils of the Peninsula are capable of absorbing water rapidly, their ability to absorb large amounts is limited because the water table is normally very close to the surface. Most of the state’s densely populated areas are situated on the shore of either the Atlantic Ocean or the Gulf of Mexico, and are especially vulnerable to rainstorms. Not only are such storms more frequent than in the interior of the state, but a large share of the urban area is covered by pavement and roofs, which concentrate runoff into low areas. Most of Florida’s cities today have adequate storm drainage systems to meet the demands of a sudden intense downpour, but flooding, sometimes on a major scale, does occur.

The reader should be aware that the amount of daily precipitation, especially from the cooperative weather stations, which constitute the majority, is not necessarily that which fell between one midnight and another. Cooperative weather stations usually depend heavily on non-professional volunteers who read the gauges when it is convenient, hopefully each day at a time agreed upon. Few are read at or near midnight. Only a small number of Florida stations record hourly precipitation. Consequently, a rainstorm may begin during one calendar day and end in another. The total rainfall of the storm would then be shared by two days, and although it may be higher than three inches, if no calendar day had a total of three inches it would not be counted.

It should be noted that the monthly frequencies of torrential rain, if graphed, do not conform to a bell shaped curve, increasing to a peak in the hottest month of the year. Instead, the curve is bi-modal, there being two peaks, one in June and the other in September. It is presumed that the June peak is the result of the state then coming strongly under the influence of the intertropical convergence zone, and the September peak is due to the greater frequency in that month of tropical low pressure systems such as tropical storms reaching the state.

Note Fort Lauderdale is in a torrential rain hotspot just north of Miami.

South Florida gets a significant part of its torrential rain during Springtime.

The ENSO (El Niño Southern Oscillation) phenomenon, which has been given much justified attention in recent years, is now generally regarded as being able to influence climate over a huge area of the world. It would be irresponsible to ignore the possibility that it could influence the frequency of Florida rainstorms. To ascertain if there is a relationship the three phases of Enso (El Niño, La Niña, and the neutral phase) the frequency of rainstorms were calculated by ENSO phase (Table 4). There does appear to be a relationship, and it doesn’t seem to be spurious. The share of the 48 Florida weather stations that reported no torrential rainstorms during a year is somewhat higher during the El Niño phase than the other two. The share of stations that reported only one storm during the years of the El Niño phase also was higher than the share of those that were reported in the La Niña phase. Thereafter, except for the shares of the ‘four storm’ category, the La Niña phase produced more torrential storms than the El Niño phase. In South Florida, It has become generally accepted that in La Niña years precipitation is generally wetter than during the El Niño phase. From the data we might conclude that weather controls that become important during this phase also promote a higher frequency of torrential rain. The neutral phase of Enso has little to no effect upon the frequency of Florida’s rainstorms, some neutral years producing many more episodes of torrential rain than others.

In conclusion it would be derelict not to address the issue of the relationship between the frequency of torrential rain in Florida and global warming. In studies of the consequence of global warming on climate the possibility of greater climatic extremes has been predicted, including storms that could produce large amounts of precipitation. This is usually based on the assumption among other factors, that the temperature of the water of the oceans would rise, heating the air above them, increasing evaporation and the air’s ability to hold water vapor and consequently its ability to produce more powerful rainstorms.

Table 5: Number of times 48 Florida weather stations
experienced at least 3″ of rainfall for
five decades between 1950 and 1999.

To ascertain if Florida has been experiencing an increase in the number of storms that produce torrential rain the torrential storm data for the 48 stations within the state which became the primary data source for this study were divided into the five decades between 1950 and 1999 (Table 5). When the average for the 50-year period is compared to the frequency by decade no trend is discovered. When the frequency in earlier decades is compared with the later ones there also appears to be no trend. For example, between 1950 and 1969, during that 20-year period there were 684 episodes at the 48 Florida weather stations in which 3 inches or more rain fell in one day, while in the 20-year period between 1980 and 1999 there were 695 episodes, a difference of only eleven episodes. The frequency of episodes during the year was also examined. An examination reveals, for example, that there were 23 stations between 1950 and 1969 that reported five episodes during the 20-year period, and between 1980 and 1999 the number fell to 20. Such a small drop does not suggest an increase in torrential rain over time.


Energy Doublethink Update April 14, 2023

First from the Zero Carbon zealots at Resilience Record clean-power growth in 2023 to spark ‘new era’ of fossil fuel decline.  Excerpts in italics with my bolds and added images.

The power sector is about to enter a “new era of falling fossil generation” as coal, oil and gas are pushed out of the grid by a record expansion of wind and solar power, according to new analysis by climate thinktank Ember.

Wind and solar power reached a record 12% of global electricity generation last year, according to Ember’s global electricity review 2023. This drove up the overall share of low-carbon electricity to almost 40% of total generation.

With even faster growth set to continue this year, Ember says 2022 is likely to mark a “turning point” when global fossil fuel electricity generation peaked and began to fall.

The thinktank forecasts that, by the end of 2023, more than 100% of the growth in electricity demand will be covered by low-carbon sources.

Experts broadly agree that global electricity generation needs to be completely decarbonised by 2040 if the world is to stay on track for its climate targets.

OTOH we have:

This month a 2023 US Energy Outlook from EIA (Energy Information Agency).  Excerpts in italics with my bolds.

Our projected growth in associated natural gas production is mainly driven by three trends:

♦  Rising oil prices support increased production from unconventional oil formations with significant natural gas volumes.
♦  Many unconventional oil wells are aging, and as these wells age, they tend to produce a higher ratio of natural gas relative to oil.
♦  Associated natural gas resources are becoming more economical, driven in part by provisions in the IRA, which creates penalties for venting and flaring methane and encourages producers to capture more natural gas from oil formations.

We project that associated natural gas production will increase from 7.2 Tcf in 2025 to 8.8 Tcf in the United States by 2050 in the AEO2023 Reference case. In the AEO2023 High Oil Price case, associated natural gas production peaks at 13.6 Tcf in 2035, accounting for 30% of the total domestic natural gas supply. By contrast, in the AEO2023 Low Oil Price case, associated natural gas production falls to 4.2 Tcf by 2050.

Strong continuing international demand for petroleum and other liquids will sustain U.S. production above 2022 levels through 2050, according to most of the cases we examined in our Annual Energy Outlook 2023 (AEO2023). We project that the United States will continue to be an integral part of global oil markets and a significant source of supply in these cases, as increased exports of finished products support U.S. production.

In our AEO2023, we explore long-term energy trends in the United States and present an outlook for energy markets through 2050. We use different scenarios, or cases, to understand how varying assumptions about the future could affect energy trends. These cases include:

  • The Reference case, which serves as a baseline, or benchmark, case. It reflects laws and regulations adopted through mid-November 2022 but assumes no new laws or regulations in the future. It also assumes the Brent crude oil price reaches $101 per barrel (b) (in 2022 dollars) by 2050.
  • The High Oil and Gas Supply case, which assumes 50% more ultimate recovery per well for tight oil, tight gas, or shale gas in the United States compared with the Reference case. It also assumes 50% more undiscovered U.S. oil and natural gas resources and 50% more effective technological improvements than in the Reference case.
  • The Low Oil and Gas Supply case, which assumes 50% less ultimate recovery per well and undiscovered sources, and 50% more effective technological advancement than the Reference case.
  • The High Oil Price case, which assumes the price of Brent crude oil reaches $190/b (in 2022 dollars) by 2050.
  • The Low Oil Price case, which assumes the price of Brent crude oil reaches $51/b (in 2022 dollars) by 2050.

Although domestic consumption of petroleum and other liquids does not increase through 2040 across most cases, production of U.S. petroleum and other liquids remains high because of more exports of finished products. In the High Oil Price case, increased production leads to the most U.S. exports among all cases over the projection period at 9.13 million barrels per day (b/d) by 2050, more than double the 3.9 million b/d exported in 2022. The Low Oil Price case shows the opposite trend with the least 2050 export volumes of 407,000 b/d, nearly 90% less than 2022 exports.

Electric Power Outlook

The figure above illustrates the relationship between installed capacity (left panel) and electricity generation (right panel). Because wind, solar, and nuclear have the lowest operating costs, their electricity generation over time mirrors their trend in installed capacity: slightly declining for nuclear, and increasing for wind and solar. By contrast, natural gas and coal have higher operating costs, and so their generation can vary over time depending on demand levels and the relative operating cost of other technologies.

In our March Short-Term Energy Outlook, we forecast the wind share of the U.S. generation mix will increase from 11% last year to 12% this year. We forecast that the solar share will grow to 5% in 2023, up from 4% last year. The natural gas share of generation is forecast to remain unchanged from last year (39%); the coal share of generation is forecast to decline from 20% last year to 17% in 2023.

The electric power sector includes electric utilities and independent power producers. It does not include generators in the industrial, commercial, or residential sectors, such as rooftop solar panels installed on homes or businesses or some combined-heat-and-power systems.

Comment:

The statement above concerning capacity and operating costs is simplistic, and could be misleading.  EIA actually has a more realistic method of comparing power sources.  Example below:

EIA has developed a dual assessment of power plants using both Levelized Cost and Levelized Avoided Costs of Electricity power provision. The first metric estimates output costs from building and operating power plants, and the second estimates the value of the electricity to the grid.

More detailed discussion here:

Cutting Through the Fog of Renewable Power Costs


Confirmed: Climate Models Too Hot to Trust

Ross McKitrick reports on a new study confirming the chart above.  His Financial Post article is The important climate study you won’t hear about.  Excerpts in italics with my bolds and added images

The study is Mid-Tropospheric Layer Temperature Record Derived From Satellite Microwave Sounder Observations With Backward Merging Approach by Cheng-Zhi Zou at JGR Atmospheres.

The Significance

Ross McKitrick: 

In the end the two (satellite) series were similar but RSS has consistently exhibited more warming than UAH. Then a little more than a decade ago, the group at NOAA headed by Zou produced a new data product called STAR (Satellite Applications and Research). They used the same underlying microwave retrievals but produced a temperature record showing much more warming than either UAH or RSS, as well as all the weather balloon records. It came close to validating the climate models, although in my paper with Christy we included the STAR data in the satellite average and the models still ran too hot. Nonetheless it was possible to point to the coolest of the models and compare them to the STAR data and find a match, which was a lifeline for those arguing that climate models are within the uncertainty range of the data.

Until now. In their new paper Zou and his co-authors rebuilt the STAR series based on a new empirical method for removing time-of-day observation drift and a more stable method of merging satellite records. Now STAR agrees with the UAH series very closely — in fact it has a slightly smaller warming trend. The old STAR series had a mid-troposphere warming trend of 0.16 degrees Celsius per decade, but it’s now 0.09 degrees per decade, compared to 0.1 in UAH and 0.14 in RSS. For the troposphere as a whole they estimate a warming trend of 0.14 C/decade.

Figure 14 Global mean Temperature Total Troposphere (TTT, TMT adjusted by TLS) time series (blue lines) and its smoothed time series (red lines). The locally weighted regression method (Cleveland, 1979) is used for the smoothing. Both TMT and TLS for TTT generation are from STAR V5.0.


Waste Not, Want Not, Still True About Food

Jack Hubbard reports at Real Clear Markets Eat What You Want While Questioning ‘Food Sustainability’ Claims.  Excerpts in italics with my bolds and added images.

Earth Day started 50 years ago, and if you judge the event by society’s environmental conscientiousness, it’s been a success. Today, people are increasingly considering the environmental impact of products they buy. That’s true not just of cars and clothing, but also what we eat.

A survey last year found that 37% of consumers look for sustainability claims on food. Food marketers have taken note, increasing the number of food products with eco claims.

But buyers should beware: Not all food sustainability claims are true.

Where is the Beef?

Perhaps the single most common claim you’ll hear today about food is that meat is bad for the environment. Ads for plant-based fake meat commonly assert this. These claims are parroted by animal rights activists who–naturally–don’t like people eating meat. You can even find a few documentaries that try to paint meat as eco-unfriendly.

But is eating meat actually bad for the environment? No.

A frequently cited statistic is that 15% of global greenhouse gas emissions are from animal agriculture. But what you may not know is that this figure doesn’t apply to the US, where we have the most advanced modern agricultural technology in the world.

American agriculture has become economically and environmentally more efficient over time. For instance, we need 60% fewer cows yet produce twice as much milk as we did in the 1930s.

The EPA tracks greenhouse gas emissions and reports them by sector. According to the EPA, all of our agriculture only accounts for about 9% of total US greenhouse gas emissions, while animal agriculture accounts for only about 4%. That’s why researchers estimate that if the entire U.S. population went vegan tomorrow, it would only reduce greenhouse gas emissions by less than 3%. That also means, as an individual, giving up meat will have zero impact on curbing climate change.

Fake Meat Doesn’t Lower Emissions

It turns out that producing plant-based fake meats actually produces the same amount of emissions as producing chicken. And cell-cultured meat–that is, grown from cells in a lab setting–has five times the emissions of regular chicken.

Why? Because while making fake meat may use less land than raising chickens, it uses much more electricity to power all those factories that make fake meat.

 “Organic” Feels Good

“Organic” is another term that many consumers look for, thinking organic food is better for the environment and their health. Once again, reality is different from perception.

A recent study of organic vs. modern agriculture on different factors such as land use, climate, over-fertilization, and energy use. Modern farming was superior on land use while organic farming was better on chemicals. Overall, the two compared equally on most factors.

(Most consumers also believe that organic food is more nutritious. But once again, scientific research has found there’s no real difference.)

Food Waste Is Important

The biggest environmental impact associated with food isn’t about the food we eat. It is actually about food we don’t eat.

The USDA estimates that up to one-third of food produced in the country is thrown away. Whether that’s meat or fake meat, or organic produce or non-organic produce, that food took resources to grow and fuel to transport. And all of those resources go to waste when you don’t finish your meal or throw out the leftovers.

What’s the lesson?

Eat what you want and ignore the marketing claims. In the big picture,
anyone’s diet has a small footprint. But whatever you choose to eat,
make sure you don’t let it go to waste.

l

.

Don’t Buy Green Hydrogen Hype

Frank Lasee gives the game away in his Real Clear Energy article The Expensive Impossibility of Green Hydrogen From Part-Time Wind and Solar.  Excerpts in italics with my bolds and added images.

There has been some new thinking from the anti-CO2 religionists. The fact that the world is desperately short of lithium and cobalt for electric vehicle batteries, at the scale they want to force, is dawning on them. There isn’t enough and likely will not be enough in the coming decades to meet the electric batteries demand. Certainly not enough for grid scale electric batteries too.

The climate alarmists haven’t let the facts get in the way of their unrealistic green fantasy of averting climate doom with part-time wind and solar. That it could somehow replace all the coal, oil, and natural gas we use, which provide us with 80% of our energy.

Except one huge, huge problem. Wind and solar produce little or no energy 70% of the time.  Reliable, full-time, on demand electricity keeps the heat going and the lights on when it is dark, and the wind is not blowing.

The new expensive, impractical, and impossible federal $9.5 billion
hydrogen subsidies talking point is wasted spending.

Green hydrogen made from wind and solar is not practical and is a very expensive form of energy storage and transport.  Hydrogen is not a fuel. Hydrogen must be created; it must be made from another energy source, just as electricity must be made from other energy.

No one is making green hydrogen at scale because it is difficult, expensive and requires major factories. Spoiler alert, there isn’t excess “green” energy – wind and solar – to make hydrogen with.

Green hydrogen requires 13 times more water than hydrogen produced.

Sea water must be desalinated first for an added cost. More water is needed for cooling. So, it is a good idea to locate hydrogen facilities near abundant water, not in the chronically short of water western U.S.

Then the water must be heated to 2,000 degrees and electrocuted. Then the hydrogen must be super chilled to near absolute zero. Then it’s compressed to 10,000 psi, three times the psi of an average scuba tank.

Then you have usable hydrogen- liquid, super- cold, compressed hydrogen.
This is an expensive energy-intensive process.

The insurmountable problem with this process is that it cannot be turned on an hour after sunrise and an hour before sunset when solar panels provide the electricity. Or turned on when the wind blows and turned off when the wind stops.

Without some other energy storage device to store the “over-produced” wind and solar electricity, making green hydrogen is impossible. The costs of over-building wind and solar, then adding batteries to provide a steady stream of 24/7 electricity to make “green” hydrogen is astronomical. And in 25 years when the wind towers and solar panels wear out, or when the batteries need to be replaced every 10 years, you need to essentially start over.

Green hydrogen sounds good. And there is a well-funded industry
of selling it and obscuring the truth.

They have to cover up the facts and mislead people in order for the government and investor gravy train to keep them in business.

Canada and Germany Sign Agreement to Enhance German Energy Security with Clean Canadian Hydrogen August 2022

Don’t fall for the green or the pink hydrogen hype. It just doesn’t make sense. Apply a little common sense and critical thinking and you will join me in opposing this waste of money.

The hydrogen lobby duped congress to provide $9.5 billion for hydrogen hubs. Even red states who know this is a boondoggle are attempting to land this federal largesse.

Because it will create jobs with borrowed taxpayer money. I remind you that the US is $31 trillion in debt, with estimates it will balloon to over $50 trillion over the next decade.

These hydrogen jobs will last only as long as the subsidies do. Then like the Obama U.S. solar revolution, they will go bankrupt.

Frank Lasee is a former Wisconsin state senator and former member of Governor Scott Walker’s administration. The district he represented had two nuclear power plants, a biomass plant and numerous wind towers. He has experience with energy, the environment, and the climate. You can read more energy and climate information at http://www.truthinenergyandclimate.com which Frank leads.