
[Top] Comparison of the harmonic empirical global climate model under the SSP2-4.5 scenario with the HadCRUT4.6 record (1850–2021) alongside the burning ember diagrams representing the five primary global Reasons for Concern (RFCs) under low-to-no adaptation scenarios, as reported by the IPCC (2023) AR6. [Bottom] Summary and analysis of the projected impacts and risks of global warming for the 2080–2100 period compared to the climate “thermometer” projections from Climate Action Tracker (2024). Credit: Gondwana Research (2026). DOI: 10.1016/j.gr.2025.05.001
Current global climate models (GCMs) support with high confidence the view that rising greenhouse gases and other anthropogenic forcings account for nearly all observed global surface warming—slightly above 1 °C—since the pre-industrial period (1850–1900). This is the conclusion presented in the IPCC’s Sixth Assessment Report (AR6) published in 2021.
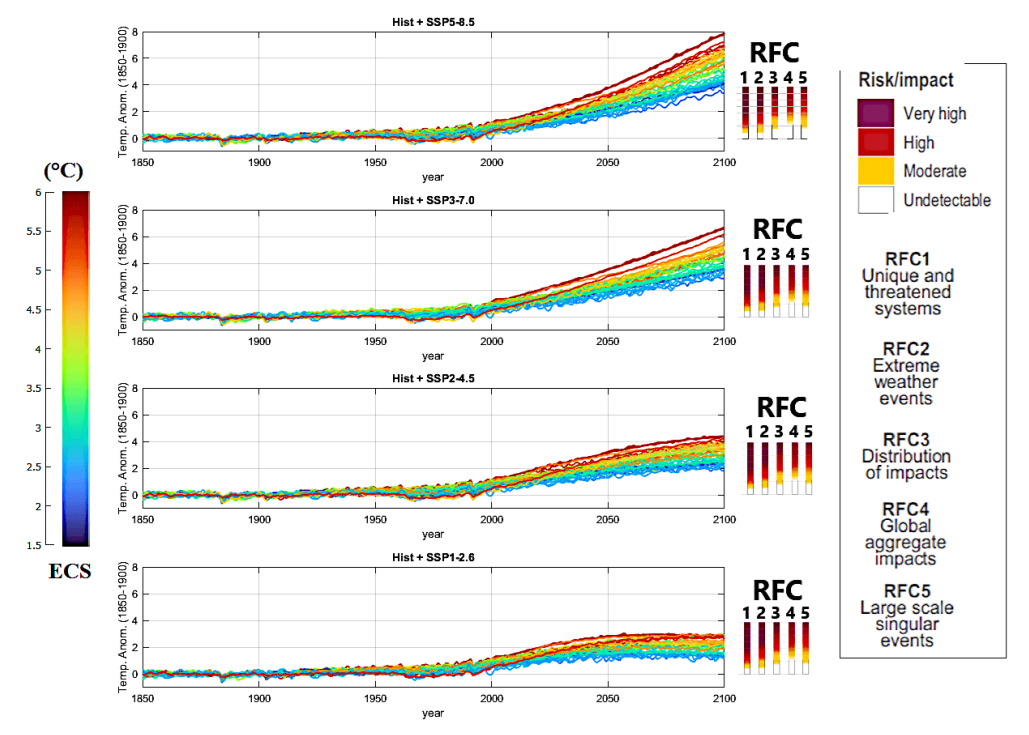
Figure 3: CMIP6 GCM ensemble mean simulations spanning from 1850 to 2100, employing historical effective radiative forcing functions from 1850 to 2014 (see Figure 1C) and the forcing functions based on the SSP scenarios 1-2.6, 2-4.5, 3-7.0, and 5-8.5. Curve colors are scaled according to the equilibrium climate sensitivity (ECS) of the models. The right panels depict the risks and impacts of climate change in relation to various global Reasons for Concern (RFCs) (IPCC, 2023). (Adapted from Scafetta, 2024).
Moreover, the GCM projections for the 21st century, produced under different socioeconomic pathways (SSPs), underpin estimates of future climate impacts and guide net-zero mitigation strategies worldwide.
The prevailing interpretation is that only net-zero climate policies can keep future climate change-related damages within acceptable limits. Yet such policies carry extremely high economic and societal costs, making it essential to assess whether these certain and immediate costs are fully justified by the current state of climate science.
On the other hand, a closer examination of observational datasets, paleoclimate evidence, and model performance reveals a more intricate picture—one that merits open discussion among students, researchers, and anyone interested in how climate science is evolving.
My study “Detection, attribution, and modeling of climate change: Key open issues,” published in Gondwana Research, examines several unresolved questions in climate detection, attribution, and modeling. These issues concern the foundations of how past climate changes are interpreted and how future ones are projected, and they matter because climate projections influence decisions that will shape economies and societies for decades. [My synopsis: Scafetta: Climate Models Have Issues. ]
A central theme is natural climate variability. Across the Holocene—the last 11,700 years—the climate system exhibited a Climate Optimum (6,000–8,000 years ago) and repeated oscillations: multidecadal cycles, centennial fluctuations, and millennial-scale reorganizations.

Some longer cycles are well known, such as the quasi-millennial Eddy cycle, associated with the Medieval and Roman warm periods, and the 2,000–2,500-year Hallstatt–Bray cycle. These patterns appear in ice cores, marine sediments, tree rings, historical documents, and in both climate and solar proxy records.

Current GCMs, however, struggle to reproduce the Holocene Optimum and these rhythms. They generate internal variability, but not with the correct timing, amplitude, or persistence. When a model cannot capture the natural “heartbeat” of the climate system, distinguishing human-driven warming from background variability becomes challenging. This is particularly relevant for interpreting the warming observed since 1850–1900, because both the Eddy and Hallstatt–Bray cycles have been in rising phases since roughly the 1600s.

Figure 1. Anthropgenic and natural contributions. (a) Locked scaling factors, weak Pre Industrial Climate Anomalies (PCA). (b) Free scaling, strong PCA Source: Larminat, P. de (2023)
A portion of the post-industrial warming could therefore stem from these long natural oscillations, which are expected to peak in the 21st century and in the second half of the third millennium, respectively.
Another key issue concerns the global surface temperature datasets that serve as the backbone of global warming assessment. These datasets are essential but not perfect.

Urbanization, land-use changes, station relocations, and instrumentation shifts can introduce non-climatic biases. Many corrections exist, yet uncertainties persist. Even small unresolved biases can influence long-term trends.
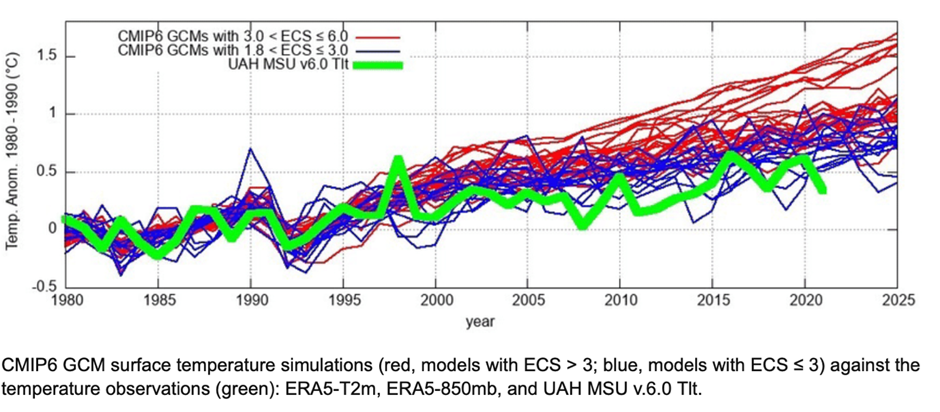
The study highlights well-known discrepancies: satellite-based estimates of lower-troposphere temperatures since 1980 show about 20–30% less warming than surface-based records, particularly over Northern Hemisphere land areas.
Recent reconstructions based on confirmed rural stations also show significantly weaker secular warming. These differences underscore the need for continued scrutiny of observational records.
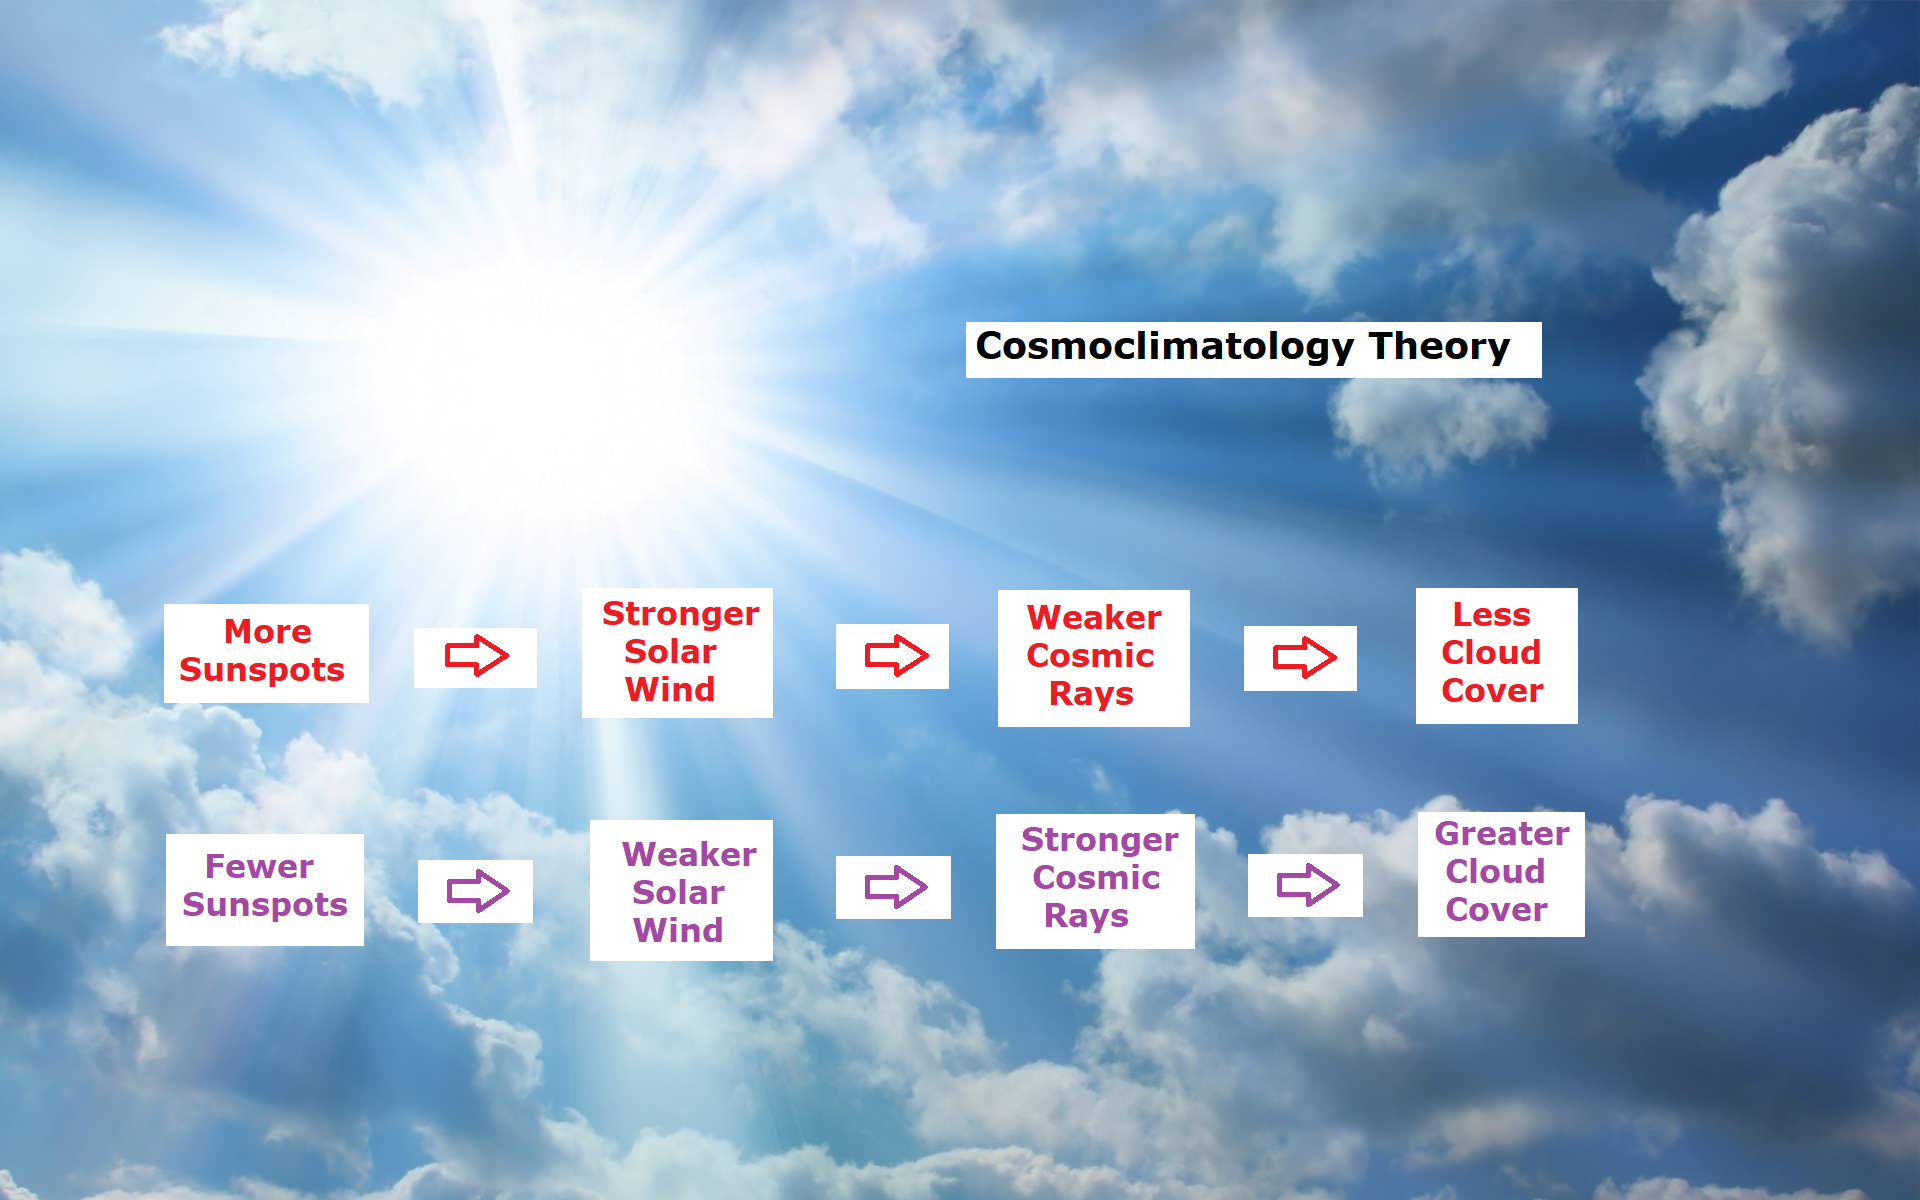
Solar and astronomical influences represent another area where science is still evolving. The sun varies in ways not fully captured by the simplified irradiance reconstructions used in many models. Multiple lines of evidence indicate that the climate system responds not only to total solar irradiance but also to spectral variations, magnetic modulation, and indirect effects on atmospheric circulation.
These mechanisms are still under investigation, and their representation in models remains incomplete, even though empirical evidence suggests that they may play a dominant role—potentially more influential than the simple total-solar-irradiance forcing currently implemented.
 Moreover, despite ongoing controversy surrounding long-term solar variability, current GCMs are typically forced with solar reconstructions that exhibit extremely low secular variability. This helps explain why these models attribute nearly 0 °C of the observed post 1850–1900 warming to solar changes and simultaneously fail to reproduce the millennial-scale oscillations evident in paleoclimate records.
Direct comparisons between GCM global surface temperature simulations and observations also show that the models do not reproduce the quasi-60-year climatic oscillation associated with the 1940s warming period, and they tend to overestimate the warming observed since 1980. This “hot model” problem has been documented in several studies and appears to affect a substantial fraction of current GCMs.
All of this connects to a key parameter in climate science: equilibrium climate sensitivity (ECS). The canonical estimate—around 3 °C for a doubling of CO₂, with a likely range of 2.5–4.0 °C according to the IPCC—derives largely from model-based assessments.
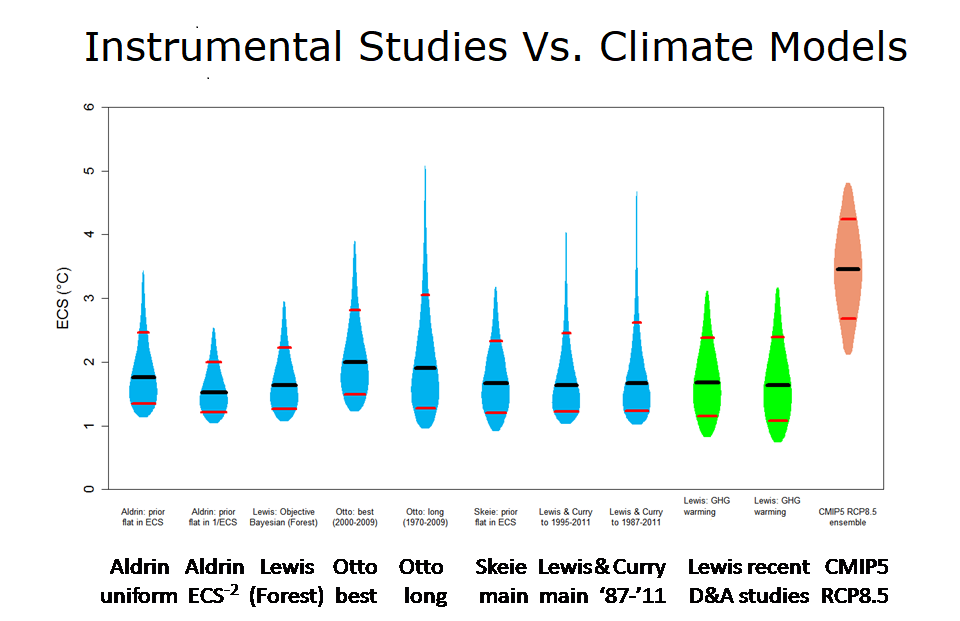
Empirical studies, including those that account more explicitly for natural variability, often suggest lower values, sometimes around 2.2 ± 0.5 °C, or even as low as 1.1 ± 0.4 °C if long-term solar luminosity varies significantly and if additional solar-related mechanisms influence the climate system—mechanisms not included in current models. If ECS is lower than commonly assumed, projected 21st-century warming would be substantially reduced under all SSP scenarios.

These graphs use Hadcrut4 and include the 2016 El Nino warming event. The exhibit shows since 1947 GMT warmed by 0.8 C, from 13.9 to 14.7, as estimated by Hadcrut4. This resulted from three natural warming events involving ocean cycles. The most recent rise 2013-16 lifted temperatures by 0.2C. Previously the 1997-98 El Nino produced a plateau increase of 0.4C. Before that, a rise from 1977-81 added 0.2C to start the warming since 1947.
The interplay between natural and anthropogenic factors is definitely more nuanced than often portrayed. When empirical models that include natural oscillations are used to project future temperatures, the result is typically moderate future warming rather than extreme trajectories. This raises important questions about the scientific basis for the most aggressive mitigation pathways.
The figure compares the warming expected from GCMs, as assessed by the IPCC, with the associated relative risks, alongside the expectations derived from the empirical modeling proposed in the paper. While net-zero pathways such as SSP1 are considered necessary to meet the Paris Agreement target of limiting global warming to below 2 °C by 2100, empirical considerations suggest that the same target could also be achieved under the far more moderate SSP2 scenario.
This distinction has major global economic implications, because the
prevailing climate-crisis narrative does not appear to be fully supported
by the evidence, and far less costly adaptation strategies could be
more appropriate than highly aggressive mitigation policies.
The study stresses the importance of addressing the key open questions of climate science. Climate policy should be informed by the full spectrum of scientific evidence, including uncertainties and alternative interpretations.


The low variation of the solar irradiance and planetary gravitational forces are oftenly quoted to mock Scafetta’s research. But the correlation between solar and planetary frequencies is also oftenly hold back by these same people.
There are two big questions raised by Scafetta’s and Lopes-Courtillot’s works : which link between solar activity and planetary positions, and which link between solar activity and Earth atmosphere-core.
Maybe the first answer resides in bifurcation theory. A proposition was made by Vasil. He says that solar superficial activity may not be decided near the tacholine but in surface magnetohydrodynamics.
And maybe the second answer is to be found in aeronomy, the science of high atmosphere. Vinos proposed a modulation of the stratosphere activity through solar-ozone interaction.
If this is true, this renders climate modelling difficult because bifurcative and hybrid systems are very sensitive, so they need a very accurate model and measurements, which we don’t have.
There is also a link between Earth and other planets, see for instance the Jupiter presence in sea level spectrum behind Moon and Sun.
LikeLike
Geoffray, Leszek Marks explains how warming and cooling alternated throughout the last 12,000 years and how our modern period is no different in his paper Contemporary global warming versus climate change in the Holocene.

“Cyclical climate change is characteristic of the Holocene, with successive warmings and coolings. A solar forcing mechanism has steered Holocene climate change, expressed by 9 cooling phases known as Bond events. There is reliable geological evidence that the temperatures of most warming phases in the Holocene were globally higher or similar to that of the current warming period, Arctic sea ice was less extensive and most mountain glaciers in the northern hemisphere either disappeared or were smaller.”
My synopsis of his paper is:
LikeLike
Thank you Mr Clutz !
I’ll read this.
LikeLike
The only AGW thesis that makes sense to me is the “ERA rises with higher CO2 ppms” idea, where ERA means effective radiation altitude. But the problem with this idea IMO is that the ERA rises with a warming troposphere from ANY CAUSE. Additionally, if the troposphere is warming (again, from any cause), you’ve got the additional fact that this results in more CO2 being released from carbon sinks.
I’m thus tangled up in the chicken and egg feature of the AGW thesis. The thesis is plausible but not compelling.
LikeLike
Thanks for commenting David. Try reading this:
LikeLike
Harold The Organic Chemist Says:
ATTN: Ron
RE: CO2 Does Not Cause Warming Of Air!
Please go to the website of the late John L. Day’s website: “Still Waiting For Greenhouse” available at http://www.john-daly.com. From the home page, page down to the end the end and click on “Station Temperature Data”. On the “World Map” click on “Australia”. There is display weather stations. Click on “Adelaide”.
There is shown a plot of the annual mean temperature from 1857 to 1999. In 1857 the concentration of CO2 in air was ca. 280 ppmv (0.55 g CO2/cu. m. of air) and by 1999 it had increased to ca. 368 ppmv (0.72 g of CO2/cu. m. of air), but there was no corresponding in air temperature at this port city, instead there was a cooling. In 1999 the mean annual temperature (Tave) was 16.7° C.
To obtain recent Adelaide temperature data I went to: https://www.extremeweatherwatch.com/cities/aldelaide/average-temperature-by-year. There was displayed the Tmax and Tmin temperature data from 1887 to 2025 in long table. For 2025 the computed Tave was 17.4° C. In 2025 the concentration of CO2 in air at the MLO was 427 ppmv (0.84 g CO2/cu. m. of air). The slight increase in Tave by 0.7°C is well within the natural variation of the annual mean temperatures. Please note how little CO2 there is in the air.
The above empirical data and calculations, and the work of John Daly falsifies the claims by the IPCC that CO2 cause warming and hence global warming, and is the control knob of climate change. The purpose of these claims is to ensure the preservation and generous funding of not only the IPCC but also to provide the UN the justification for the distribution, via the UNFCCC and the UN COP, of donor funds from the rich countries to the poor countries to help them cope with the alleged harmful effect of global warming, i.e., the redistribution of the wealth of the rich countries.
The recission of the Endangerment Finding of 2009 for CO2 by Administrator Lee Zeldin of the EPA will finally put an end to the greatest scientific fraud since the Piltdown Man.
LikeLike
Thanks Harold. I too am an organic chemist with a BS from Stanford. Several posts here demonstrate that rising temperatures drive rising CO2, not the other way around. Recently:
LikeLike