Adapting Works! Mitigating Fails.

adapt2

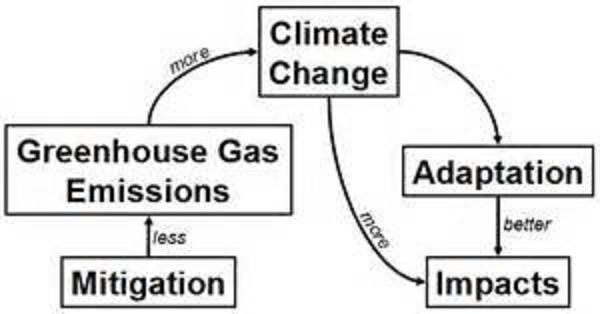
Two schools of thought regarding future climates:
Adaptation: As changes occur, adapt our methods and practices to survive and prosper in new conditions.
Mitigation: Cut down on use of fossil fuels to mitigate or prevent future global warming.

The Paris Agreement and various cap-and-trade schemes intend to Mitigate future warming. Lots of gloom and doom is projected (forecast) by activists claiming mitigation is the only way. But the facts of our experience say otherwise.

What has been human experience with Adapting to climate change?

Feeding ourselves is the most fundamental social need, so we should look at the history of Agriculture and climate change. Here is a data-rich study:
Adapting North American wheat production to climatic challenges, 1839–2009, by Alan L. Olmstead and Paul W. Rhodes Accessed at PNAS (here).

Numerous researchers have speculated about how farmers might change cultivars, cropping patterns, and farming methods to mitigate some of the costs of abrupt climatic changes (8). Researchers at the International Maize and Wheat Improvement Center (CIMMYT) anticipate that North American wheat farmers may extend the margin of wheat production roughly 1,000 km north into northern Canada and Alaska, whereas heat and drought will make cultivation untenable in many areas of the southern Great Plains (9). To provide perspective on these and other predictions, this paper asks how farmers responded to past climatic challenges.

The spread of wheat cultivation across North America required that farmers repeatedly adapt to unfamiliar and hostile climatic conditions. The variations in climatic conditions that settlers encountered rivaled the magnitude of the predicted changes at given locations over the next century. We quantify the extent of the geographic variations and decipher how wheat growers learned to produce in new environments. Because of the paucity of Mexican data before 1929, most of our analysis of “North America” refers to Canada and the United States. Inclusion of Mexico in the later part of the 20th century highlights the role of the Green Revolution in pushing production into hotter and drier zones. (my bolds)

Because of climate change, some areas presumably will decrease or cease wheat production, whereas other areas, particularly in northern Canada and Alaska, are expected to enter production. Although the anticipated movement in the wheat frontier is substantial, it is unlikely to be as great as the past geographic shifts in production. The difficulties in extending the transportation infrastructure to facilitate future shifts also appear less imposing than those overcome to open the Plains and Prairies. The challenging problems deal with adapting growing practices and creating improved cultivars. (my bold)

wheatline2

Shift in the North American spring–winter wheat frontier, 1869–1929.

The last two columns of the table, which show the differences between the Columbus baseline and the other four locations, illustrate the wide array of climatic conditions to which wheat has been adapted in North America during the past 170 y. Even with the predicted annual mean temperature by 2100, farmers near Edmonton, AB, and Dickerson, ND, will confront substantially colder conditions than eastern wheat growers faced circa 1839. Even with the anticipated increase in precipitation, the northern farmers will have to make do with about half the precipitation that the earlier generation of eastern farmers received. The predicted changes in Dodge City, KS, and Ciudad Obregón, Sonora, Mexico, suggest both hotter and drier conditions than were common at the center of North American production in 1839 (again, a climate akin to that in Columbus, OH, in the baseline period). Note, however, that the difference in temperature between Columbus and Ciudad Obregón was roughly six times the increase predicted in the latter city by 2100. Wheat production is sensitive to seasonal fluctuations in weather conditions, which probably will become more variable in the future and which are not captured by annual mean data (29). Nevertheless, the historical record of adapting wheat cultivation to areas with widely varying climates is impressive. (my bold)

For the most part, the settlement process required adapting cultivation to colder and more arid regions, not to hotter climates as predicted in the future. Farming with less water is more of a problem if the temperature also is hotter. However, biological innovations also were crucial to the expansion of production in hot-arid areas such as Texas, Oklahoma, central California, and northern Mexico. The currently predicted changes during the next century will, in a sense, reverse the predominant historical path of the past two centuries by creating a warmer and wetter environment in the Plains and Prairies that will partially approach the conditions that existed in the Middle Atlantic region when it constituted the North American wheat belt. (my bold)

The historical record offers insight into the capability of agriculture to adapt to climatic challenges. Using a new county-level dataset on wheat production and climate norms, we show that during the 19th and 20th centuries North American grain farmers pushed wheat production into environments once considered too arid, too variable, and too harsh to cultivate. As summary measures, the median annual precipitation norm of the 2007 distribution of North American wheat production was one-half that of the 1839 distribution, and the median annual temperature norm was 3.7 °C lower. This shift, which occurred mostly before 1929, required new biological technologies. The Green Revolution associated with the pioneering work of Norman Borlaug represented an important advance in this longer process of biological innovation. However, well before the Green Revolution, generations of North American farmers overcame significant climatic challenges. (my bold)

How successful has mitigation been?

A recent report of California’s cap-and-trade concluded:

The problem is that the permits are selling at a slower and slower rate. The surplus of allowances is becoming so large in systems run by Europe, California and Quebec — which together account for more than 90 percent of global trading — that by 2022 it could cover the emissions spewing from every car on Earth for a full year, according to estimates by the London environmental group Sandbag Climate Campaign CIC and Bloomberg New Energy Finance.

In California’s market, all 23 million allowances sold in an auction in 2014. In May 2016, 7.3 million permits found buyers, only 11 percent of what was put up for sale.

ReGGI, the carbon market joined by Northeastern US states is also ineffective but has the potential to threaten affordable electricity there. See my post: Cap and Trade Hype

Even more telling is the recent revolt by Democrat politicians against the way California distributes proceeds from auctions of carbon credits. From the LA Times: A big question complicating the climate debate: Where’s the money for poor people?

Unless more money gets directed to poor communities, lawmakers whose votes may be needed to continue the climate change efforts say they’re wary. Assemblyman Jim Cooper (D-Elk Grove), a leader in the business-aligned bloc of his party, said he hasn’t made up his mind, in part, because he’s outraged that people living in a handful of wealthy Bay Area and West Los Angeles communities have received by far the largest shares of state rebates to purchase electric cars.

“It’s welfare for the rich,” Cooper said. “It’s dead wrong in my book. It should be wrong in anybody’s book.”

Inadvertently, they are scraping the lipstick off the Mitigation Pig. They know (but don’t say out loud) this scheme does little to lower fossil fuels, and has even less impact on future climates. But it does create a pot of money, and they want the poor to have their share. If you are going to redistribute wealth, at least transfer it from the rich to the poor, as Robin Hood did. Mitigation is failing in every imaginable way.

Conclusion

Farmers have successfully grown and harvested crops in places formerly deemed too cold or too arid, and most of the new fields were in the North. Remarkably, today’s average climate where wheat is produced is both drier and colder:
“The median annual precipitation norm of the 2007 distribution of North American wheat production was one-half that of the 1839 distribution, and the median annual temperature norm was 3.7 °C lower.”

Agriculture has demonstrated our massive capacity to adapt to changing conditions, whether it becomes warmer or cooler, wetter or drier.

The rational climate change policy has been proven successful: Don’t Fight It, Adapt.

Footnote:

Bumper crops expected
Grain companies predict near-record western harvest
Source: The Western Producer

The 2016 harvest is shaping up to be a whopper, according to Western Canada’s largest elevator companies.

Arctic Cyclone Clears the Ice


Image from The Great Arctic Cyclone of 2016: After Four Years, a Summer Sequel at Jeff Masters blog.

The Arctic Cyclone operating near the north pole is starting to compress the ice extents, The graph below shows the results: Overall ice extent which had recently stabilized lost 672k km2 in just the last 4 days. 300k km2 was lost in BCE (Beaufort, Chukchi and East Siberian seas) and another 100k km2 in CAA (Canadian Arctic Archipelago).  SII had been running ~200k km2 below MASIE and they are now a match.

MASIE 2016 day233

That is good news for the Northabout, and also for Serenity, the cruiseship scheduled to use the Northwest Passage. Of course, it will be not so good if they are caught directly in the winds and ice movements.

20160821google2

Imagery date refers to Google Earth capture of land forms. Ice extent is 20160820 from MASIE. Click on image to zoom in.


The Big Picture of Arctic land, ocean, ice and clouds.

20160821google3

For more context on Arctic ice extent see Arctic Ice Watch July 31.  For those who wish to browse Arctic ice in Google Earth, the procedure is simple.  Go to MASIE homepage and download the kmz file.  Clicking on the file should open it in Google Earth (presuming it is on your computer.) Then you can browse, zoom in and out, and take images.


On the Hubris of Climatism


Canadian Michael Hart speaks out on climatism in his new book, Hubris: The Troubling Science, Economics, and Politics of Climate Change (link to interview with Hart at Tallbloke’s Talkshop)

The wide-ranging interview contains many insights, including this one that IMO gets at a deep, underlying motive:

Alarm over a changing climate leading to malign results is in many ways the product of the hunger for stability and direction in a post-Christian world. Humans have a deep, innate need for a transcendent authority. Having rejected the precepts of Christianity, people in the advanced economies of the West are turning to other forms of authority. Putting aside those who cynically exploit the issue for their own gain – from scientists and politicians to UN leaders and green businesses – most activists are deeply committed to a secular, statist, anti-human, earth-centric set of beliefs which drives their claims of a planet in imminent danger from human activity.

To them, a planet with fewer people is the ultimate goal, achievable only through centralized direction and control. As philosopher of science Jeffrey Foss points out, “Environmental science conceives and expresses humankind’s relationship to nature in a manner that is – as a matter of observable fact – religious.” It “prophesies an environmental apocalypse. It tells us that the reason we confront apocalypse is our own environmental sinfulness. Our sin is one of impurity. We have fouled a pure, ‘pristine’ nature with our dirty household and industrial wastes. The apocalypse will take the form of an environmental backlash, a payback for our sins. … environmental scientists tell people what they must do to be blameless before nature.”

Hart says that unfortunately society has gone a long way down the wrong road, but the outcome can be changed.

I remain cautiously optimistic. Popular support for climate change action peaked a few years ago. In Europe, which has gone furthest in implementing climate change policies, politicians are beginning to look for ways to moderate earlier initiatives. In North America, rhetoric has far outstripped actions while the Obama administration has relied on stealth to implement its climate change agenda. At the same time, climate change has added to the momentum of the broader secularization of society and the pursuit of anti-human policies and programs. We are, sadly, farther down that road than we have ever been before.

Again, it will take a determined effort by people of faith and conscience to convince our political leaders that they have been gulled by a political movement exploiting fear of climate change to push a utopian, humanist agenda that most people would find abhorrent. As it now stands, politicians are throwing money that they do not have at a problem that does not exist in order to finance solutions that make no difference. The time has come to call a halt to this nonsense and focus on real issues that pose real dangers. In a world beset by war, terrorism, and continuing third-world poverty, there are far more important things on which political leaders need to focus.

Read the first chapter here:

https://www.academia.edu/29923495/_Hubris_The_Troubling_Science_Economics_and_Politics_of_Climate_Change_by_Michael_Hart_Chapter_One_here_interview_by_Margaret_Wente_of_Globe_and_Mail_my_comment

From the Preface:

The world will be a better place

  • when governments agree to tame this monster and refocus their energies on issues within their competence;
  • when religious leaders and other elites accept that they have fallen prey to a movement whose motives are much darker and more damaging than they realize;
  • and when the media adopt a more balanced approach and provide the public with the critical assessment that is often missing from their reporting.

It is time for all three to accept that the UN is pursuing a path that can only result in a less prosperous and more divided world.

Northabout Nears E. Siberian Sea


20160818google2rev

Update August 19 2016

Today’s tracking shows Northabout is approaching the strait leaving Laptev and entering East Siberian Sea.  It appears to be open water all the way to Beaufort Sea.

20160818google5

Imagery date refers to Google Earth capture of land forms. Ice extent is for August 18, 2016 from MASIE. Click on image to zoom in.

Update August 15, 2016

It appears that Northabout, the Polar Ocean Challenge sailboat, is positioning for an end run around the Laptev wall.  The ship location is current, the ice edges are yesterday’s chart from MASIE. (Click on the image to zoom in)

20160814GoogleRev

Update 18:00 EST August 15, 2016

It looks like Northabout is sailing free in Laptev.

20160815googlelater


Update August 14, 2016

It appears that Northabout is sheltering in a cove, before seeking a way around the Laptev wall. Below the Google Earth image of ice edges from NIC shows how the strait has opened up along with navigable shore lines.

Aug13googleRev

Imagery date refers to Google Earth capture of land forms. Ice edges are provided by MASIE for August 13, 2016.

The Big Picture from August 11, 2016.

masie_August 11rev

The Polar Ocean Challenge involves the sailing ship Northabout circumnavigating the North Pole counterclockwise starting from Bristol UK. The chart above from MASIE shows the two choke points in the itinerary: The Laptev Wall of ice at the beginning and the Nunavut Gauntlet of ice at the end. The image shows If Northabout can get past Laptev, it is relatively clear sailing all the way to Beaufort where Nunavut awaits.

20160809en

The above chart from AARI shows how Northabout has passed through the strait from Kara into Laptev and is in a holding pattern up against the wall.  Caleb has some great photos (here) of the views from the deck, along with some comments respecting the explorers despite their being misled by global warming theorists.

20160809enBaffin

Above is the latest chart from AARI showing the present ice situation at the other end of the trip, the Nunavut Gauntlet.  The white part is without data since the Russians are focused on their side of the ocean, but it does show heavy ice in Beaufort Sea on the right,  Within Nunavut, Parry Channel is well blocked, but with some water around the edges.  If and when Northabout gets here, no one knows what they will face.  They are counting on the passage opening this year, unlike previous years.

An image of the ice and snow extents from NOAA by way of National Ice Center (NIC)

A closeup of Nunavut from that chart shows they have a chance by using the southern route, skipping all but the eastern end of Parry Channel, provided the ice is better not worse than now when they approach.

cursnow_alaskaNOAAnunavut

Footnote:

Another view of the Arctic is available from NIC using Google Earth.  The daily shapefile can be downloaded, and it then opens in Google Earth, which allows you to browse and zoom in on regions of interest.  Here is an image from this source:

20160812google

Note: Imagery date is Google Earth capture of land masses. Ice edges are 20160812 from NIC.


“Gotcha” Graph from GISS

Lots of buzz over Brian Cox using the latest GISS land and ocean graph to put down Malcolm Roberts in a TV debate in Australia. Likely we will be seeing the image everywhere and alarmists crowing about “deniers” dismissed once and for all. For the record here is the graph showing no pause whatsoever:

This is accomplished by lowering the 1998 El Nino spike relative to 2015 El Nino. To see what is going on, here is a helpful chart from Dr. Ole Humlum at Climate4you

It shows that indeed, GISS is showing 1998 peak lower than several years since, especially 2002, 2010 and 2016. In contrast, the satellite record is dominated by 1998, and may still be in that position once La Nina takes hold later this year. The differences arise because satellites measure air temperature in the lower troposphere, while GISS combines records from land stations with sea surface temperatures (SSTs) to fabricate a global average anomaly, including adjusting, gridding and infilling to make the estimate of Global Mean Temperatures and compare to a 30-year average.

An insight into the adjustments is displayed below.

As we have seen before, the past is cooled, and the present warmed to ensure evidence of global warming. Presently it is claimed that July 2016 is the hottest month ever. But stay tuned for future adjustments necessary to keep the warming going.

Dr. Humlum demonstrates that GISS is an unstable temperature record.

Dr. Humlum:

Based on the above it is not possible to conclude which of the above five databases represents the best estimate on global temperature variations. The answer to this question remains elusive. All five databases are the result of much painstaking work, and they all represent admirable attempts towards establishing an estimate of recent global temperature changes. At the same time it should however be noted, that a temperature record which keeps on changing the past hardly can qualify as being correct. With this in mind, it is interesting that none of the global temperature records shown above are characterised by high temporal stability. Presumably this illustrates how difficult it is to calculate a meaningful global average temperature. A re-read of Essex et al. 2006 might be worthwhile. In addition to this, surface air temperature remains a poor indicator of global climate heat changes, as air has relatively little mass associated with it. Ocean heat changes are the dominant factor for global heat changes. (my bold)

Too much trickery going on. I prefer to see actual temperatures, and this graph presents clearly the GISS record without the distortions:

giss-annual-temps4

Or, if you prefer Celsius degrees (range represents human sensory experience of daily and seasonal temperature variability)

giss-annual-tempsincrev

Conclusion 

Brian Cox defended the GISS graph by saying it was from NASA who put men on the moon.  He forgot to mention that several of those men and many scientists who put them there find NASA increasingly unscientific and untrustworthy on climate matters.

It could also be said about the recent GISS graph:  You show us a graph where the past history is different today than GISS reported it a year ago, and different again from 5 and 10 years ago.  Why should we believe this one any more than the other ones?  And why does GISS contradict temperatures recorded directly by NASA satellites?

He who controls the past controls the future. He who controls the present controls the past.
George Orwell 1984

Footnote

Same point as Orwell, but with a dash of humour:

A soviet university professor addresses his students: “There’s good news and bad news about this year’s History final exam.  The good news is all the questions are exactly the same as last year’s exam.  The bad news: Many of the answers have changed.”

Mediocre Arctic Ice August 15


20160815google3

Imagery date refers to Google Earth capture of land forms. Ice edges are dated August 15, 2016 from MASIE. Click on image to zoom in.

In the chart below MASIE shows 2016 August Arctic ice extent drew near to average and close to 2015, then dropped lower before leveling off a bit yesterday.  Presently mid-August is about 400k less than average and 2015.  With SII back on line, it was reporting similar extents during June (as it has in the past).  This month it is starting to underestimate again, ~200k km2 lower. (SII and MASIE comparison is here.)

MASIE 2016 day228


Looking into the details, some marginal seas are melting earlier than last year, while the central, enduring ice pack is relatively typical for this time of year.

At the present pace of declining ice extents, 2016 is running 3 days ahead of 2015 and 6 days in advance of the ten-year average.

Comparing the Arctic ice extents with their maximums shows the melting is occurring mostly in the marginal seas:   Down the most are Beaufort, E. Siberian and Kara seas, with Laptev higher.  Chukchi and Central Arctic are also slightly higher.

Region 2016228 Day 228 Average 2016-Ave.
 (0) Northern_Hemisphere 5638938 6077428 -438491
 (1) Beaufort_Sea 460422 732896 -272475
 (2) Chukchi_Sea 460556 451013 9543
 (3) East_Siberian_Sea 425918 614576 -188658
 (4) Laptev_Sea 436021 258060 177960
 (5) Kara_Sea 34418 113901 -79483
 (6) Barents_Sea 0 28263 -28263
 (7) Greenland_Sea 210175 250577 -40402
 (8) Baffin_Bay_Gulf_of_St._Lawrence 43329 50525 -7196
 (9) Canadian_Archipelago 394745 402828 -8083
 (10) Hudson_Bay 50896 72085 -21188
 (11) Central_Arctic 3121317 3101598 19719
 (12) Bering_Sea 0 23 -23
 (13) Baltic_Sea 0 2 -2
 (14) Sea_of_Okhotsk 0 29 -29

Presently Arctic Ice extent is down from its March maximum by 62.6%.  The bulk of ice losses are coming from Okhotsk, Barents and Bering Seas (100% melted), along with Kara Sea, Hudson Bay and Baffin Bay-St. Lawrence (96+% melted).  All of them are marginal seas that will go down close to zero by September.

For more context on Arctic ice extent see Arctic Ice Watch July 31.  For those who wish to browse Arctic ice in Google Earth, the procedure is simple.  Go to MASIE homepage and download the kmz file.  Clicking on the file should open it in Google Earth (presuming it is on your computer.) Then you can browse, zoom in and out, and take images.


Northabout On the Verge

Update August 15, 2016

It appears that Northabout, the Polar Ocean Challenge sailboat, is positioning for an end run around the Laptev wall.  The ship location is current, the ice edges are yesterday’s chart from MASIE. (Click on the image to zoom in)

20160814GoogleRev

Update 18:00 EST August 15, 2016

It looks like Northabout is sailing free in Laptev.

20160815googlelater


Update August 14, 2016

It appears that Northabout is sheltering in a cove, before seeking a way around the Laptev wall. Below the Google Earth image of ice edges from NIC shows how the strait has opened up along with navigable shore lines.

Aug13googleRev

Imagery date refers to Google Earth capture of land forms. Ice edges are provided by MASIE for August 13, 2016.

The Big Picture from August 11, 2016.

masie_August 11rev

The Polar Ocean Challenge involves the sailing ship Northabout circumnavigating the North Pole counterclockwise starting from Bristol UK. The chart above from MASIE shows the two choke points in the itinerary: The Laptev Wall of ice at the beginning and the Nunavut Gauntlet of ice at the end. The image shows If Northabout can get past Laptev, it is relatively clear sailing all the way to Beaufort where Nunavut awaits.

20160809en

The above chart from AARI shows how Northabout has passed through the strait from Kara into Laptev and is in a holding pattern up against the wall.  Caleb has some great photos (here) of the views from the deck, along with some comments respecting the explorers despite their being misled by global warming theorists.

20160809enBaffin

Above is the latest chart from AARI showing the present ice situation at the other end of the trip, the Nunavut Gauntlet.  The white part is without data since the Russians are focused on their side of the ocean, but it does show heavy ice in Beaufort Sea on the right,  Within Nunavut, Parry Channel is well blocked, but with some water around the edges.  If and when Northabout gets here, no one knows what they will face.  They are counting on the passage opening this year, unlike previous years.

An image of the ice and snow extents from NOAA by way of National Ice Center (NIC)

A closeup of Nunavut from that chart shows they have a chance by using the southern route, skipping all but the eastern end of Parry Channel, provided the ice is better not worse than now when they approach.

cursnow_alaskaNOAAnunavut

Footnote:

Another view of the Arctic is available from NIC using Google Earth.  The daily shapefile can be downloaded, and it then opens in Google Earth, which allows you to browse and zoom in on regions of interest.  Here is an image from this source:

20160812google

Note: Imagery date is Google Earth capture of land masses. Ice edges are 20160812 from NIC.


Much Ado About CO2

Following a presentation in London by Dr. Murry Salby, there has been much discussion at several sites: No Tricks Zone, Climate Etc. and WUWT. These threads are always a challenge for a reader because there are exchanges debating various issues between highly convinced people who are seldom explicit about the assumptions underlying their relative positions.

Interesting in this case are the reactions to Salby’s assertion that the observed rise in atmospheric CO2 is caused by effects of rising temperatures upon natural sources/sinks, and not by rising fossil fuel emissions. (Leaving aside for today the whole other issue of climate sensitivity to changes in CO2).

Attacks have been mounted both by supporters of IPCC, and also by skeptics of IPCC alarms who nevertheless accept the notion that all or most of the measured rise in CO2 is from humans, fossil fuels and cement in particular. Still others find flaws in Salby’s argument, but are not convinced by the alternative.

I recently posted a review of Salby’s textbook which touched on this topic. Firstly, I agree with those who say you cannot use static calculations on a dynamic and open system like the atmosphere. That is, both inputs and outputs are interactive and vary in response to each other. The most obvious example is increasing CO2 causing plant growth which in turn consumes more CO2. Thus algebra can mislead us, since it is the differentials over time that accumulate the object of interest at changing rates.

Secondly, it seems to me that the atmosphere itself is too small a subsystem to draw any meaningful conclusions. The ocean and land sources/sinks are orders of magnitude larger than the amount in the atmosphere, and the errors in estimating those flows far exceed the man-made emissions (which are also estimates with larger uncertainties than is usually admitted).

Rather than thinking of the air as a reservoir of CO2, it is more like a tidal pool. Imagine a scientist concerned that this tidal pool is changing volume because of water (unpolluted) leaking from a nearby landfill. So a measuring cup sample is taken periodically and tested. All the while, the pool is repeatedly drenched and drained by waves, currents and tides, along with occasional rains and storms. Whatever the test results, the effect of additional water from the landfill can not be discerned in the absence of markers distinguishing it from ocean and rainwater.

I don’t say Salby has all the answers. I agree with him that at the current state of information, atmospheric CO2 from human sources can not be identified apart from much larger natural fluxes of CO2.

i

Laptev Wall and Nunavut Gauntlet

Update August 14, 2016

It appears that Northabout has found a way around the Laptev wall, and is close to finding open water.  Below the Google Earth image of ice edges from NIC shows how the strait has opened up along with navigable shore lines.

Aug13googleRev

Imagery date refers to Google Earth capture of land forms. Ice edges are provided by MASIE for August 13, 2016.

The Big Picture from August 11, 2016.

masie_August 11rev

The Polar Ocean Challenge involves the sailing ship Northabout circumnavigating the North Pole counterclockwise starting from Bristol UK. The chart above from MASIE shows the two choke points in the itinerary: The Laptev Wall of ice at the beginning and the Nunavut Gauntlet of ice at the end. The image shows If Northabout can get past Laptev, it is relatively clear sailing all the way to Beaufort where Nunavut awaits.

20160809en

The above chart from AARI shows how Northabout has passed through the strait from Kara into Laptev and is in a holding pattern up against the wall.  Caleb has some great photos (here) of the views from the deck, along with some comments respecting the explorers despite their being misled by global warming theorists.

20160809enBaffin

Above is the latest chart from AARI showing the present ice situation at the other end of the trip, the Nunavut Gauntlet.  The white part is without data since the Russians are focused on their side of the ocean, but it does show heavy ice in Beaufort Sea on the right,  Within Nunavut, Parry Channel is well blocked, but with some water around the edges.  If and when Northabout gets here, no one knows what they will face.  They are counting on the passage opening this year, unlike previous years.

An image of the ice and snow extents from NOAA by way of National Ice Center (NIC)

A closeup of Nunavut from that chart shows they have a chance by using the southern route, skipping all but the eastern end of Parry Channel, provided the ice is better not worse than now when they approach.

cursnow_alaskaNOAAnunavut

Footnote:

Another view of the Arctic is available from NIC using Google Earth.  The daily shapefile can be downloaded, and it then opens in Google Earth, which allows you to browse and zoom in on regions of interest.  Here is an image from this source:

20160812google

Note: Imagery date is Google Earth capture of land masses. Ice edges are 20160812 from NIC.


Nunavut is Melting, Or not


From Yale Climate Connections we heard last week about Nunavut melting and a theatrical production to spread news and concerns about this dangerous development.

“I come from a place of rugged mountains, imperial glaciers and tender-covered permafrost. But Nunavut, our land, is only as rich as it is cold, and today most of it is melting.”That’s Chantal Bilodeau, reading a passage from “Sila,” a play about the effects of climate change in the Arctic.

The characters in her play include polar bears, an Inuit goddess, scientists, and coast guard officers – all working together to save their land.

No doubt her personal experience and feelings for her Nunavut are sincere and profound. (Originally I thought it was her homeland, but in fact she is a New York playwright and translator, born in Montreal.) And there will be a large audience receptive to her concerns about global warming. (Bilodeau has writen six plays about the Arctic and founded the international network Artists And Climate Change.) But I wonder if scientific measurements support her belief that Nunavut is melting.

After all, we have learned from medical research that individual life experiences (anecdotes) may not be true more generally. That is why drugs are tested on population samples with double-blind studies: neither the patient nor the doctor knows who gets the medicine and who gets the placebo.

So I went looking for weather station records to see what is the warming trend in that region. As curiosity does so often, it led me on a journey of discovery, learning some new things, and relearning old ones with fresh implications.

Where are temperatures measured in Nunavut?

It is by far the Northernmost territory of Canada, just off the coast of Northern Greenland.

According to Environment Canada, weather is reported at 29 places in Nunavut. So I went to look at the record at Iqaluit, the capital of the territory. You get monthly normals for the period 1981 to 2010. Historical data (daily averages) can be accessed only 1 individual month/year at a time, the menu stops at 2004. Even then, some months are filled with “M” for missing. Historical data from which trends can be analyzed is hard to come by.

Disappearing Weather Records

It turns out that Nunavut also suffered from the great purging of weather station records that was noticed by skeptics years ago.

Ave. T vs. No. Stations

Graph showing the correlation between Global Mean Temperature (Average T) and the number of stations included in the global database. Source: Ross McKitrick, U of Guelph

I was aware of this because of a recent study looking at trends at stations around the Arctic circle. Arctic Warming Unalarming.  That study included graphs that showed the dramatic removal of station records in the North.  Though the depletion was not limited to the far North, many Canadian and Russian records disappeared from the global database.

arctic-europe-paper-2015_fig6annual

Fig. 6 Temperature change for annual Arctic averages relative to the temperature during 1961 to 1990 for stations in Europe having more than 150 years of observations. The red curve is the moving 5-year average while the blue curve shows the number of stations reporting in each year. 118 stations contributed to the study. W. A. van Wijngaarden, Theoretical & Applied Climatology (2015)

Eureka, Nunavut, Canada “Last Station above latitude 65N”

Eureka got considerable attention in 2010 due to its surviving the dying out of weather stations. The phrase in quotes above reflects an observation that GISS uses Eureka data to infill across the whole Arctic Circle. That single station record is hugely magnified in its global impact in that temperature reconstruction product. Somewhat like the influence of a single tree in Yamal upon the infamous hockey stick graph.

The first High Arctic Weather Station in history, Eureka was established in April 1947 at 80-degrees north latitude in the vicinity of two rivers, which provided fresh water to the six-man United States Army Air Force team that parachuted in. They erected Jamesway huts to shelter themselves and their equipment until August, when an icebreaker reached Eureka – as it has every year since – and brought permanent buildings and supplies. For decades after that, small, all-male crews would hunker down for entire winters, going a little stir-crazy from the isolation. WUWT 2010

GHCN Records for Nunavut

It turns out that in addition to Eureka, GCHN has data for Alert and Clyde (River), but the latter two histories end in 2004 and 2010, respectively. The adjusted files have a few differences in details, but little change from the unadjusted files. The chart below shows the temperatures measured at Eureka, Nunavut, Canada 79° 98’ N, 85° 93’ W.  The other two stations tell the same story as Eureka, though temperatures at Clyde are warmer in absolute terms due to its more Southerly location.

Eureka temps4

The chart shows Annual, July and January averages along with the lifetime averages of Eureka station from 1948 through 2015.  There is slight variability, and a few years higher than average, but nothing alarming or even enough for people to sense any change.  Note also that annual averages are well below freezing, because only 3 months are above 0° C.  I suppose that someone could play with anomalies and generate a chart that looked scary, but the numbers in the record do not support fears of global warming and melting in Nunavut.

Conclusion

Once again we see media announcements that confuse subjective beliefs with empirical observations of objective reality.  And unfortunately, those observations are less and less available to counter the herd instincts of fearing the future and blaming someone.

Footnote

The map at the top shows how crucial is Nunavut to the Polar Ocean Challenge.  If the Northabout  successfuly negotiates the Northern Sea Route (the Russian side), they then must pass from Beaufort Sea through the Parry Channel (or alternative passages) to get to Baffin Bay.  Laptev is the first hurdle, and Nunavut is the last one.