A Welcome Voice in the Climate Debate

Someone has written a book much needed, adding a welcome voice into rational consideration of climate matters. The book is entitled: Doubt and Certainty in Climate Science, it is free and can be downloaded here:

Click to access longhurst-final.pdf

About the author

Alan R. Longhurst is a biological oceanographer who has studied the ecology of the continental shelf of the Gulf of Guinea (1954-63), and the trophic structure and flux of energy through the pelagic ecosystems of the eastern Pacific (1963-71), the Barents Sea (1973), the Canadian Arctic (1983-89) and the Northwest Atlantic (1978-94). He coordinated the international EASTROPAC expeditions in the 1960s and directed the NOAA SW Science Center on the Scripps campus at La Jolla (1967-71), the Marine Ecology Laboratory at the Bedford Institute of Oceanography (1977-79) and was Director-General of that Institute (1970-86). He has published 80-odd research papers and his most recent books are “Ecological Geography of the Sea” (Elsevier, 1998 & 2007) and “Mismanagement of Marine Fisheries” (Cambridge, 2010).

I recommend this climate science book as readable, thorough, considerate, and well-documented.  He also gives insightful personal experiences from his oceanographic career. I particularly appreciate his emphasis on the ocean’s complex role in climate dynamics. Also his discussion of surface temperature measurements  has echos in my own analyses of the records.

For a review and overview by Dr. Judith Curry, her post is here:

http://judithcurry.com/2015/09/20/new-book-doubt-and-certainty-in-climate-science/

Longhurst concludes with this:

Perhaps the one thing that would shake the collective certainty would be if the simple, single value used to represent global surface temperature continued to languish at around the same value as it has for the last 15 years for, say, another 5 years? Of course, it may not – simply because the next Nino will quickly reduce the area of cold, upwelled water exposed at the sea surface and global SST will suddenly rise, as it did in 1998. In fact, as I write, this is occurring and the anticipated announcement has already been made NOAA that this year we experienced the warmest July ever recorded.

But if a new Gleissberg cycle makes itself felt when the equatorial Pacific has settled back into its ‘normal’ Trade Wind state, and if the new cycle overwhelms the effect on SAT measurements of urbanisation and land use change so that the GSMT index cools significantly, then the earth sciences will have a heavy bill to be paid in the arena of public support. And the more so if a Convention concerning measures agreed to be taken has already been signed into effect…

Arctic Ice Minimums Compared

Update Sept. 20, 2015: 2014 and 2015 Minimums Established, 11 days ago in NOAA, 2 days ago in MASIE

In the annual match of the ocean vs. Arctic ice, Mother Nature has blown the whistle. Results are little confusing, since NOAA shows the lowest extent 11 days ago, and MASIE only 2 days ago. Moreover, MASIE dropped a lot of ice in the recent period and is now showing less ice than NOAA.  Usually, MASIE is higher by 2-300k km2.

Still, for the climate record it will be the September average that counts, and the platform is firmed up for that result.

First the daily situation:


September 19 day 262 results from MASIE. 2014 loses a lot while 2015 gains a lot of ice extent.

While 2014 lost 46k of ice, 2015 gained 70k recovering well above the previous annual daily ice minimum..

2015 ice extent now trails 2014 by 10.6%, which is about 538k km2 difference. Day 262 is the 2014 daily ice extent minimum. Day 260 was 2015 minimum, according to MASIE.

masie day 262

Comparing 2014 and 2015 at Annual Minimums

Ice Extents Day 2014262 Day 2015260 Ice Extent
Region Ann Min Ann Min km2 Diff.
 (0) Northern_Hemisphere 5066134 4442258 -623876
 (1) Beaufort_Sea 655536 484880 -170656
 (2) Chukchi_Sea 235122 187420 -47701
 (3) East_Siberian_Sea 455832 219274 -236559
 (4) Laptev_Sea 1212 44701 43489
 (5) Kara_Sea 64255 1778 -62478
 (6) Barents_Sea 132741 18 -132723
 (7) Greenland_Sea 210190 236707 26517
 (8) Baffin_Bay_Gulf_of_St._Lawrence 18245 57136 38891
 (9) Canadian_Archipelago 341623 228074 -113549
 (10) Hudson_Bay 862 47674 46811
 (11) Central_Arctic 2949375 2933456 -15919

The table shows the effects of weather in the western Arctic.  In August 2015 lost 700k km2 more than 2014, a differential that persisted to the minimum.  The reductions occurred in the BCE region and in the near by CAA (Canadian Archipelago).  In addition in the east, Barents melted out early and entirely, and nearby Kara become mostly open water.

Elsewhere, on the Canadian side, Hudson and Baffin Bay along with the Greenland Sea had more ice, and the Central Arctic was nearly the same as in 2014.

2015 Recap:

The first 19 days of September 2015 is in the books, so here is an outlook on the melt season conclusion beyond the daily minimums.

For most of the season, 2015 Arctic sea ice extent was tracking 2014. In fact the July average extent was slightly higher than 2014. Then weather intervened in the last week of August. A large and strong cyclone centered over Chukchi Sea began breaking up ice in the BCE Region and affecting CAA (Canadian Archipelago) and the Central Arctic.  In addition, most of the summer the Arctic Oscillation (AO) was in negative phase, meaning fewer clouds, more direct insolation and ice melting.  More discussion of these two factors is at the end of this post.

The effects of this storm are seen in the rapid increase in water extent ( 482k km2 in one week) so that August 31 2015 had less ice than did 2014 at minimum September 19. Water extent continued to grow, and then stabilized once the storm abated and the AO went from negative to neutral.  Now the ice is growing beyond the daily minimum.

Comparing MASIE and NOAA Ice Extents.

Month 2015 2015 2015 2014 2014 2014
Ave. MASIE NOAA MASIE-NOAA MASIE NOAA MASIE-NOAA
Feb 15.032 14.498 0.534
March 15.170 14.758 0.413
April 13.650 13.954 -0.304 14.318 14.088 0.230
May 12.646 12.485 0.161 12.916 12.701 0.215
June 10.841 10.889 -0.049 11.324 11.033 0.292
July 8.713 8.411 0.302 8.482 8.108 0.374
August 5.961 5.658 0.303 6.353 6.078 0.275
Sept 4.545 4.463 0.082 5.364 5.220 0.144
Oct 7.697 7.232 0.464

The table shows July 2015 was above 2014 but late August weather caused a drop in monthly averages.  The August average is now complete and shows ice extent dropped ~2.7M km2 from July, compared to a 2014 loss of ~2.0M. That difference has persisted up to today. NOAA typically reports a lower extent than MASIE, a difference that averaged ~300k km2.  Then in one week MASIE dropped while NOAA plateaued, and now NOAA September extents are quite close to MASIE, some days showing a higher number.

With the September daily ice starting out lower than 2014 the monthly average should end up much smaller.  The September first 19 days average is shown, a figure that should rise and end the month near 4.6M km2. This presumes the minimum has definitely occurred, and the recovery is in effect.

In any case, I am not alarmed over open water in the Arctic. Steadily increasing and above average September ice extents signify the coming of the next ice age, a genuine threat to human life and prosperity.  Fortunately, that is not the indication this year.

Current and Recent Weather in the Arctic

In addition to the storm, the negative AO has been conducive to accelerating ice melting by increased insolation.

September 16 Arctic Oscillation Forecast from AER:

The AO, which has remained almost consistently in negative territory since late June, has resulted in near record low AO values for July and August. The AO is predicted to first trend positive through the weekend and pop into positive territory early next week. However by midweek the AO is predicted to return back into negative territory and remain negative through early October.

“The positive trend in the AO and the setting sun may have brought an early end to the Arctic sea ice melt season but not before sea ice extent achieved its fourth lowest value since observations began.  It is likely that the extremely low AO values observed in July and August are reflective of atmospheric conditions (sunny and warm) that were conducive to rapid sea ice melt.”

https://www.aer.com/science-research/climate-weather/arctic-oscillation

The Alaska Dispatch News reported August 27 on the storm effects at Barrow, Alaska:

“The service has issued a coastal flood warning for Barrow until Friday morning, along with a high surf advisory for the western part of the North Slope and a gale warning for much of the Beaufort and Chukchi Seas. Seas up to 14 feet were forecast for Thursday in the Chukchi. . .Thursday’s high waves and flooding are products of a large storm that’s being felt as far as Southcentral Alaska, where high winds are forecast, Metzger said. “It’s a pretty big low-pressure system that’s over the Arctic Ocean,” he said. ”

https://www.adn.com/article/20150827/high-winds-causing-big-waves-flooding-barrow

a quarter million square KM of arctic ice in the CAB, adjacent to the Beaufort and Chukchi. 20150829

This storm is reminiscent of the 2012 event that resulted in the lowest ice, greatest water extent this century. The high winds, waves and swells have several effects: Gales push ice floes, opening water between them and pushing them toward warmer waters; Ice pieces are churned and fractured increasing the melt rate; Wave action can flood ice packs or can cause compacting, further reducing extent.

Anti-Racketeering Initiative

There’s a lot of buzz lately over a letter from some US academics asking for prosecution of those questioning consensus climate science. It is proposed that this offense can be considered as organized crime under the RICO legislation:  the Racketeer Influenced and Corrupt Organizations Act

One commenter (h/t Hans Erren) at the Climate Etc. Discussion said:

Wikipedia defines a racket as: A racket is a service that is fraudulently offered to solve a problem, such as for a problem that does not actually exist, that will not be put into effect, or that would not otherwise exist if the racket did not exist. Conducting a racket is racketeering. Particularly, the potential problem may be caused by the same party that offers to solve it, although that fact may be concealed, with the specific intent to engender continual patronage for this party.

Clearly the academics (many of whom are not physical scientists) missed their target. The IPCC fits perfectly the definition of a racket and could be pursued under RICO. Though I don’t think the courts are qualified to settle this or any science.

Still, “If the Glove Fits, You cannot Acquit!”


The Climates, They are A-changing.

Updated below with comments and additional links September 17-19

Seeing a lot more of this lately, along with hearing the geese  honking. And in the next month or so, we expect that trees around here will lose their leaves. It definitely is climate change of the seasonal variety.

Interestingly, the science on this is settled: It is all due to reduction of solar energy because of the shorter length of days (LOD). The trees drop their leaves and go dormant because of less sunlight, not because of lower temperatures. The latter is an effect, not the cause.

Of course, the farther north you go, the more remarkable the seasonal climate change. St. Petersburg, Russia has their balmy “White Nights” in June when twilight is as dark as it gets, followed by the cold, dark winter and a chance to see the Northern Lights.

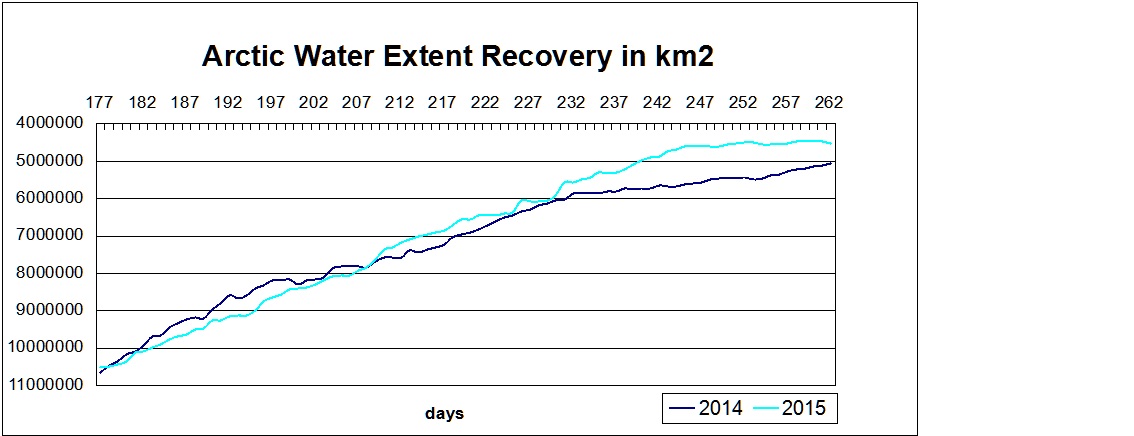
And as we have been monitoring, the Arctic ice has been melting from sunlight in recent months, but will now begin to build again in the darkness to its maximum in March.

We can also expect in January and February for another migration of millions of Canadians (nicknamed “snowbirds”) to fly south in search of a summer-like climate to renew their memories and hopes. As was said to me by one man in Saskatchewan (part of the Canadian wheat breadbasket region): “Around here we have Triple-A farmers: April to August, and then Arizona.” Here’s what he was talking about: Quartzsite Arizona annually hosts 1.5M visitors, mostly between November and March.

Of course, this is just North America. Similar migrations occur in Europe, and in the Southern Hemisphere, the climates are changing in the opposite direction, Springtime currently. Since it is so obviously the sun causing this seasonal change, the question arises: Does the sunlight vary on longer than annual timescales?

The Solar-Climate Debate

And therein lies a great, enduring controversy between those (like the IPCC) who dismiss the sun as a driver of multi-Decadal climate change, and those who see a connection between solar cycles and Earth’s climate history. One side can be accused of ignoring the sun because of a prior commitment to CO2 as the climate “control knob”.

The other side is repeatedly denounced as “cyclomaniacs” in search of curve-fitting patterns to prove one or another thesis. It is also argued that a claim of 60-year cycles can not be validated with only 150 years or so of reliable data. That point has weight, but it is usually made by those on the CO2 bandwagon despite temperature and CO2 trends correlating for only 2 decades during the last century.

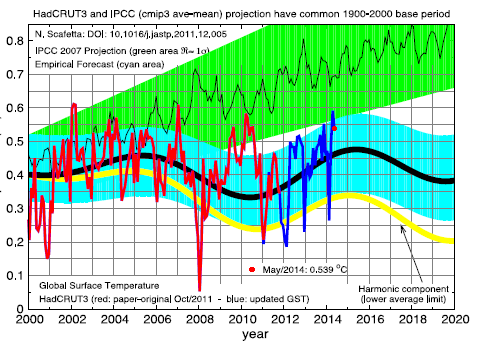
One scientist in this field is Nicola Scaffeta, who presents the basic concept this way:

“The theory is very simple in words. The solar system is characterized by a set of specific gravitational oscillations due to the fact that the planets are moving around the sun. Everything in the solar system tends to synchronize to these frequencies beginning with the sun itself. The oscillating sun then causes equivalent cycles in the climate system. Also the moon acts on the climate system with its own harmonics. In conclusion we have a climate system that is mostly made of a set of complex cycles that mirror astronomical cycles. Consequently it is possible to use these harmonics to both approximately hindcast and forecast the harmonic component of the climate, at least on a global scale. This theory is supported by strong empirical evidences using the available solar and climatic data.”

He goes on to say:

“The global surface temperature record appears to be made of natural specific oscillations with a likely solar/astronomical origin plus a noncyclical anthropogenic contribution during the last decades. Indeed, because the boundary condition of the climate system is regulated also by astronomical harmonic forcings, the astronomical frequencies need to be part of the climate signal in the same way the tidal oscillations are regulated by soli-lunar harmonics.”

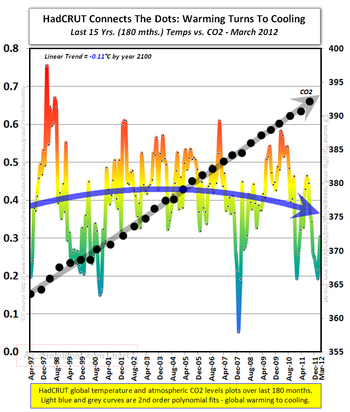
He has concluded that “at least 60% of the warming of the Earth observed since 1970 appears to be induced by natural cycles which are present in the solar system.” For the near future he predicts a stabilization of global temperature until about 2016 and cooling until 2030-2040.

https://tallbloke.wordpress.com/2014/07/28/nicola-scafetta-global-temperatures-and-sunspot-numbers-are-they-related-yes-but-non-linearly/

A Deeper, but Accessible Presentation of Solar-Climate Theory

I have found this presentation by Ian Wilson to be persuasive while honestly considering all of the complexities involved.

The author raises the question: What if there is a third factor that not only drives the variations in solar activity that we see on the Sun but also drives the changes that we see in climate here on the Earth?

The linked article is quite readable by a general audience, and comes to a similar conclusion as Scaffeta above: There is a connection, but it is not simple cause and effect. And yes, length of day (LOD) is a factor beyond the annual cycle.

Click to access IanwilsonForum2008.pdf

It is fair to say that we are still at the theorizing stage of understanding a solar connection to earth’s climate. And at this stage, investigators look for correlations in the data and propose theories (explanations) for what mechanisms are at work. Interestingly, despite the lack of interest from the IPCC, solar and climate variability is a very active research field these days.

A summary of current studies is provided at NoTricksZone:

http://notrickszone.com/2015/09/14/already-23-papers-supporting-sun-as-major-climate-factor-in-2015-burgeoning-evidence-no-longer-dismissible/#sthash.2MviVRWR.dpbs

Ian Wilson has much more to say at his blog: http://astroclimateconnection.blogspot.com.au/

Once again, it appears that the world is more complicated than a simple cause and effect model suggests.

For everything there is a season, a time for every purpose under heaven.

What has been will be again, what has been done will be done again; there is nothing new under the sun.

(Ecclesiastes 3:1 and 1:9)

Update Sept. 17: Commentary with Dr. Arnd Bernaerts

ArndB comments:

Fine writing, Ron, well done!
No doubt the sun is the by far the most important factor for not living on a globe with temperatures down to minus 200°C. That makes me hesitating to comment on „solar and climate variability” or “the sun drives climate” (currently at NTZ – link above), but today merely requesting humbly that the claimed correlation should be based at least on some evidence showing that the sun has ever caused a significant climatic shift during the last one million years, which was not only a bit air temperature variability due to solar cycles that necessarily occur in correlation with the intake and release of solar-radiation by the oceans and seas.

Interestingly the UK MetOffice just released a report (Sept.2015, pages 21) titled:
“Big Changes Underway in the Climate System?”
by attributing the most possible and likely changes to the current status of El Niño, PDO, and AMO, and – of course – carbon dioxide -, and a bit speculation on less sun-energy (see following excerpt at link)

Click to access Changes_In_The_Climate_System.pdf

From p. 13: “It is well established that trace gases such as carbon dioxide warm our planet through the “greenhouse effect”. These gases are relatively transparent to incoming sunlight, but trap some of the longer-wavelength radiation emitted by the Earth. However, other factors, both natural and man-made, can also change global temperatures. For example, a cooling could be caused by a downturn of the amount of energy received from the sun, or an increase in the sunlight reflected back to space by aerosol particles in the atmosphere. Aerosols increase temporarily after volcanic eruptions, but are also generated by pollution such as sulphur dioxide from factories.
These “external” factors are imposed on the climate system and may also affect the ENSO, PDO and AMO variations……

My Reply:

Thanks Arnd for engaging in this topic.

My view is that the ocean makes the climate by means of its huge storage of solar energy, and the fluctuations, oscillations in the processes of distributing that energy globally and to the poles. In addition, the ocean is the most affected by any variation in the incoming solar energy, both by the sun outputting more or less, and also by clouds and aerosols blocking incoming radiation more or less (albedo or brightness variability).

https://rclutz.wordpress.com/2015/04/21/the-climate-water-wheel/

The oscillations you mention, including the present El Nino (and Blob) phenomenon, show natural oceanic variability over years and decades. Other ocean cycles occur over multi-decadal and centennial scales, and are still being analyzed.

At the other end of the scale, I am persuaded that the earth switches between the “hot house” and the “ice house” mainly due to orbital cycles, which are an astronomical phenomenon. These are strong enough to overwhelm the moderating effect of the ocean thermal flywheel.

The debate centers on the extent to which solar activity has contributed to climate change over the last 3000 years of our current interglacial period, including current solar cycles.

Update September 19

Additional studies showing a solar-climate connection are here: https://translate.google.com/translate?hl=&sl=de&tl=en&u=http%3A%2F%2Fwww.kaltesonne.de%2Fsonne-macht-klima-neues-aus-europa%2F

Everywhere Elsewhere Climate Claims

We often hear reports that something is occurring around the world, and then someone responds: “That’s not happening where I live.” And the rebuttal is, “Your neighborhood is not typical of the rest of the world.” In other words, the claim is: this trend is going on everywhere elsewhere despite your not observing it.

For a month now we have been reading in the media about how July was the hottest month in recorded history.

“July was Earth’s hottest month on record, NOAA says” http://www.bbc.com/news/world-us-canada-34009289

And at the same time, we read reports about how cool the summer was in Canada, in the US, in the UK, in parts of Europe and how cold was the winter in Australia.

“What a washout! A British summer to forget. In the UK July was colder than average, and we had 140% of average rainfall.” http://www.theguardian.com/uk-news/2015/aug/16/washout-british-summer-witness-holiday-experts

“The July contiguous U.S. average temperature was 73.9°F, 0.2°F above the 20th century average and ranked near the middle in the 121-year period of record.” http://www.ncdc.noaa.gov/sotc/national/201507

“Wetter than normal summer for most of Canada except B.C.” http://www.vancitybuzz.com/2015/08/wetter-than-normal-summer-canada-except-bc/

“A large swath stretching from eastern Scandinavia into western Siberia was cooler than average, with part of western Russia much cooler than average. Cooler than average temperatures were also observed across parts of eastern and southern Asia and scattered areas in central and northern North America.” (Source: NOAA)

So the question arises: Is there global warming unseen in most observations? How would we know what was observed in July and whether it was unusual or not?

NOAA provides this analysis of July 2015.

Continental Temperature Anomalies July 2015

CONTINENT ANOMALY (1910-2000) TREND (1910-2015) RANK
°C °F °C °F (OUT OF 106 YEARS)
North America 0.53 0.95 0.08 0.14 Warmest 16ᵗʰ
Coolest 90ᵗʰ
Ties: 1941
South America 1.43 2.57 0.14 0.25 Warmest 5ᵗʰ
Coolest 102ⁿᵈ
Europe 1.53 2.75 0.12 0.21 Warmest 6ᵗʰ
Coolest 101ˢᵗ
Africa 1.2 2.16 0.1 0.18 Warmest 2ⁿᵈ
Coolest 105ᵗʰ
Asia 0.7 1.26 0.07 0.13 Warmest 10ᵗʰ
Coolest 97ᵗʰ
Oceania 0.57 1.03 0.11 0.19 Warmest 26ᵗʰ
Coolest 81ˢᵗ

https://www.ncdc.noaa.gov/sotc/global-regions/201507

The table shows that no continent had the warmest July ever.  Africa came close and also South America, which means a milder mid-winter than usual in the southern hemisphere.  So how come they claim a record July?

The answer is provided by another NOAA analysis.

Global Analysis of July 2015

JULY ANOMALY RANK RECORDS
°C °F (OUT OF 136 YEARS) YEAR(S) °C °F
Global
Land +0.96 ± 0.18 +1.73 ± 0.32 Warmest 6th 1998 1.11 2
Coolest 131st 1884 -0.68 -1.22
Ocean +0.75 ± 0.07 +1.35 ± 0.13 Warmest 1st 2015 0.75 1.35
Coolest 136th 1911 -0.5 -0.9
Land and Ocean +0.81 ± 0.14 +1.46 ± 0.25 Warmest 1st 2015 0.81 1.46
Coolest 136th 1904, 1911 -0.47 -0.85


So there you have it.  Once again the ocean is making the climate, with July SSTs higher because of the Blob and the long-developing El Nino.  And we can expect that with all the heat now being released upward from the water, there will be cooling of SSTs and a La Nina in response.

Flawed Policies for Climate Action

Ruth Dixon has incisively and fearlessly rebutted the public position of a prominent climate alarmist.  She summarizes the argument that will be asserted again many times in the weeks ahead of Paris COP.  And then she stirs up the sand upon which this whole appeal is built.

The article is a review of the recent book by Nicholas Stern, a leading and longtime advocate for fossil fuel reduction treaties.  “Why Are We Waiting? The Logic, Urgency, and Promise of Tackling Climate Change” by Nicholas Stern is reviewed by Ruth Dixon in the October 2015 edition of Journal of Economic Psychology.  It is an important statement deserving careful reading and dissemination. An advance copy of the text is here:

Click to access review-of-stern-2015.pdf

In the end, the problem is with the policies themselves:

“In assessing Stern’s avowedly biased book, readers must confront their own biases. Is Stern right to be so pessimistic about climate change and the inability of nations to build up resilience through economic development? Is he right to be so optimistic about the ability of governments to predict and manage change? If he is correct, we need more than ‘communication strategies’ to meet this challenge – we need arguments that do not rely on a selective presentation of the evidence, and solutions that take into account the physical, chemical and engineering challenges that our collective demand for energy requires. Governments regularly implement costly and unpopular policies if they are convinced that they will be effective. The lack of ‘action’ suggests that such policies are not (yet) available.”

In other words, even if you think there are damages to come from future warming, these policies are not a credible response.

There’s more at her blog:  “Stern’s book is not reliable on either science or policy.”

Bravo, Ruth Dixon.

https://mygardenpond.wordpress.com/2015/09/01/review-of-nicholas-stern-why-are-we-waiting/

Seeing the Arctic Melt without Warmist Glasses

In my Arctic Ice Watch reports I have been tracking progress toward September minimum with graphs like these (data from MASIE):

masie day 230

Doing this after a 3-week break, I was struck by the chart looking a lot like the scoring summary of a tight basketball game, only upside down.

Then AndyG55 commented on my recent summary by linking to this chart from Ed Hoskins:

As the above diagram shows, the temperature balance was pretty close for 7000 years, until the cooling accelerated over the last 3000 years.

My light bulb was in seeing that the summer melt is actually the enormous effort by the ocean to recover water trapped as sea ice in the Arctic. The ice extent varies greatly over the centuries and we know from artifacts that it has been both greater and smaller than presently.  In this time of global warming alarmism, some of us watching the melt season find ourselves hoping for the ice to gain extent, simply to take away that basis for claiming the end is nigh.

Let’s be clear. In this contest between the ice and ocean, we humans should be rooting for the ocean, and so would plants and animals if they knew what was going on. None of us want another ice age, so it is a good thing that the ocean has been gaining on the sea ice extent in the last 150 years.

Once again warmists have got it backwards. The Arctic is a canary all right: The more ice there is in September, the closer we are to the next ice age. Open water in the Arctic is a good thing for the ocean and for the planet.

So taking off the warmist glasses, we should be cheering as the water extent grows and the ice retreats. We don’t wish for a record low because that would drive the alarmists into a frenzy.  Anything around 5M km2 for September would signify nothing unusual is happening, so scary things must be found elsewhere.

Maybe the chart should look like this to emphasize the positives of more water, less ice.

Arctic Water Recovery day 230

Conclusion:
I am not so naive to think that this perspective has much chance against the warmist PR juggernaut. Already the lessening of Antarctic sea ice this year is trumpeted as proof of CO2 warming, and not a celebration of fresh water added to the ocean.

The largest ice cap in the Eurasian Arctic – Austfonna in Svalbard – is 150 miles long with a thousand waterfalls in the summer.

But as Erasmus (1466-1536) said:
In the kingdom of the blind, the one-eyed man is king.

And this one also applies:

Men, it has been well said, think in herds; it will be seen that they go mad in herds, while they only recover their senses slowly, and one by one.
Charles Mackay. Extraordinary Popular Delusions and the Madness of Crowds (1841)

Iceland vs. Greenland, and all that

Why is it that Greenland is mostly ice and Iceland is mostly green?

Many explanations have been offered, usually along the lines of deception: Iceland was so called to discourage others from emigrating, and OTOH Greenland was named to attract others to resettle from Iceland. It seems that after a Viking internal power struggle, the loser and his followers could be banished to leave on a ship to find another land, or die at sea. Thus did Leif Ericsson venture from Iceland to Greenland to found a colony, and later to reach Vinland in today’s Newfoundland.

OLYMPUS DIGITAL CAMERA

Leif Ericsson memorial in front of Reykjavik cathedral.

But it may not be deception at all. When you are off the southeastern coast of Iceland, where the Vikings probably approached, and the sun breaks through for a time, you may be treated to this sight:

Iceland Glacier

Iceland Glacier August 5, 2015 sailing southeast of Iceland.

It happens that the Icelandic glacier sits prominently there, and so, it is land alright, but covered with ice. Of course, later on, they discovered the much more liveable western and southern parts and settled there, but maybe the original name stuck.

Meanwhile in Greenland, I was looking for the icecap and was told by our Inuit guide at Paamiut that you have to sail far up the right fjords to see the ice. Even though 90% of Greenland is ice-covered, that is not what you see from the shore.

Near Nuuk Greenland August 31, 2015

Near Nuuk Greenland August 31, 2015

Brought to you by:

OLYMPUS DIGITAL CAMERA

Follow the Water–Arctic Ocean Flywheels

The motto of oceanography should be: “It’s not that simple.”

Dallas Murphy wrote that in a book containing his reflections from numerous voyages with ocean scientists, entitled Follow the Water: Exploring the Sea to Discover Climate. The author goes on to say:

“One reason why the ocean has been left out of the climate-change discussion is that its internal mechanisms and its interactions with the atmosphere are stunningly complex. That the ocean has been left out has helped pitch the discussion toward unproductive, distracting extremes–either global warming is bunk or sea levels are about to rise twenty feet–and to frame the issue as a matter of opinion, like the place of prayer in public schools.”

He also quotes respected Oceanographer Carl Wunsch: “One of the reasons oceanography has a flavor all it’s own lies in the brute difficulty of observing the Ocean.”

A previous post on the Climate Water Wheel referred to the metaphor of the ocean serving as a thermal flywheel in our planetary climate due to the massive storage of solar energy in bodies of water.  Another post provided some basics on the dynamics of sea ice.

Now, in keeping with the motto above, we shall see that indeed, it is not that simple when we look more closely inside the Arctic Ocean. For example, consider this map from Woods Hole Oceanographic Institution (WHOI):

“Follow the water: Cold, relatively fresh water from the Pacific Ocean enters the Arctic Ocean through the Bering Strait. It is swept into the Beaufort Gyre and exits into the North Atlantic Ocean through three gateways (Fram, Davis, and Hudson Straits). Warmer, denser waters from the Atlantic penetrate the Arctic Ocean beneath colder water layers, which lie atop the warmer waters and act as a barrier preventing them from melting sea ice.

Once in the Arctic Ocean basin, the water is swept into a mammoth circular current—driven by strong winds—called the Beaufort Gyre (BG). Mighty Siberian and Canadian rivers also drain into the gyre to create a great reservoir of relatively fresh water. Winds trap this water in a clockwise flow, but periodically, the winds shift and the gyre weakens, allowing large volumes of fresh water to leak out. This is “the flywheel,” said WHOI physical oceanographer Andrey Proshutinksy, and when it turns off, fresh water flows toward the North Atlantic.

The water exits the Arctic Ocean via several “gateways.” It can flow through the Fram Strait, between northeast Greenland and Svalbard Island, and then branch around either side of Iceland. It can flow around the west side of Greenland through Baffin Bay and out Davis Strait. It may also flow through a maze of Canadian islands and out Hudson Strait.
These gateways are two-way: They also let in the warmer Atlantic waters that—if not for the halocline—could melt Arctic sea ice.”

http://www.whoi.edu/oceanus/feature/is-global-warming-changing-the-arctic

The BG Flywheel System

The research indicates that the complexity can be imagined as a series of flywheels, interacting and combining to moderate the short term effects of weather and changes in circulations of water and winds. Note that this conception shows the ocean flywheel as having four components or layers that operate in their own patterns while being interconnected.

And, as the flywheel system depicts, the ocean components are stratified by both temperature and salinity (saltiness). When sea ice forms, it releases salt into surface waters. These waters become denser and sink to form the Arctic halocline, a layer of cold water that acts as barrier between sea ice and deeper warmer water that could melt the ice. (Illustration by Jayne Doucette, WHOI)

More from WHOI:

Summarizing several hypotheses introduced recently in the publications mentioned above we conclude that the oceanic BG is a major part of the Arctic climate system and is responsible for:

a) Stabilization of the anticyclonic circulation of sea ice and upper ocean layers
b) Accumulation and release of liquid fresh water and sea ice from the BG
c) Ventilation of the ocean in coastal polynyas and openings along shelf-break
d) Regulation of the circulation and fractional redistribution of the summer and winter Pacific waters in the Arctic Ocean
e) Regulation of pathways of the freshwater from the Arctic to the North Atlantic

The sea ice flywheel is an intermediate link between the atmosphere and ocean. Also, sea ice is a product of the atmosphere and ocean interactions. It transfers momentum from the atmosphere to the ocean modifying it depending on sea ice concentration, thickness and its surface and bottom roughness and regulates heat and mass exchange between the atmosphere and ocean. Sea ice flywheel of the system is responsible for:

a) Regulation of momentum and heat transfer between the atmosphere and ocean
b) Accumulation and release of fresh water or salt during melting-freezing cycle
c) Redistribution of fresh water sources through involvement of the first year ice from the marginal seas into the BG circulation and keeping it there for years and transforming it into highly ridged and thick multi-year ice under converging conditions of the BG ice motion.
d) Memorizing of the previous years conditions and slowing down variations in order to avoid abrupt changes
e) Protection of ocean from overcooling or overheating (the latter is extremely important for polar biology)

http://www.whoi.edu/page.do?pid=66596

Conclusion:

Our planet’s climate has changed so little over thousands of years that alarms have been sounded over less than 1 degree celsius of estimated average warming since the Little Ice Age ended 150 years ago. But actually, our Modern Warming period was preceded by the Medieval Warm period, the Roman, and the Minoan Warm periods. Each of them was slightly cooler than the previous, and all of them warmer than now.

If you are looking for explanations why our moderate climate persists over millennia and varies only within a tight range of temperatures, give a thought to the role of the Arctic flywheel system.

Postscript:

Of course, even this is far from the whole story. As the map above shows, there’s lots more than the Beaufort Gyre going on. For example, the Transpolar Current drives flows of ice and water on the European side, in addition to the Beaufort Gyre acting on the North American side.

And despite the emphasis above on the Pacific water, the Atlantic Gulf stream supplies most of the water entering the Arctic.

“The Arctic Ocean is permanently supplied with new water from the Gulf Current, which enters the sea close at the surface near Spitsbergen. This current is called the West Spitsbergen current. The arriving water is relatively warm (6 to 8°C) and salty (35.1 to 35.3%) and has a mean speed of ca. 30 cm/sec-1. The warm Atlantic water represents almost 90% of all water masses the Arctic receives. The other ~10% comes via the Bering Strait or rivers. Due to the fact that the warm Atlantic water reaches usually the edge of the Arctic Ocean at Spitsbergen in open water, the cooling process starts well before entering the Polar Sea.”