Climate Lawfare Goes International
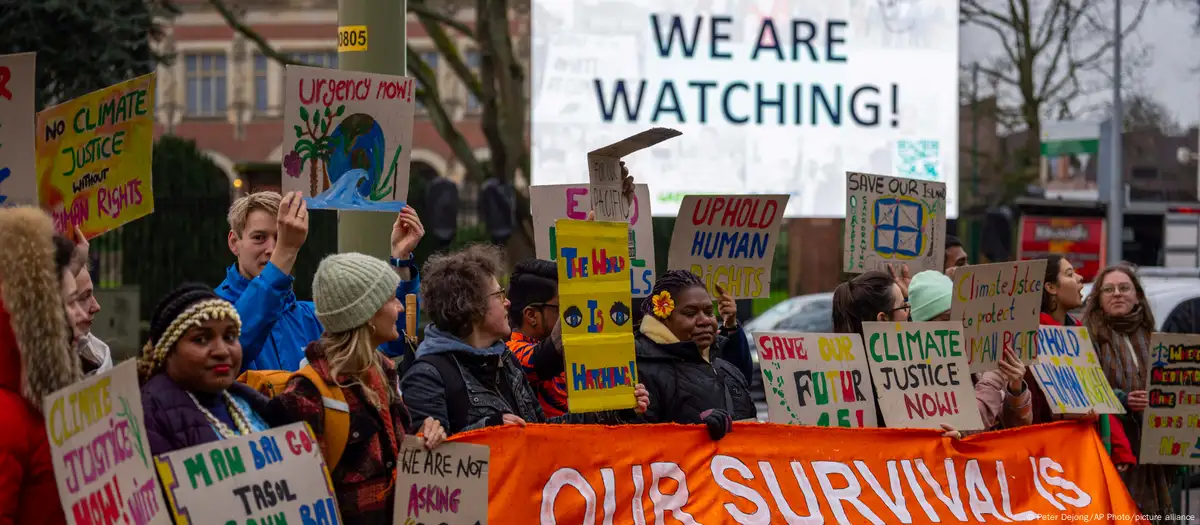
Activists hope the opinion from the ICJ’s judges will have far-reaching legal consequences in the fight against climate change Image: Peter Dejong/AP Photo/picture alliance
DW reports on hearings underway at ICJ International Court of Justice in the Hague. Overview of the proceedings in italics with my bolds. Vanuatu urges ICJ to recognise climate change harms
The outcome of the landmark case could lead to the
establishment of legal framework for holding countries
accountable in the fight against climate change.
Vanuatu, was the first of over 100 countries and organizations to present its views in the two-week proceedings seeking an advisory opinion from the World Court.
Handful of countries responsible for climate crisis World Court told
They demand that the failure to address climate change be declared a violation of international law. Arnold Kiel Loughman, attorney- general of the Vanuatu archipelago nation said that states have obligations to act with due diligence, to prevent significant harm to the environment, to reduce emissions, and to provide support to countries like his.
Aside from small island states and numerous Western and developing countries, the court will also hear from the world’s top two emitters of greenhouse gases, China and the United States. [More on those statements later on]
While activists are hopeful the outcome of the hearings will have far-reaching legal implications for violators, others are skeptical given that the UN’s highest court might take even years to implement.
Any decision will be non-binding because the court has no concrete means to enforce its rulings.
The hearings will continue until December 13. The court’s opinion is expected to be delivered in 2025.
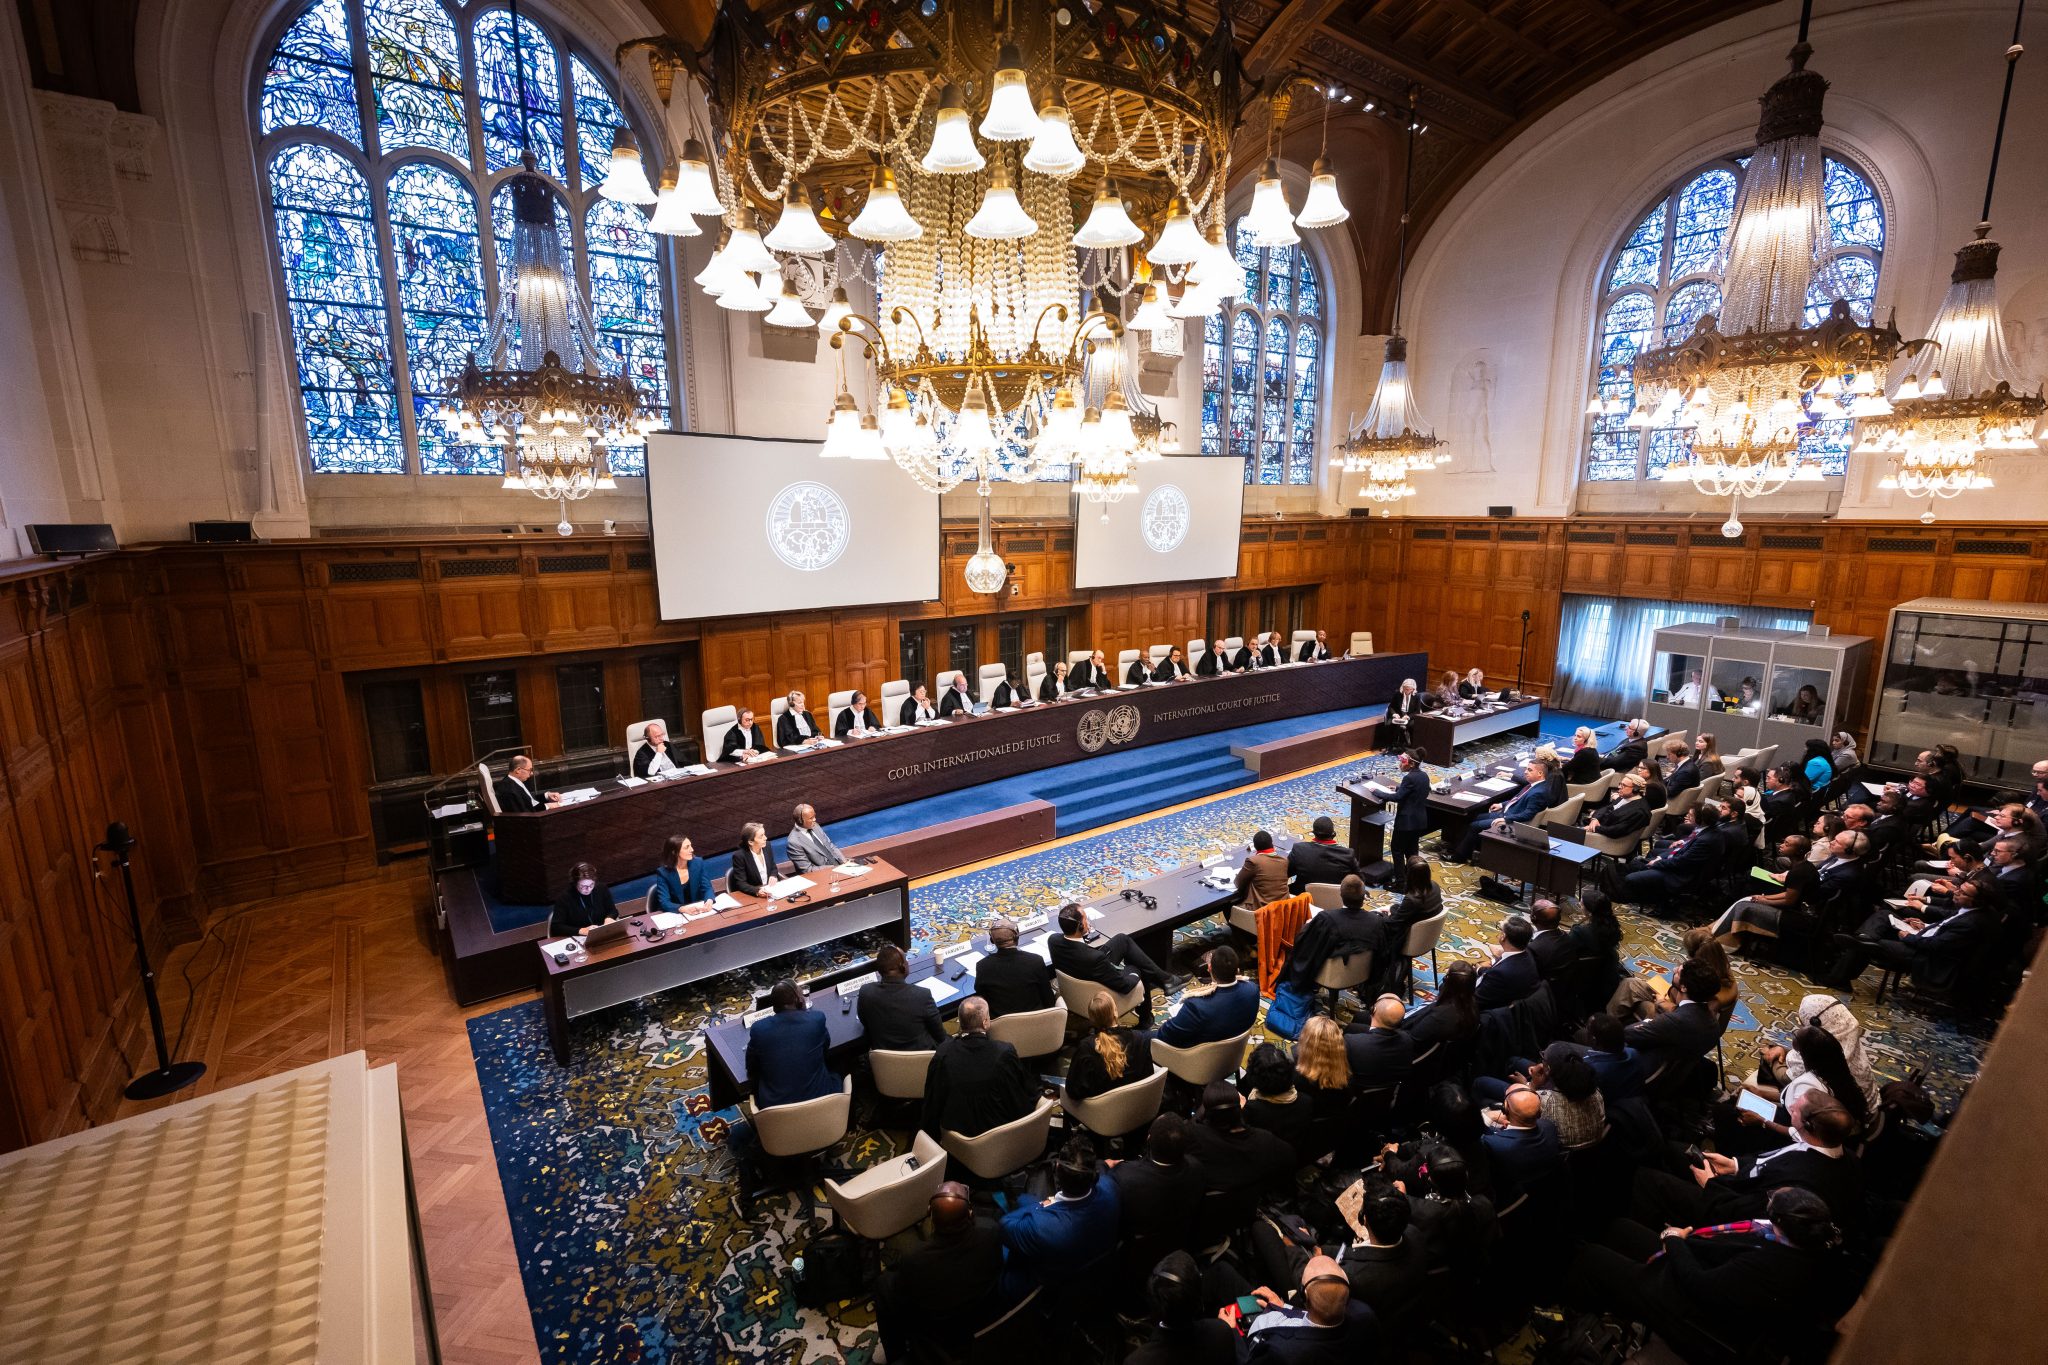
Public hearings at the International Court of Justice in The Hague on the request for an advisory opinion on the Obligations of States in respect of Climate Change, December 2024 (Photo: International Court of Justice)
Climate Home provides perspectives from the countries prospering from hydrocarbon energy in their article Big emitters accused of hiding behind climate treaties in international hearing. Excerpts in italics with my bolds.
The US, Saudi Arabia and others have pushed back against a global bid
to clarify states’ legal obligations to tackle climate change.
At a landmark legal hearing in The Hague this week, wealthy countries that are big emitters of planet-heating gases have used the Paris Agreement and other existing treaties on climate change to avoid additional pressure to step up their action to tackle global warming.
Their statements at the International Court of Justice (ICJ) sparked strong criticism from top climate diplomats and advocates who argue that international accords do not place limits on state accountability over climate change.
The two-week hearing is the culmination of years of campaigning by a group of law students from Pacific nations and diplomacy led by the island state of Vanuatu.

Their efforts resulted in a UN General Assembly resolution last year calling on the ICJ to provide an advisory opinion on the legal obligations of states to address climate change and the legal consequences if they fail to do so.
The ICJ says its advisory opinions are not binding. But experts stress that they clarify, rather than create, new law and will be referred to as authoritative documents in future climate litigation and during international climate negotiations.
In total, 98 states are giving oral submissions to the court, alongside a handful of institutions including the Organization of the Petroleum Exporting Countries (OPEC).
Four days into the hearing, a clear divide is emerging between wealthy nations that are historically high emitters and vulnerable nations on the frontlines of climate change that have contributed little to planetary heating.
The event has seen powerful fossil-fuel producing countries – from the United States to Russia – resist what they regard as an attempt to force them to do more to rein in emissions and provide reparations to those suffering because of their carbon pollution.
On Wednesday, the United States – which does not fully recognise the authority of the ICJ – told the court that sufficient legal frameworks are already in place to deal with climate change.
Margaret Taylor, legal adviser to the US Department of State, described global warming as the “quintessential collective action problem” which the UN Framework Convention on Climate Change (UNFCCC) and the Paris Agreement are carefully designed to deal with.
Those treaties, she said, embody “the clearest, most specific and most current expression of states’ consent to be bound by international law in respect of climate change” – and should therefore be the “primary framework” for determining their obligations.
Taylor told the court, on behalf of the US, that the Paris Agreement does not provide any legal standard against which to judge the adequacy of an NDC or to determine if a country is doing its fair share in global terms. Nor do states breach the agreement if they fail to achieve their NDCs, she added.
Many countries believe that legal obligations should not be limited to existing climate agreements and have asked the ICJ to consider a wide range of written and unwritten international law, including rules on transboundary harm, due diligence and the duty to cooperate and to prevent harm.
The relevance and scope of human rights in the context of climate change has also been hotly debated. States particularly disagree over the applicability of the right to a clean, healthy and sustainable environment. This was acknowledged by the UN General Assembly in a 2022 resolution but has proved difficult to implement.
Mamadou Hébié, associate professor of international law at Leiden University, representing Burkina Faso at the ICJ, said the Paris Agreement does not create any exemption or derogation from the rest of international law.
Zachary Phillips, counsel for Antigua and Barbuda, said compliance with the Paris Agreement is “necessary but may not be sufficient” to comply with unwritten ‘customary’ international law, including the obligation to prevent harm.
Several of the world’s biggest economies – among those most reliant on fossil fuels – have contended this week, however, that they have no obligations beyond the Paris pact and the UNFCCC. Australia, for example, said these are “central instruments” for global cooperation while China appealed to the court to avoid “fragmenting” international climate law.
Wiebke Rückert, Germany’s director for public international law, said the Paris Agreement strikes a “careful balance” between legal and non-legal commitments and warned that attempts to change that could “seriously” endanger the willingness of states to participate in political processes.
Ghaida Bajbaa, from Saudi Arabia’s energy ministry, said the UNFCCC provides “no basis whatsoever” for the court to authorise limits to fossil fuel extraction and consumption.
This was echoed by Maksim Musikhin, director of the legal department of Russia’s Ministry of Foreign Affairs, who said the transition away from fossil fuels – agreed at COP28 in Dubai last year – is not a legal obligation but rather a political appeal.
Ashfaq Khalfan, climate justice director for Oxfam America, said it was “absurd” for the Biden administration to make arguments against clearer legal obligations on climate change given the upcoming presidency of Donald Trump, who has vowed to withdraw the US from the Paris Agreement for a second time when he takes office.
The ICJ hearing continues until December 13 in The Hague, with other big greenhouse gas emitters such as the UK still to speak.