July Arctic Ice Surprise

Arctic ice July07to18

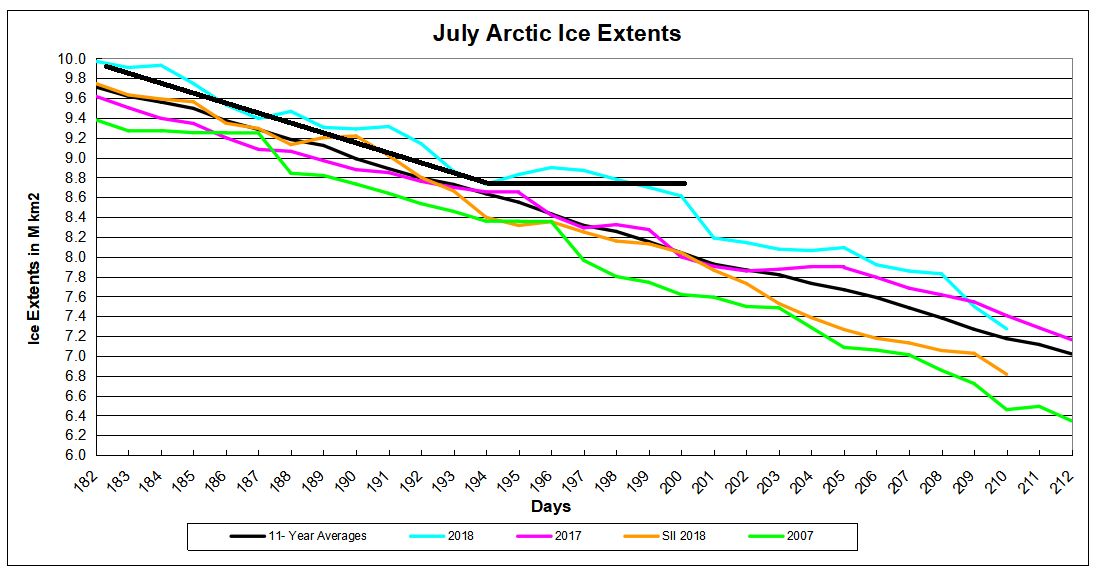
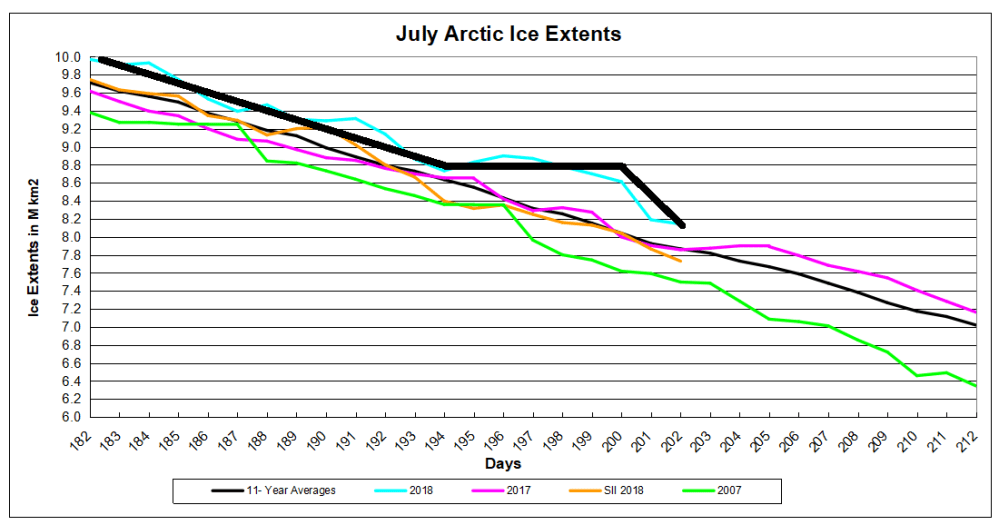
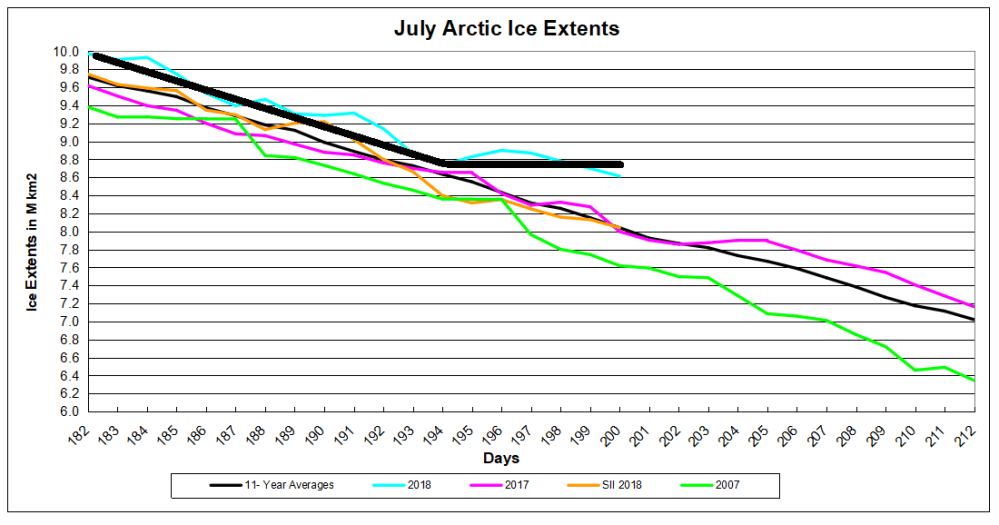
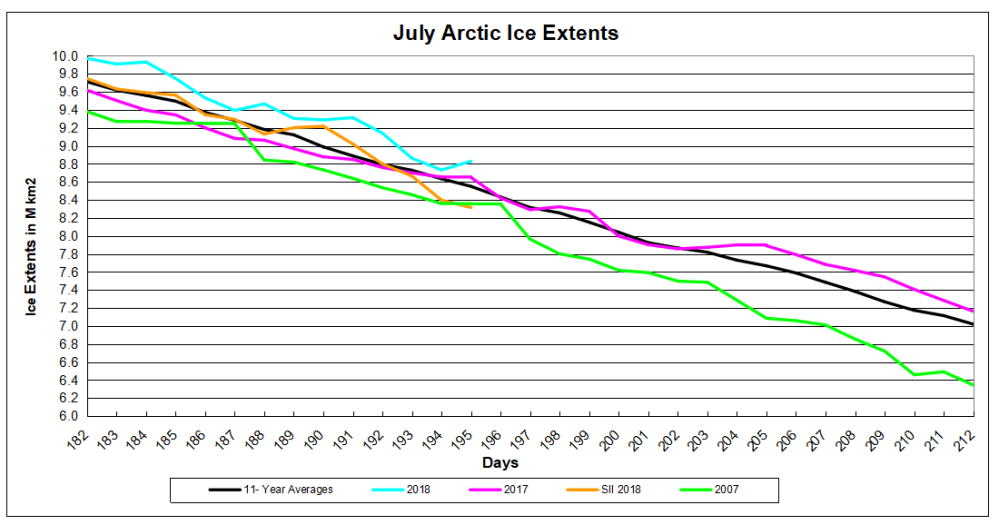
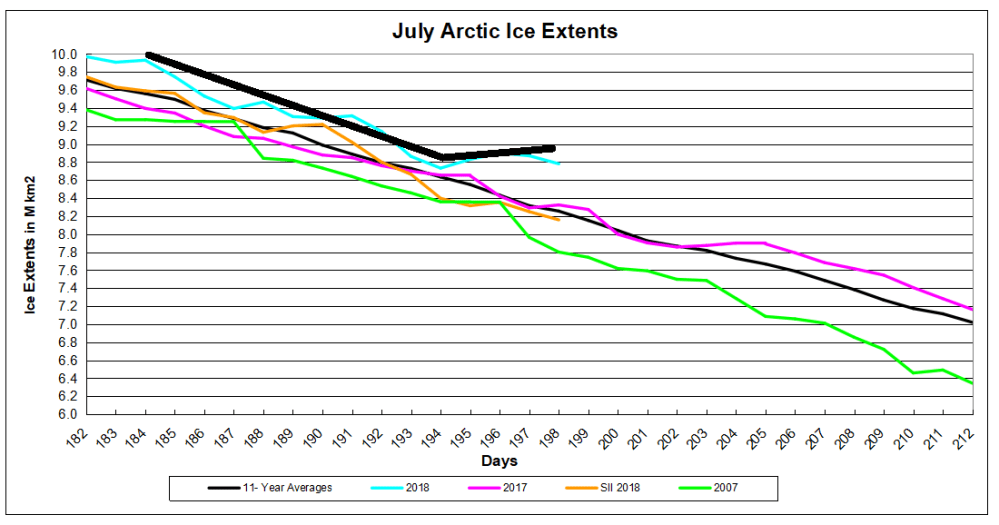
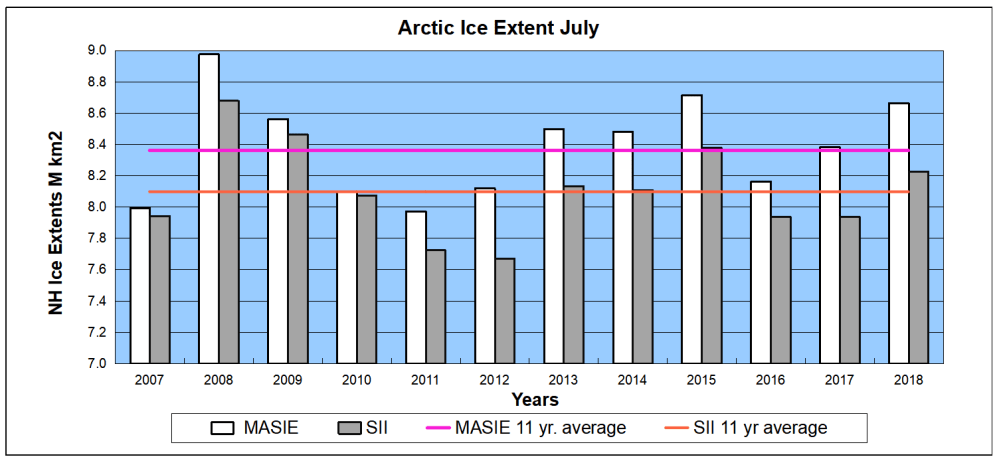
Early in July, a divergence of 2018 surplus ice resembled a hockey stick temporarily.  Though the blade later drooped downward, ice extent remained above average throughout July.  The graph above shows 2018  300k km2 above the 11 year average for July (2007 to 2017 inclusive).  Only 2015 and 2008 had a higher July monthly average extent.  Note that SII (NOAA’s Sea Ice Index) was lower by 436k km2 in 2018, and SII 11 yr. average is lower by 264k km2.

Arctic day 212

The surprise:  This is the first 2018 month above the average.  Indeed March 2018 (annual maximum) was almost 500k km2 lower than March 11 yr. average.  But reduced rates of melting in May, June and July have resulted in more ice extent than most other recent Julys.  At end of July, 2018, 2017 and 11 yr. average are close together, with SII 600k lower and 2007 with 824k km2 less ice.

The table below shows ice extents by regions comparing 2018 with 11-year average (2007 to 2017 inclusive) and 2017.

Region 2018212 Day 212 
Average
2018-Ave. 2007212 2018-2007
 (0) Northern_Hemisphere 7169781 7084113 85668 6344860 824921
 (1) Beaufort_Sea 898821 774345 124476 760576 138246
 (2) Chukchi_Sea 540543 544864 -4320 382350 158193
 (3) East_Siberian_Sea 952130 770306 181824 445385 506745
 (4) Laptev_Sea 338486 448988 -110502 314382 24103
 (5) Kara_Sea 112802 188689 -75888 239232 -126430
 (6) Barents_Sea 525 34556 -34031 23703 -23177
 (7) Greenland_Sea 213399 309333 -95934 324737 -111338
 (8) Baffin_Bay_Gulf_of_St._Lawrence 252017 146604 105413 94179 157838
 (9) Canadian_Archipelago 549236 565183 -15947 510063 39173
 (10) Hudson_Bay 253116 147477 105639 93655 159462
 (11) Central_Arctic 3057671 3151943 -94272 3154837 -97166

2018 is 86k km2 above average (1.2%). Laptev, Kara, Greenland Sea and Central Arctic are down.  Offsetting surpluses are in Beaufort and East Siberian seas, as well as Hudson and Baffin Bays.  Since the two bays will melt out soon, the eventual annual minimum remains to be seen.

Postscript:

Interesting commentary from Dr. Judah Cohen at his July 30, 2018 Arctic Oscillation and Polar Vortex Analysis and Forecasts Excerpts in italics with my bolds.

In the rest of the Impacts section I want to discuss what I wrote in the June 4th blog as it seems to be very relevant for this summer and especially the European summer version of western North America’s winter ridiculously resilient ridge. In the blog I described how a diminishing cryosphere (snow and ice) might be contributing to more persistent and amplified waves in the atmosphere a physical mechanism different from what I typically describe in winter. This mechanism may just be the best explanation of what occurred this summer over Europe. Though probably the precondition of the soil or its desiccation is probably another important contributor to the heat and dry conditions over Northern Europe this summer:

“Over the past several blog posts I have been discussing blocking and ridging over northern Europe with a split Jet Stream across Europe with the polar branch way to the north across northern Scandinavia and a second subtropical branch across the Mediterranean. In between the two Jet Streams has been a sort of no-man’s land with weak zonal winds in the mid-troposphere across much of Central and Northern Europe. This has resulted in a warm spring so far and for the months of April and May, Europe has seen possibly the largest positive temperature departures from normal for the entire Northern Hemisphere (NH).

A warm spring is different than a hot summer and had this atmospheric circulation occurred in July and August instead of April and May it would have created greater news headlines, straining resources and resulting a likely spike in mortality. Europe has been experiencing more frequent hot summers over the past couple of decades with possibly the most infamous being 2003 but even as recently as last summer, when extreme heat accompanied by forest fires were common across Southern Europe. The atmospheric circulation across Europe this spring with blocking and a split Jet Stream is consistent with an idea that Arctic change is resulting in more frequent occurrences of extreme summer weather including flooding, drought and heat waves. This is admittedly not my expertise but I thought it could be interesting to give a brief discussion given the weather pattern across Europe this past spring, which could be laying the groundwork for an overall hot upcoming summer.

In winter the loss of sea ice has contributed to accelerated warming across the Arctic Ocean referred to as Arctic amplification. This is hypothesized by some including me to influence mid-latitude weather either by weakening the zonal Jet Stream or by favoring large scale anomalous atmospheric waves that project onto the climatological waves forced by the geography of the NH. Amplification of the climatological waves leads to a breakdown of the polar vortex followed by increases in severe winter weather across the NH. This is a topic that write about often in my blog posts in the winter months.

Other scientists have postulated something somewhat analogous but also different for the warm season. During the warm boreal months it is much harder for the Arctic Ocean to warm rapidly relative to normal because even with increased ice melt, the ocean remains colder than the overlying atmosphere so energy is transferred from the atmosphere to the ocean rather than vice versa as in winter. Therefore we have not observed in the Arctic Ocean basin the extreme warm events in summer as we do in winter. Instead the rapid disappearance of snow cover in the spring and early summer has allowed the land masses that ring the Arctic Ocean to heat up much more quickly today than they used to two or three decades ago. So the accelerated Arctic warming in summer is not observed over the Ocean but rather across the adjacent land masses of Eurasia and North America.

The accelerated warming to the north can still cause a slackening of the zonal Jet Stream as the south to north temperature gradient weakens. Instead of one Jet Stream across the mid-latitudes, the Jet Stream splits into two pieces one to the north and a second to the south. The northerly Jet forms along and just north of the land regions that are experiencing the most accelerated warming that ring the Arctic approximately along the 70°N latitude, as a the strong warming along the north slope of the continents with a still relatively cold Arctic ocean maintains a strong temperature gradient and a Jet Stream. The southerly Jet Stream forms where the normal south to north temperature gradient resumes across the southern mid-latitudes or in a band between 30-45°N latitude. In between the two Jet Streams the winds are very weak. It turns out this atmospheric configuration with a Jet Stream to the north, a Jet Stream to the south and very weak winds in between is ideal for trapping waves that are persistent in one location and can even amplify. This is referred to as quasi-resonant amplification (QRA). When QRA occurs, atmospheric waves become trapped and persist for much longer periods than normal. This in turns leads to an increased probability of extreme weather whether it be floods, drought or heat waves. The split Jet Stream, the persistent atmospheric waves and extreme weather have all been observed to be increasing over the past two decades. Some early papers on the subject are Petoukhov et al. 2013 and Coumou et al. 2014. The weather models are predicting this latest example of QRA over Europe to dissipate over the coming two weeks but a recurrence of QRA over Europe or a different region this summer is not only of meteorological interest but of societal importance.”

Footnote on MASIE Data Sources:

MASIE reports are based on data primarily from NIC’s Interactive Multisensor Snow and Ice Mapping System (IMS). From the documentation, the multiple sources feeding IMS are:

Platform(s) AQUA, DMSP, DMSP 5D-3/F17, GOES-10, GOES-11, GOES-13, GOES-9, METEOSAT, MSG, MTSAT-1R, MTSAT-2, NOAA-14, NOAA-15, NOAA-16, NOAA-17, NOAA-18, NOAA-N, RADARSAT-2, SUOMI-NPP, TERRA

Sensor(s): AMSU-A, ATMS, AVHRR, GOES I-M IMAGER, MODIS, MTSAT 1R Imager, MTSAT 2 Imager, MVIRI, SAR, SEVIRI, SSM/I, SSMIS, VIIRS

Summary: IMS Daily Northern Hemisphere Snow and Ice Analysis

The National Oceanic and Atmospheric Administration / National Environmental Satellite, Data, and Information Service (NOAA/NESDIS) has an extensive history of monitoring snow and ice coverage.Accurate monitoring of global snow/ice cover is a key component in the study of climate and global change as well as daily weather forecasting.

The Polar and Geostationary Operational Environmental Satellite programs (POES/GOES) operated by NESDIS provide invaluable visible and infrared spectral data in support of these efforts. Clear-sky imagery from both the POES and the GOES sensors show snow/ice boundaries very well; however, the visible and infrared techniques may suffer from persistent cloud cover near the snowline, making observations difficult (Ramsay, 1995). The microwave products (DMSP and AMSR-E) are unobstructed by clouds and thus can be used as another observational platform in most regions. Synthetic Aperture Radar (SAR) imagery also provides all-weather, near daily capacities to discriminate sea and lake ice. With several other derived snow/ice products of varying accuracy, such as those from NCEP and the NWS NOHRSC, it is highly desirable for analysts to be able to interactively compare and contrast the products so that a more accurate composite map can be produced.

The Satellite Analysis Branch (SAB) of NESDIS first began generating Northern Hemisphere Weekly Snow and Ice Cover analysis charts derived from the visible satellite imagery in November, 1966. The spatial and temporal resolutions of the analysis (190 km and 7 days, respectively) remained unchanged for the product’s 33-year lifespan.

As a result of increasing customer needs and expectations, it was decided that an efficient, interactive workstation application should be constructed which would enable SAB to produce snow/ice analyses at a higher resolution and on a daily basis (~25 km / 1024 x 1024 grid and once per day) using a consolidated array of new as well as existing satellite and surface imagery products. The Daily Northern Hemisphere Snow and Ice Cover chart has been produced since February, 1997 by SAB meteorologists on the IMS.

Another large resolution improvement began in early 2004, when improved technology allowed the SAB to begin creation of a daily ~4 km (6144×6144) grid. At this time, both the ~4 km and ~24 km products are available from NSIDC with a slight delay. Near real-time gridded data is available in ASCII format by request.

In March 2008, the product was migrated from SAB to the National Ice Center (NIC) of NESDIS. The production system and methodology was preserved during the migration. Improved access to DMSP, SAR, and modeled data sources is expected as a short-term from the migration, with longer term plans of twice daily production, GRIB2 output format, a Southern Hemisphere analysis, and an expanded suite of integrated snow and ice variable on horizon. Source:  Interactive Multisensor Snow and Ice Mapping System (IMS)
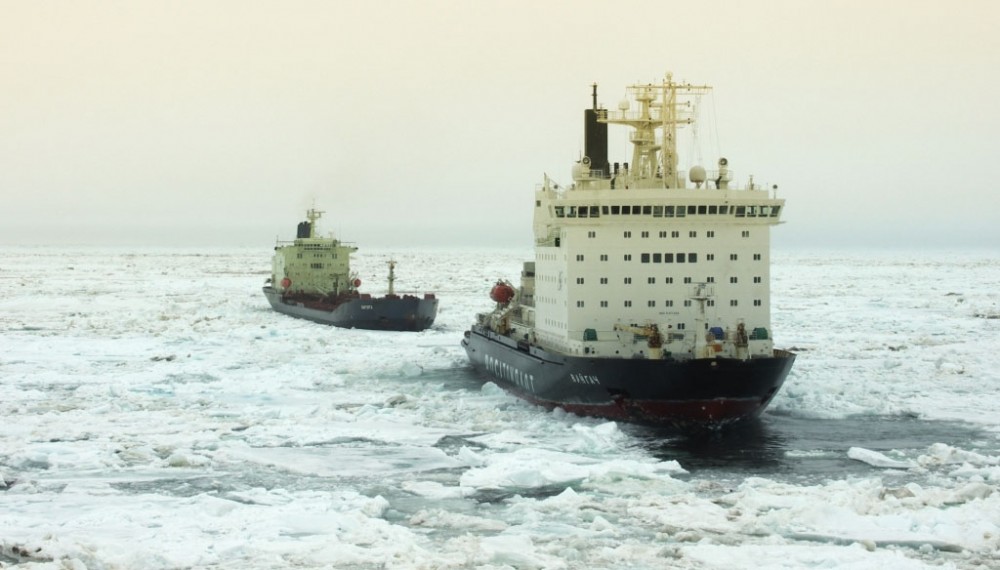


Two Weeks in Kara Sea

Earlier in July, I pointed out Arctic ice extent displaying an “hockey stick” shape due to a surplus of ice compared to the 11 year average decline during this month.  Now we are seeing more typical ice loss approaching the Mid-September annual minimum.  The image above shows how Kara Sea lost more than 300k km2 of ice in the last two weeks, from 428k down to below 100k. That is less ice in Kara than last year, but matching 2015 and 2016 on this day.  On the left you can also see Laptev Sea adding ~200k km2 of open water.

The graph above shows the mid-month “hockey stick” followed by ice extent declining more rapidly, now slightly below last year and slightly above the 11 year average.  The gap over 2007 is still over 800k km2, and MASIE is showing about 500k km2 more than SII (NOAA Sea Ice Extent).  At end of month, there will be a more complete report.


Another Crooked Hockey Stick

Update July 22, 2018

Arctic day 202 hockey

No one knew how long this divergence of surplus ice would persist, but 2018 Arctic ice extent resembled a hockey stick until two days ago.  Through day 200 the gap over 11 year average and 2007 was increasing, but then more than 400k km2 disappeared overnight.  Despite the bent blade, presently the ice is 525k km2 above 11 year average (2007 to 2017 inclusive) and  640k km2 greater than 2007.

Note that 2018 started July well above the 11 year average and other recent years. and remains higher. SII 2018 was tracking close to MASIE last month, but in July SII shows lower extents, a gap of 400k km2 at this point.

ims2022007to2018

The image above shows ice extents on day 202 (July 21) for years 2007, 2012, 2017 and 2018. Note this year ice is strong on both Russian and N. American sides.  Beaufort Sea and Canadian Archipelago show limited water. E. Siberian and Chukchi Seas are also solid, despite early melting in Bering Sea.  Open water has increased in Laptev, Kara and Greenland seas in recent days. Hudson and Baffin bays still have considerable ice compared to other years, but less than a few days ago.

The table below shows ice extents by regions comparing 2018 with 11-year average (2007 to 2017 inclusive) and 2017.

Region 2018202 Day 202 
Average
2018-Ave. 2007202 2018-2007
 (0) Northern_Hemisphere 8142139 7866163 275976 7497932 644207
 (1) Beaufort_Sea 984569 794601 189968 795440 189129
 (2) Chukchi_Sea 603534 592924 10610 471400 132134
 (3) East_Siberian_Sea 1000229 901222 99007 707427 292802
 (4) Laptev_Sea 394293 562570 -168276 447964 -53670
 (5) Kara_Sea 274538 286359 -11822 347266 -72728
 (6) Barents_Sea 8339 47186 -38847 49639 -41300
 (7) Greenland_Sea 224531 375231 -150700 366856 -142325
 (8) Baffin_Bay_Gulf_of_St._Lawrence 382837 221949 160888 275856 106980
 (9) Canadian_Archipelago 677670 664853 12817 672482 5188
 (10) Hudson_Bay 516787 238389 278398 145395 371392
 (11) Central_Arctic 3073623 3178081 -104458 3216865 -143243

2018 is 276k km2 above average (3.5%), mostly due to Hudson and Baffin bays having surplus ice.   Laptev, Greenland Sea and Central Arctic are down, more than offset by surpluses elsewhere, especially Beaufort and East Siberian seas.  Since the two bays will melt out soon, the eventual annual minimum remains to be seen.

Footnote:

Most readers know of the Mann-made Crooked Hockey Stick, which duped IPCC and Al Gore for awhile.  That story is told in the post Rise and Fall of the Modern Warming Spike


Arctic Hockey Stick Extends Lead

Update July 20, 2018

Arctic day 200 hockey

No one knows how long this divergence of surplus ice will persist, but for now 2018 Arctic ice extent resembles a hockey stick.  OK, the blade angle is drooping, but the gap over previous years is increasing.  At day 200 ice extent this year is 572k km2 above 11 year average (2007 to 2017 inclusive), an addition of ~50k km2 in the last  two days.  2018 solidified its lead of 1M km2 greater than 2007.  The gap over 2007 has more than doubled in the past five days.  More detailed report from July 14 below.

ims1952007to2018

In June 2018, Arctic ice extent held up against previous years despite the Pacific basins of Bering and Okhotsk being ice-free.  The Arctic core is showing little change, perhaps due to increased thickness (volume) as reported by DMI.

The image above shows ice extents on day 195 (July 14) for years 2007, 2012, 2017 and 2018. Note this year ice is strong on both Russian and N. American sides.  Beaufort Sea and Canadian Archipelago are solid. E. Siberian and Chukchi Seas are also solid, despite early melting in Bering Sea.  Hudson and Baffin bays still have considerable ice compared to other years.

The graph below shows how the Arctic extent has faired in July compared to the 11 year average and to some years of interest.
Arctic day 195
Note that 2018 started July well above the 11 year average and other recent years.  As of day 195 (yesterday) ice extent is still greater than average and the years 2007 and 2017.  SII 2018 is tracking well below MASIE this month, a gap of 500k km2 at this point.

The table below shows ice extents by regions comparing 2018 with 11-year average (2007 to 2017 inclusive) and 2017.

Region 2018195 Day 195 
Average
2018-Ave. 2007195 2018-2007
 (0) Northern_Hemisphere 8828959 8549517 279442 8355280 473679
 (1) Beaufort_Sea 993219 826109 167110 845973 147246
 (2) Chukchi_Sea 644989 636401 8588 576079 68911
 (3) East_Siberian_Sea 1024284 950636 73648 788128 236156
 (4) Laptev_Sea 492172 633149 -140977 575520 -83347
 (5) Kara_Sea 438240 399007 39233 483785 -45545
 (6) Barents_Sea 30629 64124 -33495 75731 -45101
 (7) Greenland_Sea 285428 443318 -157890 472890 -187462
 (8) Baffin_Bay_Gulf_of_St._Lawrence 489193 305230 183963 343396 145797
 (9) Canadian_Archipelago 747737 719112 28626 730629 17109
 (10) Hudson_Bay 619471 381783 237688 248785 370686
 (11) Central_Arctic 3062425 3185383 -122959 3211275 -148850

2018 is 280k km2 above average, mostly due to Hudson and Baffin bays having surplus ice.   Laptev, Greenland Sea and Central Arctic are down, more than offset by surpluses elsewhere.  Since the two bays will melt out soon, the eventual annual minimum remains to be seen.


Arctic Ice Hockey Stick

Update July 18, 2018

Arctic day 198 hockey

No one knows how long this divergence of surplus ice will persist, but for now 2018 Arctic ice extent resembles a hockey stick.  Presently the ice is 525k km2 above 11 year average (2007 to 2017 inclusive) and  ~1M km2 greater than 2007.  More detailed report from July 14 below.

ims1952007to2018

In June 2018, Arctic ice extent held up against previous years despite the Pacific basins of Bering and Okhotsk being ice-free.  The Arctic core is showing little change, perhaps due to increased thickness (volume) as reported by DMI.

The image above shows ice extents on day 195 (July 14) for years 2007, 2012, 2017 and 2018. Note this year ice is strong on both Russian and N. American sides.  Beaufort Sea and Canadian Archipelago are solid. E. Siberian and Chukchi Seas are also solid, despite early melting in Bering Sea.  Hudson and Baffin bays still have considerable ice compared to other years.

The graph below shows how the Arctic extent has faired in July compared to the 11 year average and to some years of interest.
Arctic day 195
Note that 2018 started July well above the 11 year average and other recent years.  As of day 195 (yesterday) ice extent is still greater than average and the years 2007 and 2017.  SII 2018 is tracking well below MASIE this month, a gap of 500k km2 at this point.

The table below shows ice extents by regions comparing 2018 with 11-year average (2007 to 2017 inclusive) and 2017.

Region 2018195 Day 195 
Average
2018-Ave. 2007195 2018-2007
 (0) Northern_Hemisphere 8828959 8549517 279442 8355280 473679
 (1) Beaufort_Sea 993219 826109 167110 845973 147246
 (2) Chukchi_Sea 644989 636401 8588 576079 68911
 (3) East_Siberian_Sea 1024284 950636 73648 788128 236156
 (4) Laptev_Sea 492172 633149 -140977 575520 -83347
 (5) Kara_Sea 438240 399007 39233 483785 -45545
 (6) Barents_Sea 30629 64124 -33495 75731 -45101
 (7) Greenland_Sea 285428 443318 -157890 472890 -187462
 (8) Baffin_Bay_Gulf_of_St._Lawrence 489193 305230 183963 343396 145797
 (9) Canadian_Archipelago 747737 719112 28626 730629 17109
 (10) Hudson_Bay 619471 381783 237688 248785 370686
 (11) Central_Arctic 3062425 3185383 -122959 3211275 -148850

2018 is 280k km2 above average, mostly due to Hudson and Baffin bays having surplus ice.   Laptev, Greenland Sea and Central Arctic are down, more than offset by surpluses elsewhere.  Since the two bays will melt out soon, the eventual annual minimum remains to be seen.


Arctic Ice Beats Odds July 14

ims1952007to2018

In June 2018, Arctic ice extent held up against previous years despite the Pacific basins of Bering and Okhotsk being ice-free.  The Arctic core is showing little change, perhaps due to increased thickness (volume) as reported by DMI.

The image above shows ice extents on day 195 (July 14) for years 2007, 2012, 2017 and 2018. Note this year ice is strong on both Russian and N. American sides.  Beaufort Sea and Canadian Archipelago are solid. E. Siberian and Chukchi Seas are also solid, despite early melting in Bering Sea.  Hudson and Baffin bays still have considerable ice compared to other years.

The graph below shows how the Arctic extent has faired in July compared to the 11 year average and to some years of interest.
Arctic day 195
Note that 2018 started July well above the 11 year average and other recent years.  As of day 195 (yesterday) ice extent is still greater than average and the years 2007 and 2017.  SII 2018 is tracking well below MASIE this month, a gap of 500k km2 at this point.

The table below shows ice extents by regions comparing 2018 with 11-year average (2007 to 2017 inclusive) and 2017.

Region 2018195 Day 195 
Average
2018-Ave. 2007195 2018-2007
 (0) Northern_Hemisphere 8828959 8549517 279442 8355280 473679
 (1) Beaufort_Sea 993219 826109 167110 845973 147246
 (2) Chukchi_Sea 644989 636401 8588 576079 68911
 (3) East_Siberian_Sea 1024284 950636 73648 788128 236156
 (4) Laptev_Sea 492172 633149 -140977 575520 -83347
 (5) Kara_Sea 438240 399007 39233 483785 -45545
 (6) Barents_Sea 30629 64124 -33495 75731 -45101
 (7) Greenland_Sea 285428 443318 -157890 472890 -187462
 (8) Baffin_Bay_Gulf_of_St._Lawrence 489193 305230 183963 343396 145797
 (9) Canadian_Archipelago 747737 719112 28626 730629 17109
 (10) Hudson_Bay 619471 381783 237688 248785 370686
 (11) Central_Arctic 3062425 3185383 -122959 3211275 -148850

2018 is 280k km2 above average, mostly due to Hudson and Baffin bays having surplus ice.   Laptev, Greenland Sea and Central Arctic are down, more than offset by surpluses elsewhere.  Since the two bays will melt out soon, the eventual annual minimum remains to be seen.


Arctic Ice Persisting in July

AARI072008to2018

In June 2018, Arctic ice extent held up against previous years despite the Pacific basins of Bering and Okhotsk being ice-free.  Now in July when ice extent typically declines, 2018 extents were flat, and now declining slowly.  The Arctic core is showing little change, perhaps due to increased thickness (volume) as reported by DMI.  The image above from AARI shows ice extents first week of July for years 2008 through 2018. (Image format was different for previous years.  In 2018, water is showing typically in Chukchi in July, a bit more than usual in Laptev and less in Beaufort.

The graph below shows how the Arctic extent has faired from mid June to July 7 (yesterday) compared to the 11 year average and to some years of interest.
Arctic day 188Note that 2018  was on average and comparable to other years from Mid June on.  Then recently ice extents have held steady just below 10M km2, while averages and other years declined.  2018 is now 288k km2 above the 11 year average,  400k km2 higher than 2017, and 624k km2 greater than 2007 at this date.   SII 2018 was tracking the same as MASIE in June but is now showing 335k km2 lower.

The table below shows ice extents by regions comparing 2018 with 11-year average (2007 to 2017 inclusive) and 2017 as of day 179.

Region 2018188 Day 179 
Average
2018-Ave. 2007188 2018-2007
 (0) Northern_Hemisphere 9465018 9181173 283844 8841116 623902
 (1) Beaufort_Sea 977561 863028 114533 871601 105960
 (2) Chukchi_Sea 635350 682991 -47641 622583 12767
 (3) East_Siberian_Sea 1037340 996766 40574 855273 182067
 (4) Laptev_Sea 545304 684244 -138941 644539 -99236
 (5) Kara_Sea 568399 477164 91236 523575 44824
 (6) Barents_Sea 54547 88754 -34206 91567 -37020
 (7) Greenland_Sea 353292 477433 -124141 506546 -153254
 (8) Baffin_Bay_Gulf_of_St._Lawrence 592755 393419 199336 411743 181013
 (9) Canadian_Archipelago 778940 756496 22444 752103 26837
 (10) Hudson_Bay 791754 543956 247798 354253 437502
 (11) Central_Arctic 3128568 3203921 -75353 3202400 -73832

2018 is above the 11 year average,  with BCE (Beaufort, Chukchi, East Siberian) higher, Laptev and Kara offsetting.  Barents and Greenland Sea are down, but Baffin and Hudson Bays have larger surpluses.

Footnote: 

Arctic extents are shaped by the three Ws: Water, Wind and Weather.  This video shows how a massive cyclone in 2012 broke up the ice, moved it around and flushed much of it out through the Fram strait.The ice has recovered since then and is now quite thick.


Arctic Ice Resilient in July

IMSSandIce07to18day179

In June 2018, Arctic ice extent held up against previous years despite the Pacific basins of Bering and Okhotsk being ice-free.  Now in July when ice extent typically declines, 2018 extents are essentially flat.  The Arctic core is showing little change, perhaps due to increased thickness (volume) as reported by DMI.  The image above shows ice extents on day 179 for years 2007 through 2018.

The graph below shows how the Arctic extent has faired from mid June to July 3 (yesterday) compared to the 11 year average and to some years of interest.
NH arctic ice day 184Note that 2018  was on average and comparable to other years from Mid June on.  Then recently ice extents have held steady just below 10M km2, while averages and other years declined.  2018 is now 370k km2 above the 11 year average,  535k km2 higher than 2017, and 660k km2 greater than 2007 at this date.   SII 2018 was tracking the same as MASIE in June but has now dropped 360k km2 lower.

The table below shows ice extents by regions comparing 2018 with 11-year average (2007 to 2017 inclusive) and 2017 as of day 179.

Region 2018179 Day 179
Average
2018-Ave. 2007179 2018-2007
 (0) Northern_Hemisphere 10029935 10054734 -24798 10034293 -4358
 (1) Beaufort_Sea 1015808 919074 96734 948463 67345
 (2) Chukchi_Sea 711178 732616 -21437 680534 30645
 (3) East_Siberian_Sea 1053171 1032249 20923 963850 89321
 (4) Laptev_Sea 647574 745700 -98126 663276 -15702
 (5) Kara_Sea 726226 598140 128086 665920 60307
 (6) Barents_Sea 60948 134229 -73281 177419 -116471
 (7) Greenland_Sea 356614 552157 -195543 627602 -270989
 (8) Baffin_Bay_Gulf_of_St._Lawrence 714402 552083 162319 531706 182696
 (9) Canadian_Archipelago 794355 783057 11298 775033 19322
 (10) Hudson_Bay 900609 761919 138690 777550 123058
 (11) Central_Arctic 3047677 3217803 -170125 3216654 -168977
 (12) Bering_Sea 185 6350 -6165 1080 -895
 (13) Baltic_Sea 0 4 -4 0 0
 (14) Sea_of_Okhotsk 0 17972 -17972 3531 -3531

2018 is 25k km2 below average, entirely due to Okhotsk plus Bering being ice-free.  Greenland Sea and Barents are down, offset by surpluses in Beaufort, Kara, Baffin and Hudson Bays.

Footnote: 

Arctic extents are shaped by the three Ws: Water, Wind and Weather.  This video shows how a massive cyclone in 2012 broke up the ice, moved it around and flushed much of it out through the Fram strait.The ice has recovered since then and is now quite thick.


Arctic Ice Holding Up June 29

IMSSandIce07to18day179

In June 2018, Arctic ice extent held up against previous years despite the Pacific basins of Bering and Okhotsk being ice-free.  The Arctic core is showing little change, perhaps due to increased thickness (volume) as reported by DMI.  The image above shows ice extents on day 179 for years 2007 through 2018.

The graph below shows how the Arctic extent has faired in June compared to the 11 year average and to some years of interest.
NHday179Note that 2018 started June well below the 11 year average and below other recent years.  As of day 179 (yesterday) ice extent is matching average and 2007, and slightly above 2017, with further losses to come in previous years.  SII 2018 is tracking the same as MASIE this month.

The table below shows ice extents by regions comparing 2018 with 11-year average (2007 to 2017 inclusive) and 2017.

Region 2018179 Day 179
Average
2018-Ave. 2007179 2018-2007
 (0) Northern_Hemisphere 10029935 10054734 -24798 10034293 -4358
 (1) Beaufort_Sea 1015808 919074 96734 948463 67345
 (2) Chukchi_Sea 711178 732616 -21437 680534 30645
 (3) East_Siberian_Sea 1053171 1032249 20923 963850 89321
 (4) Laptev_Sea 647574 745700 -98126 663276 -15702
 (5) Kara_Sea 726226 598140 128086 665920 60307
 (6) Barents_Sea 60948 134229 -73281 177419 -116471
 (7) Greenland_Sea 356614 552157 -195543 627602 -270989
 (8) Baffin_Bay_Gulf_of_St._Lawrence 714402 552083 162319 531706 182696
 (9) Canadian_Archipelago 794355 783057 11298 775033 19322
 (10) Hudson_Bay 900609 761919 138690 777550 123058
 (11) Central_Arctic 3047677 3217803 -170125 3216654 -168977
 (12) Bering_Sea 185 6350 -6165 1080 -895
 (13) Baltic_Sea 0 4 -4 0 0
 (14) Sea_of_Okhotsk 0 17972 -17972 3531 -3531

2018 is 25k km2 below average, entirely due to Okhotsk plus Bering being ice-free.  Greenland Sea and Barents are down, offset by surpluses in Beaufort, Kara, Baffin and Hudson Bays.


Persistent Arctic Ice Mid June

cice_combine_thick_sm_en_20180614
In June, ice extents are declining as usual, except for the early melting in Bering and Okhotsk Seas.  The image above from DMI shows widespread thick ice across the Arctic core, likely to melt more slowly.  The graph above shows how much volume was added since March 2018, bringing it close to 2014, a particularly icy year.

The graph below shows how the Arctic extent from MASIE has faired the first two weeks of June up to yesterday, compared to the 11 year average and to some years of interest.
MASIE2018165
Note that 2018 is now matching the 11-year average, as well as 2017 and 2007.  SII 2018 is tracking MASIE 2018 closely.

The table shows regional ice extents compared to average and 2007.

Region 2018165 Day 165
Average
2018-Ave. 2007165 2018-2007
 (0) Northern_Hemisphere 10915601 10987296 -71695 10959202 -43601
 (1) Beaufort_Sea 1029988 964246 65742 952869 77119
 (2) Chukchi_Sea 756185 803037 -46852 770182 -13997
 (3) East_Siberian_Sea 1067948 1051979 15968 1040890 27058
 (4) Laptev_Sea 722052 786204 -64152 755629 -33577
 (5) Kara_Sea 870277 716595 153682 770755 99522
 (6) Barents_Sea 201802 222598 -20796 264253 -62451
 (7) Greenland_Sea 444260 578046 -133786 574726 -130465
 (8) Baffin_Bay_Gulf_of_St._Lawrence 763976 741257 22719 778469 -14493
 (9) Canadian_Archipelago 808464 798083 10381 781578 26886
 (10) Hudson_Bay 1063014 1014784 48230 997061 65953
 (11) Central_Arctic 3165771 3224235 -58464 3224700 -58929
 (12) Bering_Sea 8803 42373 -33570 15285 -6482
 (13) Baltic_Sea 0 7 -7 0 0
 (14) Sea_of_Okhotsk 11757 42495 -30738 31131 -19373

Note that Bering and Okhotsk account for the 2018 deficit to average.  Chukchi, Laptev and Greenland Seas are down somewhat, but offset by surpluses in Kara Sea, Beaufort Sea and Hudson Bay. The differences from 2007 are similar.

The Pacific basins of Bering and Okhotsk are the first to lose ice, and it will be interesting to see how the core Arctic Seas holds up this summer.  Chukchi is down, perhaps influenced by the early melting in Bering, but is offset by surpluses in Beaufort and East Siberian.