Earlier in July, I pointed out Arctic ice extent displaying an “hockey stick” shape due to a surplus of ice compared to the 11 year average decline during this month. Now we are seeing more typical ice loss approaching the Mid-September annual minimum. The image above shows how Kara Sea lost more than 300k km2 of ice in the last two weeks, from 428k down to below 100k. That is less ice in Kara than last year, but matching 2015 and 2016 on this day. On the left you can also see Laptev Sea adding ~200k km2 of open water.
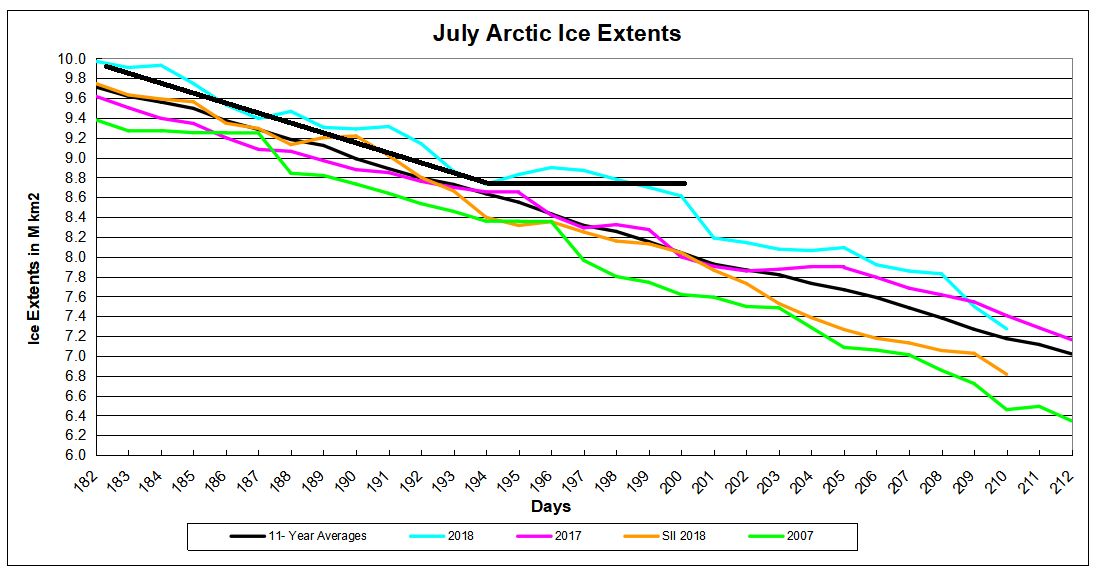
The graph above shows the mid-month “hockey stick” followed by ice extent declining more rapidly, now slightly below last year and slightly above the 11 year average. The gap over 2007 is still over 800k km2, and MASIE is showing about 500k km2 more than SII (NOAA Sea Ice Extent). At end of month, there will be a more complete report.

There’s talk of a high reforming over the UK so the melt rate may drop again. We had our (much welcome) low with rain and cool but correspondingly the Arctic got a warm pulse. Unfortunately there is a lot of heat in Europe to waft about. It could do a lot of damage to the ice in a short space of time.
LikeLike