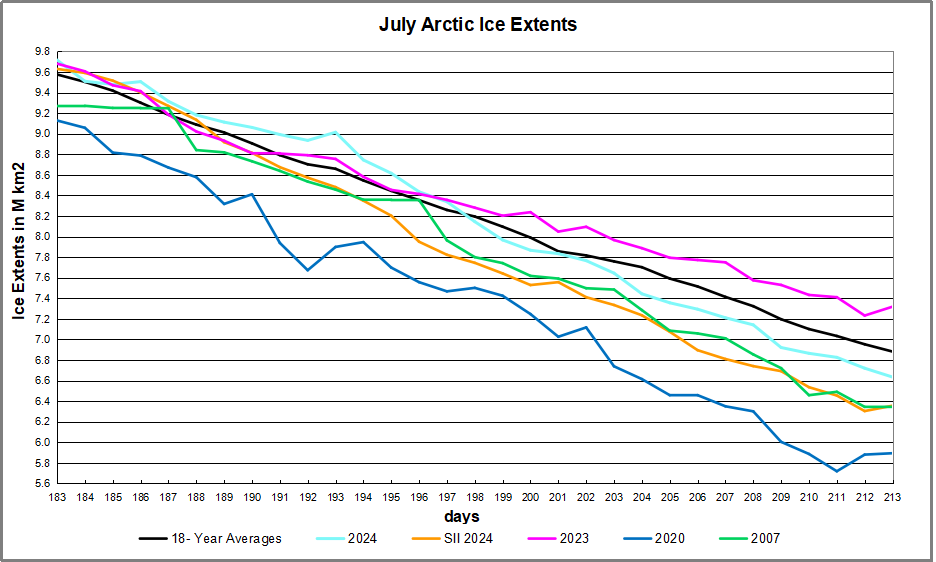
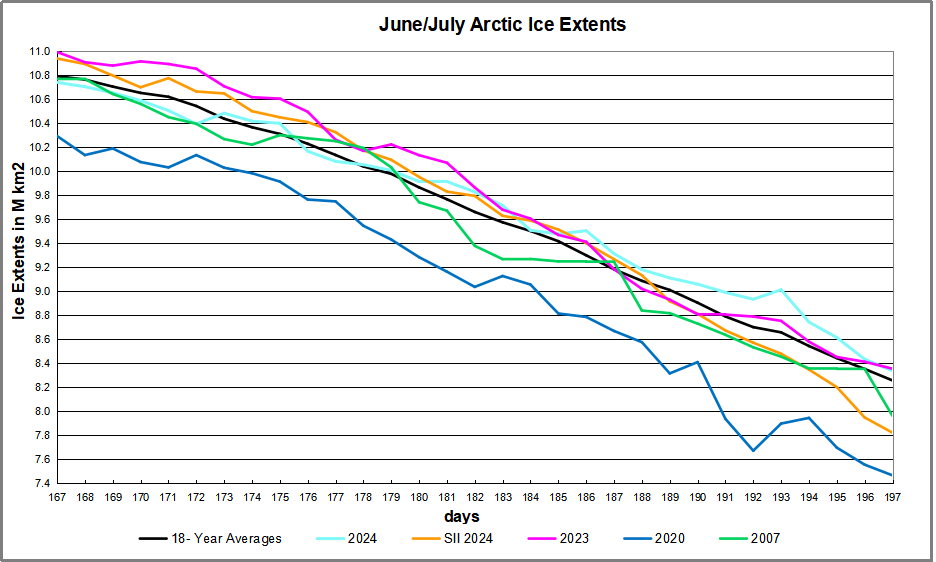
2024 Arctic Ice Beats 2007 by Half a Wadham
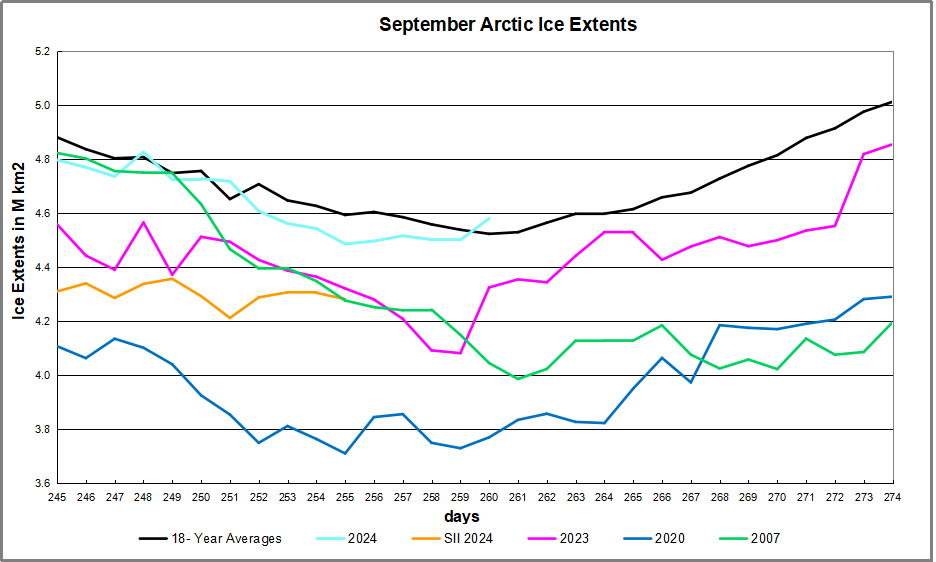
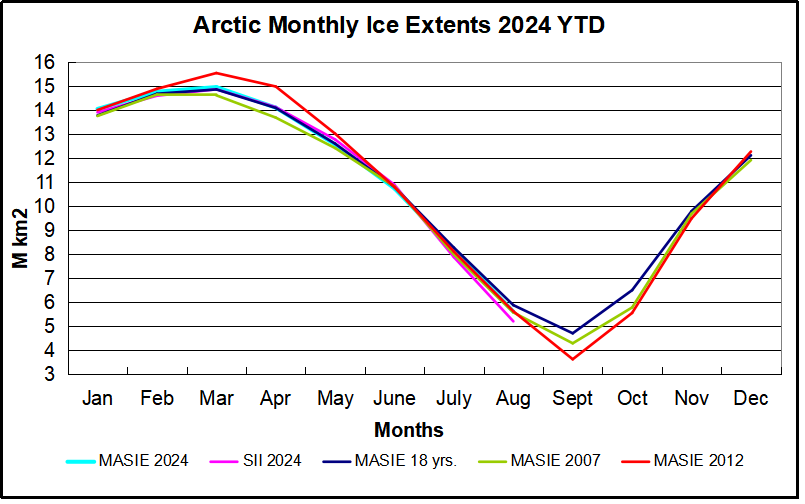
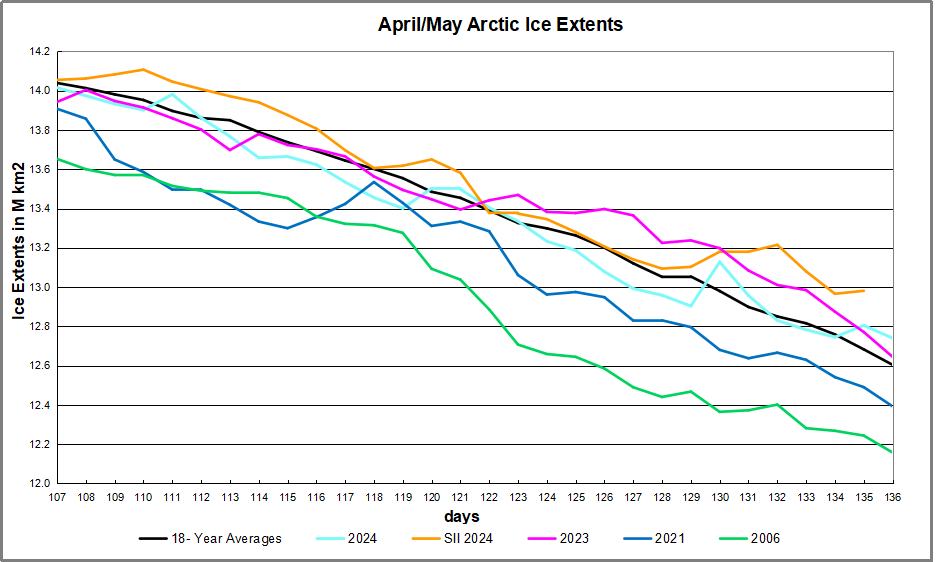
The graph above shows September daily ice extents for 2024 compared to 18 year averages, and some years of note. Day 260 has been the lowest daily ice extent on average for the last 18 years.
The black line shows on average Arctic ice extents during September decline 358k km2 down to 4.5M Km2 by day 260. The average increase from now on is 490k km2 up to 5.0M km2 end of September. 2024 tracked a little lower than the 18-year average in the second week reaching a low of 4.49M km2 on day 255, before going above average on day 260.
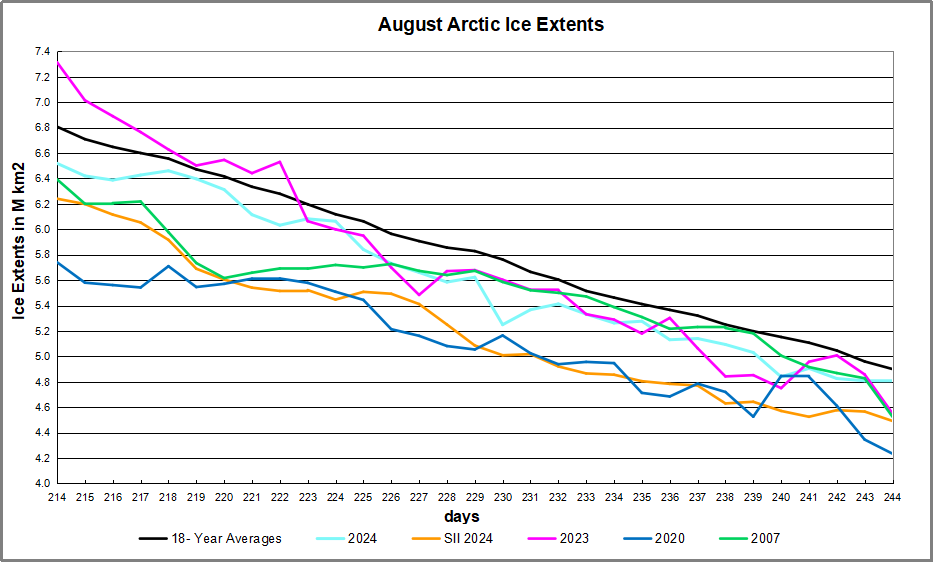
SII was reporting deficits as high as 0.5M km2 (half a Wadham) compared to MASIE early in September. For some reason, that dataset has not been updated for the last five days. 2023 bottomed out at 4.1M while 2007 daily minimum hit 4.0M, ended ~ 0.5M km2 in deficit to average and 535k km2 less than MASIE on day 260. 2020 ice on day 260 was ~740k km2 in deficit to average.
Why is this important? All the claims of global climate emergency depend on dangerously higher temperatures, lower sea ice, and rising sea levels. The lack of additional warming prior to 2023 El Nino is documented in a post UAH June 2024: Oceans Lead Cool Down.
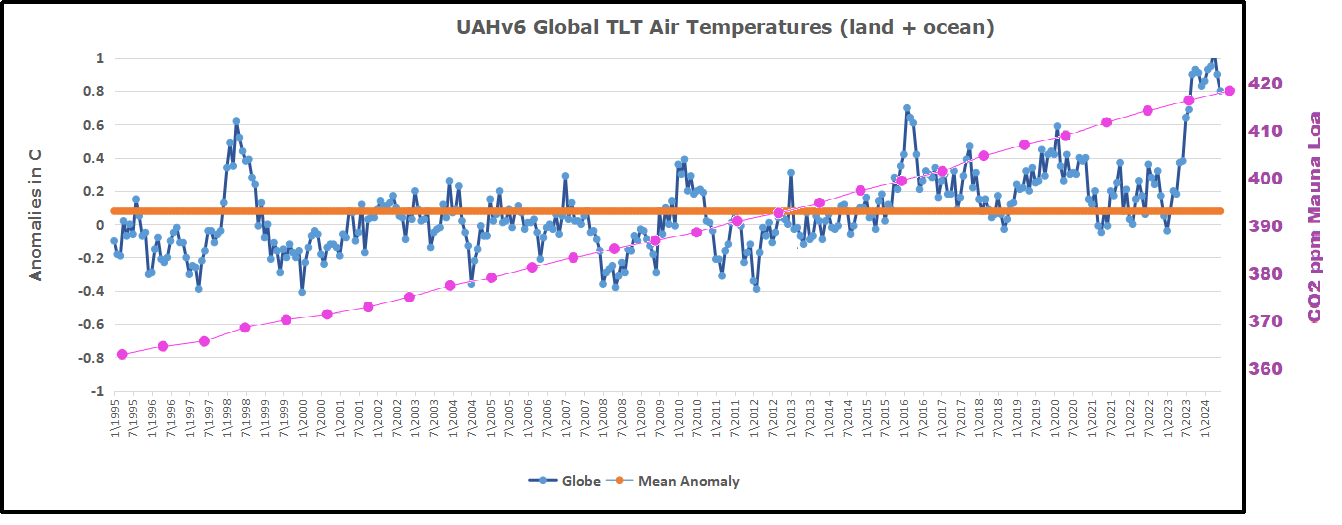
The lack of acceleration in sea levels along coastlines has been discussed also. See Observed vs. Imagined Sea Levels 2023 Update.
Also, a longer term perspective is informative:
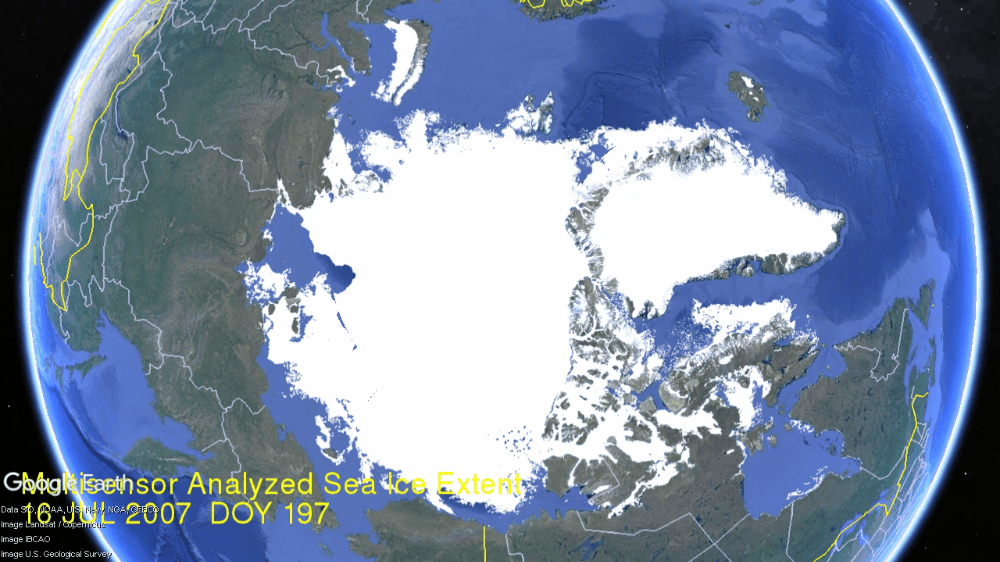
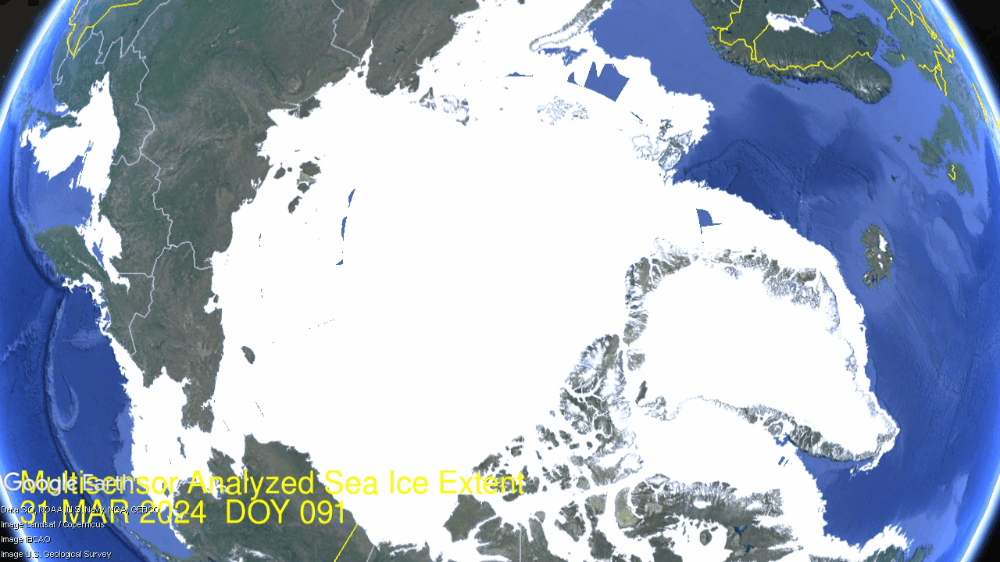
 The table below shows the distribution of Sea Ice on day 260 across the Arctic Regions, on average, this year and 2007. At this point in the year, Bering and Okhotsk seas are open water and thus dropped from the table.
| Region | 2024260 | Day 260 ave | 2024-Ave. | 2007260 | 2024-2007 |
| (0) Northern_Hemisphere | 4581327 | 4524401 | 56926 | 4045776 | 535551 |
| (1) Beaufort_Sea | 304967 | 491931 | -186963 | 481384 | -176416 |
| (2) Chukchi_Sea | 360456 | 167361 | 193095 | 22527 | 337929 |
| (3) East_Siberian_Sea | 353456 | 252958 | 100498 | 311 | 353145 |
| (4) Laptev_Sea | 160792 | 135574 | 25218 | 235869 | -75076 |
| (5) Kara_Sea | 0 | 31612 | -31612 | 44067 | -44067 |
| (6) Barents_Sea | 0 | 14610 | -14610 | 7420 | -7420 |
| (7) Greenland_Sea | 165965 | 191196 | -25230 | 333181 | -167216 |
| (8) Baffin_Bay_Gulf_of_St._Lawrence | 53126 | 29745 | 23381 | 26703 | 26423 |
| (9) Canadian_Archipelago | 228869 | 274428 | -45559 | 225526 | 3344 |
| (10) Hudson_Bay | 1692 | 4595 | -2903 | 2270 | -578 |
| (11) Central_Arctic | 2950861 | 2929452 | 21409 | 2665243.87 | 285617 |
The overall surplus to average is 57k km2, (1.3%). The major deficit is in Beaufort, offset by large surpluses in Chukchi and East Siberian seas.


Illustration by Eleanor Lutz shows Earth’s seasonal climate changes. If played in full screen, the four corners present views from top, bottom and sides. It is a visual representation of scientific datasets measuring ice and snow extents.

There is no charge for content on this site, nor for subscribers to receive email notifications of postings.