Unsettled Science: How Sun’s Fluxes Affect Our Climate

John Green writes at American Thinker Why are we studying the sun, if the science is settled? Excerpts in italics with my bolds and added images.

NASA’s Parker solar probe just completed one of its primary multi-year mission objectives, with the closest ever approach to the Sun. On Christmas Eve, the probe flew through the Sun’s corona at a blistering (literally and figuratively) 430,000 mph. For aircraft buffs, that’s Mach 560 — fast enough to circle the earth in about 3 minutes!

NASA’s Closest Approach to the Sun’s Fiery Surface Achieved by Parker Probe

A faint signal from Parker indicates that it survived its scorching flyby, and scientists are expecting it to download a treasure trove of data later this month. It turns out there’s a lot the guys with the PhDs don’t understand about the sun. As NASA states:

The NASA Parker Solar Probe mission is a mission designed to help humanity better understand the Sun, where changing conditions can propagate out into the solar system, affecting Earth and other worlds. As such, the primary goals are to examine the acceleration of solar wind through the movement of heat and energy in the Sun’s corona in addition to study solar energetic particles.

They’re hoping data collected while flying through the Sun’s corona will provide a few answers and make it a bit more predictable.

I confess I’m just a lowly engineer, and many of the mysteries they’re trying to unravel are well beyond my college physics courses. But reading about the Parker probe got me wondering: Doesn’t the Sun have something to do with our weather? I mean it’s warm on sunny days, and plants grow better when the earth’s surface is the closest to the Sun.

Those observations may sound obtuse, but they’re no more obtuse than “experts” saying that “climate science is settled” — when they don’t understand how the freaking Sun works! (Looking at you “Science Guy” Bill Nye.)

The science can only be settled when the smart guys understand all the factors that affect our climate — and how they interact — well enough to predict outcomes. The Sun imparts about 342 watts of energy on every square meter of the earth’s surface (according to NASA). That’s the equivalent of 44 million average electric power plants (700 times what the world has) — yet we don’t understand its fluctuations.

That’s a rather big unpredictable factor for this supposedly “settled science” — no?

One can only conclude that when highly educated people — who should know better — claim climate science is settled, they’re lying. Perhaps that’s why multiple predictions that the polar bears would be extinct and New York would be underwater by now have all been wrong. It might also explain why the greenies avoid discussion of ice ages and interglacial periods when assuring us that our cars are delivering planetary doom – while their private jets are perfectly fine.

Given what little we know about the Sun, the anthropogenic climate change “experts” are either:

  • Ignorant men, succumbing to irrational fears — placing superstition above science, or
  • Evil men — profiting by scaring us into irrational behavior.

We should keep that in mind when they insist that we halt progress, live in destitution, and scare our children that apocalypse is imminent. Our only rational response is to ignore them … and cut off their funding.

Yes, IPCC, Our Climate Responds to Our Sun

John Gideon Hartnett writes at Spectator Australia The sun is in control of our oceans. Text is from John Ray at his blog, excerpts in italics with my bolds and added images.

In recent years, there has been observed an increase in ocean temperature. Those who adhere to the Climate Change version of events say that the oceans are getting warmer because of trapped carbon dioxide (CO2) in the atmosphere causing a massive greenhouse effect leading to boiling oceans.

Well, anyone who has a brain knows that the oceans are not boiling, but let’s assume that is just hyperbole. When actual research – when actual measurements were taken – reality turns out to be the exact opposite.

New research shows that the temperature of our oceans are controlled by incident radiation from the Sun. Who would have guessed?

And as a consequence of the oceans warming, dissolved carbon dioxide gas is released due to reduced is solubility in ocean water. This means the warming of the oceans would lead (or cause) an increase in CO2 concentration in the atmosphere.  One of the researchers in the study wrote on X.com:

A decrease in cloud cover and albedo means more short wavelength (SW) solar radiation reaches the oceans. Albedo is the reflectivity of the Earth. Lower albedo means more sunlight reaching the land and oceans and more warming by the Sun.

Figure 8. Comparison between observed global temperature anomalies and CERES-reported changes in the Earth’s absorbed solar flux. The two data series representing 13-month running means are highly correlated with the absorbed SW flux explaining 78% of the temperature variation (R2 = 0.78). The global temperature lags the absorbed solar radiation between 0 and 9 months, which indicates that climate change in the 21st Century was driven by solar forcing.

I mean to say that this is so obvious. The Sun heats Earth’s surface of which 71% is covered by the oceans! Basic physics!

The energy from the Sun powers all life on the planet and causes all Earth changes. Every second, the Earth receives the equivalent energy of 42 megatons of TNT in radiation from the Sun. That cannot be ignored. 

Climate Change, the ideological movement which I prefer to call a cult, views all evidence through the lens of their religious belief that the Earth is warmed by human activity. That activity releases carbon dioxide gas, which has been observed to be increasing. Their belief is that CO2 traps heat in a giant greenhouse effect. That is the dogma anyway. And I must add, we all are the carbon they want to eliminate.

But how much of that observed increase in CO2 is actually from natural causes and not from human activity? At least 94 per cent is. This new evidence now suggests it could be even more than that.

If the oceans emit CO2 gas following changes in the water temperature, which this research shows is due to the amount (flux) of solar radiation reaching the surface, then more CO2 comes from natural causes.

It is basic physics that as you heat water the dissolved gases are released due to a decrease in gas solubility. This means as the solar flux increases CO2 gas is released from the warmer ocean water.

Thus an ocean temperature increase leads to an increase in CO2 in the atmosphere, and not the other way around.

Space weather impacts the ionosphere in this animation. Credits: NASA/GSFC/CIL/Krystofer Kim

Holes in IPCC Science Revealed

Graeme Weber reports from Australia on the history revealing multiple holes in IPCC claimed “settled science.” His paper is  IPCC – Miss/Diss information? shared with me by email.  Graeme is an earth scientist, retired consulting geologist and advocate for nuclear energy. His text is in italics with my bolds and added images.

Several years ago, the cry from the IPCC (International Panel on Climate Change) was ‘the science is settled’. This should have been a ‘red flag’ to any scientists who know that science is never settled. This is especially so in such a complex system, as Mother Earth’s climate. It is now 32 years since the first IPCC Report was issued. Many claims in this and later IPCC reports have since been debunked especially the ‘Hockey Stick’ graph of Mann, Bradley and Hughes (1999) where Mann was finally taken to court to reveal his calculations that subsequently led to him losing a court case and the IPCC getting embarrassed, as monumental errors and manipulation of data was exposed.

Professor Tim Ball, who was sued by Michael Mann for defamation regarding comments he made about the integrity of the Hockey Stick Graph, succeeded in having the case thrown out and Mann ordered to pay costs. Mann had failed to comply with a court order that he produce his Hockey Stick Data! Supreme Court of British Columbia 2019

Another erroneous claim by the IPCC was that 97% of Scientists believed in Global Warming. How did they make this claim? It was based on a study  in the Proceedings of the National Academy of Sciences of the United States of America (2010) who reviewed publication and citation data for 1,372 climate researchers, 908 of whom had authored 20 or more publications on climate, and found that 97–98% of the climate researchers (the 908) most actively publishing in the field support the tenets of ACC (Anthropogenic Climate Change) outlined by the IPCC, and the relative climate expertise and scientific prominence of the researchers unconvinced of ACC are substantially below that of the convinced researchers. Well, how strange people who research in this field and rely on financial support believe in Global Warming!

A Consensus You Can Trust!

Another study by Dr Soon and Dr Michael Connolly and His son Dr. Ronan Connolly released in 2023 was on Rural and Urban temperature records in the Northern Hemisphere. This study is similar to articles reported by JoNova and Jennifer Marohasy in Australia on temperature measurement equipment and stations in Australia with encroaching buildings, air conditioners, changes to recording gear and BOM changing temperature records by outright manipulation and homogenisation. The most obvious one is changing from reading manually by a person at a set time each day to continuous recording machines every minute or so, so increasing the likelihood of higher daily temperatures. In many cases BOM (Australian Bureau of Meteorology) claimed significant warming trends by starting at a cool point rather than a warm point.

The BOM never mentions the extreme temperatures recorded throughout Australia in January 1896 nor the elevated temperature during the 1930’s decade culminating in 1939 Black Friday. In the days preceding these fires, the Victorian state capital, Melbourne, experienced some of its hottest temperatures on record at the time: 43.8 °C (110.8 °F) on 8 January and 44.7 °C (112.5 °F) on 10 January. On 13 January, the day of the fires, temperatures reached 45.6 °C (114.1 °F), which stood as the hottest day officially recorded in Melbourne for the next 70 years. Now BOM issue weather alerts when the temperature reaches 30 degrees!

The study by Soon et al clearly shows that temperature measuring stations are increasingly being influenced by solar radiation being absorbed by bitumen and concrete and released through the night. One of the most remarkable illustrations of this effect was an aerial thematic view of the City of Rome at 8.30am in the morning. Vapour trails of early aircraft take-offs are clearly visible. The airport is hot (usually site of temperature gauges) surrounding country is relatively cold

Another reveal over the last 30 years is the number of Land Temperature stations (LTS).  Total LTS in the Northern Hemisphere has declined from 5,000 to 2,000 stations but rural stations have declined from 500 to 200. This has been particularly relevant in the Northern Hemisphere where the most remote Artic stations (northern and coldest) have been closed. The product of this is the average temperature of these remote areas has risen. Mathematics 101. Soon et al have examined 4,500 temperature stations in China, USA the Artic and Ireland that show a warming trend of 0.89º C per Century in Urban areas whereas Rural Stations only show 0.55ºC per Century. This is a significant difference.

Another factor producing higher biased temperatures is the IPCC technique of ‘homogenisation’ where a particular area has all the temperature readings added together then divided by the number of stations. As is expected the number of urban stations read higher than rural ones thus increasing the overall temperature average. Taking the overall rural average the warming trend results in an increase of 0.9ºC since 1850.

So, Antonio Guterres the UN Secretary General prognosis that the ‘World is boiling’ is wrong, stupid and farcical. Soon et al believe the warming is more likely due to Total Solar Radiance whereas the IPCC believe it is due to a trace gas CO2 a plant food. It is interesting to note that commercial greenhouses use about 1,000–1,300 ppm under ideal circumstances. A lower level (800–1,000 ppm) is recommended for raising seedlings (tomatoes, cucumbers and peppers) as well as for lettuce production. Currently the world CO2 sits at 423ppm.

Al Gore (former USA Vice Presidential candidate) has made numerous predictions in his film ‘Inconvenient Truth’ most if not all have proved false. His biggest claim was the Arctic Ocean will be ice free by 2013 or was that 2014 or even 2015! When this did not happen, the argument was that overall, the ice was drastically thinning. Last month October 2024 icebreakers were madly trying to extract ships in the northern passages some two weeks before expected, from Arctic ice closing in.

At the other end of our world in Antarctica numerous IPCC papers claimed that the West Antarctic Ice Sheet was about to, or already collapsing because of warmer waters were circulating caused by Climate change. However, a new study in 2017 found 91 new volcanic vents to add to the 47 volcanoes already known to exist under this ice sheet. As volcanic activity waxes and wanes ice melt will continue in this hot volcanic zone. Whether this ice sheet melts or not it is certainly more probable the effects are more controlled by volcanic activity rather than circulating waters. The IPPC reports also failed to acknowledge that ice buildup was occurring at other points in Antarctica.

Source: volcano foundation with glacier locations added

Is CO2 bad? One remarkable and observable thing is that trees and plants take in carbon dioxide through stomata in their leaves. Since plants first invaded continents (perhaps chasing higher concentrations of carbon dioxide) science has a very good record of the CO2 gas concentrations in the atmosphere. The larger the Stomata the lower the CO2 concentration.

Approximately 580 Ma years ago the concentration was just under 3000ppm. This was soon after a major ice age around 750Ma years ago. The concentration has been steadily falling, since apart from two very low CO2 events occurred around 430Ma and 280Ma and if at any stage the CO2 concentration had dropped below 150ppm then we would not be here as all plants would have died. Other scientific studies show there is a lag between periods when the Earth’s temperature increases and CO2 concentrations rise. Maybe just maybe, the Industrial Revolution saved the planet!

Other scientific papers are showing that the world climate has a natural buffering system. As temperatures rise evaporation increases over the oceans that cover 71% of the earth’s surface. Increased precipitation has a marked cooling effect and together with increased CO2 will lead to greater vegetation growth to feed the worlds increasing population. Desertification will likely decrease. Maybe Central Australia will bloom and make the central Australian Aboriginal communities wealthy.

A paper provided to the Court of Appeals, The Hague November 2023 by Richard Lindzen Professor of Earth, Atmospheric, and Planetary Sciences, Emeritus Massachusetts Institute of Technology, William Harper Professor of Physics, Emeritus Princeton University and Steven Koonin University Professor, New York University, Senior Fellow at the Hoover Institute wrote:

‘We are career physicists who have specialized in radiation physics, dynamic heat transfer and computer modelling for decades, subjects directly relevant to the global warming debate. Each of us has published over 200 peer-reviewed papers, many on the science of climate or closely related subjects. In our opinion, the District Court of The Hague findings that “dangerous” climate change and extreme weather are caused by CO2 emissions from fossil fuels are contradicted by the scientific method and only supported by the unscientific methods of government opinions, consensus, peer review, and cherry-picked or falsified data. Science demonstrates fossil fuels, and CO2 will not cause dangerous climate change. Rather, there will be disastrous consequences for people worldwide if fossil fuels and CO2 emissions are reduced to “net zero,” including mass starvation’.

What if the Net Zero fossil fuels and CO2 policy was in effect in 1750 and CO2 did not rise from 280 ppm to 420 ppm? There would be 21% less food worldwide. Therefore it can be concluded that the Earth’s surface temperature is rising but not at the rate the IPCC would have you believe. As Bjorg Lomborg is saying it is much better to prepare for this eventuality something we cannot change than try to reduce a trace gas that is essential for life.

I fear for those who have trusted governments like they did the Covid science. The false claims of Government about an approaching Armageddon causing an induced psychosis resulting in stunts paralysing normal economic industry. These stunts such as hanging from pylons or gluing to windows, throwing paint, disrupting parliament. Where will it all end? The destruction of our civilisation?


Straight Talk on Climate Science and Net Zero

Michael Simpson of Sheffield University did the literature review and tells it like it is in his recent paper The Scientific Case Against Net Zero: Falsifying the Greenhouse Gas Hypothesis published at Journal of Sustainable Development (2024).  Excerpts in italics with my bolds and added images.

Abstract

The UK Net Zero by 2050 Policy was undemocratically adopted by the UK government in 2019. Yet the science of so-called ‘greenhouse gases’ is well known and there is no reason to reduce emissions of carbon dioxide (CO2), methane (CH4), or nitrous oxide (N2O) because absorption of radiation is logarithmic. Adding to or removing these naturally occurring gases from the atmosphere will make little difference to the temperature or the climate. Water vapor (H2O) is claimed to be a much stronger ‘greenhouse gas’ than CO2, CH4 or N2O but cannot be regulated because it occurs naturally in vast quantities.

This work explores the established science and recent developments in scientific knowledge around Net Zero with a view to making a rational recommendation for policy makers. There is little scientific evidence to support the case for Net Zero and that greenhouse gases are unlikely to contribute to a ‘climate emergency’ at current or any likely future higher concentrations. There is a case against the adoption of Net Zero given the enormous costs associated with implementing the policy, and the fact it is unlikely to achieve reductions in average near surface global air temperature, regardless of whether Net Zero is fully implemented and adopted worldwide. Therefore, Net Zero does not pass the cost-benefit test. The recommended policy is to abandon Net Zero and do nothing about so-called ‘greenhouse gases’. [Topics are shown below with excerpted contents.]

1. Introduction

The argument for Net Zero is that the concentration of CO2 in air is increasing, some small portion of which may be due to human activities and that Net Zero will address this supposed ‘problem’. The underpinning consensus hypothesis is that the human emission of so-called ‘greenhouse gases’ will increase concentrations of these gases in the atmosphere and thereby increase the global near surface atmospheric temperature by absorbance of infrared radiation leading to catastrophic changes in the weather. This leads to the idea that global temperatures should be limited to 2°C and preferably 1.5°C to avoid catastrophic climate change (Paris Climate Agreement, 2015).

A further hypothesis is that there are tipping points in the climate system which will result in positive feedback and a runaway heating of the planet’s atmosphere may occur (Schellnhuber & Turner, 2009; Washington et al., 2009; Levermann et al., 2009; Notz & Schellnhuber, 2009; Lenton et al., 2008; Dakos et al., 2009; Archer et al., 2009). Some of these tipping point assumptions are built into faulty climate models, the outputs of which are interpreted as facts or evidence by activists and politicians. However, output from computer models is not data, evidence or fact and is controversial (Jaworowski, 2007; Bastardi, 2018; Innis, 2008: p.30; Smith, 2021; Nieboer, 2021; Craig, 2021). Only empirical scientifically established facts should be considered so that cause and effect are clear.

From the point of view of physics, the atmosphere is an almost perfect example of a stable system (Coe, et al., 2021). The climate operates with negative feedback (Le Chatelier’s Principle) as do most natural systems with many degrees of freedom (Kärner, 2007; Lindzen et al., 2001 & 2022). The ocean acts as a heat sink, effectively controlling the air temperature. Recent global average surface temperatures remain relatively stable (Easterbrook, 2016; Moran, 2015; Morano, 2021; Marohasy, 2017; Ridley, 2010) or warming very slightly from other causes (Sangster, 2018) and the increase in temperature from 1880 through 2000 is statistically indistinguishable from 0°K (Frank, 2010; Statistics Norway, 2023) and is less than predicted by climate models (Fyfe, 2013). This shows the difference between the consensus view and established facts.

The results imply that the effect of man-made CO2 emissions does not appear to be sufficiently strong to cause systematic changes in the pattern of the temperature fluctuations. In other words, our analysis indicates that with the current level of knowledge, it seems impossible to determine how much of the temperature increase is due to emissions of CO2. Dagsvik et al. 2024

The IPCC has produced six major assessment reports (AR1 to 6) and several special reports which report on a great deal of good science (Noting that the IPCC does not do any science itself but merely compiles literature reviews). The Summaries for Policy Makers (SPM) are followed by most politicians. Yet the SPM do not agree in large part with the scientific assessment by the IPCC reports and appear to exaggerate the role of CO2 and other ‘greenhouse gases’ in climate change. It appears that the SPM is written by governments and activists before  the scientific assessment is reached which is a questionable practice (Ball 2011, 2014 and 2016; Smith 2021).

Other organizations have produced reports of a similar nature and using a similar literature (e.g. Science and Public Policy Institute; The Heartland Institute; The Centre for the Study of CO2; CO2 Science; Global Warming Policy Foundation; Net Zero Watch; The Fraser Institute; CO2 Coalition) and arrived at completely different conclusions to the IPCC and the SPM (Idso et al., 2013a; Idso et al., 2013b; Idso et al., 2014; Idso et al., 2015a, 2015b; Happer, et al., 2022). There are also some web pages (e.g. Popular Technology) which list over a thousand mainstream journal papers casting doubt on the role of CO2 and other greenhouse gases as a source of climate change. For example, a recent report by the CO2 Coalition (2023) states clearly Net Zero regulations and actions are scientifically invalid because they:

  • “Fabricate data or omit data that contradict their conclusions.
  • Rely on computer models that do not work.
  • Rely on findings of the Intergovernmental Panel on Climate Change (IPCC) that are government opinions, not science.
  • Omit the extraordinary social benefits of CO2 and fossil fuels.
  • Omit the disastrous consequences of reducing fossil fuels and CO2 emissions to Net Zero.
  • Reject the science that demonstrates there is no risk of catastrophic global warming caused by fossil fuels and CO2.

Net Zero, then, violates the tenets of the scientific method that for more than 300 years has underpinned the advancement of western civilization.” (CO2 Coalition, 2023; p. 1)

With such a strong scientific conviction the entire Net Zero agenda needs investigating. This paper reviews some of the important science which supports and undermines the Net Zero agenda.

2. Material Studied

A literature review was carried out on various topics related to greenhouse gases, climate change and the relevant scientific literature from the last 20 years in the areas of physics, chemistry, biology, paleoclimatology, geology etc. The method used was an evidence-based approach where several issues were critically evaluated based on fundamental knowledge of the science, emerging areas of scientific investigation and developments in scientific methods. The evidence-based approach is widely used (Green & Britten, 1998; Odom et al., 2005; Easterbrook, 2016; Pielke, 2014; IPCC, 2007a; IPCC 2007b; Field, 2012; IPCC 2014; McMillan & Shumacher, 2013).

Evidence-based research uses data to establish cause and effect relationships which are known to work and allows interventions which are therefore expected to be effective.

3. Greenhouse Gas Theory

The historical development of the greenhouse effect, early discussions and controversies are presented by Mudge (2012) and Strangeways (2011). The explanation of the greenhouse effect or greenhouse gas theory of climate change is given in the IPCC Fourth Assessment Report Working Group 1, The Physical Science Basis (IPCC, 2007, p. 946):

“Greenhouse gases effectively absorb thermal infrared radiation emitted by the Earth’s surface, by the atmosphere itself due to some gases, and by clouds. Atmospheric radiation is emitted to all sides, including downward to the Earth’s surface. Thus, greenhouse gases trap heat within the surface-troposphere system. This is called the greenhouse effect.”

This is plausible but does not necessarily lead to global warming as radiation will be emitted at longer wavelengths in other areas of the electromagnetic spectrum where greenhouse gases do not absorb radiation potentially leading to an energy balance without increase in temperature. To further complicate matters the definition continues with the explanation:

“Thermal infrared radiation in the troposphere is strongly coupled to the temperature of the atmosphere at the altitude at which it is emitted. In the troposphere, the temperature generally decreases with height. Effectively, infrared radiation emitted to space originates from an altitude with a temperature of, on average, -19°C in balance with the net incoming solar radiation, whereas the Earth’s surface is kept at a much higher temperature of, on average, +14°C. An increase in the concentration of greenhouse gases leads to an increased infrared opacity of the atmosphere, and therefore to an effective radiation into space from a higher altitude at a lower temperature. This causes a radiative forcing that leads to an enhancement of the greenhouse effect, the so-called enhanced greenhouse effect.”

This sort of statement is not comprehensible to the average person, makes no sense scientifically and is immediately falsified by recent research (Seim and Olsen, 2020; Coe etal., 2021; Lange et al., 2022, Wijngaarden & Happer, 2019, 2020, 2021(a), 2021(b), 2022, Sheahen, 2021; Gerlich & Tscheuschner, 2009; Zhong & Haigh, 2013). It also contradicts the work of Gray (2015 and 2019) and others and has been heavily criticized (Plimer, 2009; Plimer, 2017; Carter, 2010).

3.1 The Falsifications of the Greenhouse Effect

There are numerous falsifications of the greenhouse gas theory (sometimes called ‘trace gas heating theory’, see Siddons in Ball, 2011, p.19), of global warming and/or climate change (Ball, 2011; Ball, 2014; Ball, 2016; Gerlich & Tscheuschner, 2009; Hertzberg et al, 2017; Allmendinger, 2017; Blaauw, 2017; Nikolov and Zeller, 2017).

Fundamental empirically derived physical laws place limits on any changes in the atmospheric temperature unless there is some strong external force (e.g. increased or decreased solar radiation). For example, the Ideal Gas Law, the Beer-Lambert Law, heat capacities, heat conduction etc., (Atkins & de Paula, 2014; Barrow, 1973; Daniels & Alberty, 1966) all place physical limits on the amount of warming or cooling one might see in the climate system given any changes to heat from the sun or other sources.

3.1.1 The Ideal Gas Law

PV = nRT (1)

The average near-surface temperature for planetary bodies with an atmosphere calculated from the Ideal Gas Law is in excellent agreement with measured values suggesting that the greenhouse effect is very small or non-existent (Table 1). It is thought that the residual temperature difference of 33K between the Stephan-Boltzmann black body effective temperature (255K) on Earth and the measured near-surface temperature (288K) is caused by adiabatic auto-compression (Allmendinger, 2017; Robert, 2018; Holmes 2017, 2018 and 2019). An alternative view of this is given by Lindzen (2022). There is no need for the ‘greenhouse effect’ to explain the near surface atmospheric temperature of planetary bodies with atmospheric pressures above 10kPa (Holmes, 2017). The ideal gas law is robust and works for all gases.

3.1.2 Measurement of Infrared Absorption of the Earth’s Atmosphere

It is now possible to calculate the effect of ‘greenhouse gases’ on the surface atmospheric temperature by (a) using laboratory experimental methods; (b) using the Hitran database (https://hitran.org/); (c) using satellite observations of outgoing radiation compared to Stephan-Boltzmann effective black body radiation and calculated values of temperature.

The near surface temperature and change in surface temperature can be calculated. The result is that climate sensitivity to doubling concentration of CO2 is (0.5°C) including 0.06°C from CH4 and 0.08°C from N2O which is so small as to be undetectable. Most of the temperature change has already occurred and increasing CO2, CH4, N2O concentrations will not lead to significant changes in air temperatures because absorption is logarithmic (Beer-Lambert Law of attenuation) – a law of diminishing returns.

Figure 1. Delta T vs CO2 concentration

The important point here is that the Ideal Gas Law, the logarithmic absorption of radiation and the theoretical calculations by Wijngaarden & Happer (2020 and 2021), Coe et al., (2021) based on the Beer-Lambert Law and the Stephan-Boltzmann Law show that there is an upper limit to the temperature change which can occur by adding ‘greenhouse gases’ to the atmosphere if the main source of incoming radiation (the Sun) does not change over time. The upper limit is ~0.81°C.

3.1.3 Other Falsifications

Many climatologists ignore the well-established ideas of the Ideal Gas Law, Kinetic Theory of Gases and Collision Theory which explain the interaction of gases in the atmosphere (Atkins & de Paula, 2014; Salby, 2012; Tec science). For example, it is difficult for CO2 to retain heat energy (by vibration, rotation, and translation) as there are 1034 collisions between air molecules per second per cubic meter of gas at a pressure of 1 atmosphere (~101.3kPa) and on each collision, energy is exchanged leading to a Maxwell-Boltzmann distribution (similar to a normal distribution) of molecular energies across all molecules in air (Tec science). The Maxwell-Boltzmann distribution has been experimentally determined (Atkins & de Paula, 2014). Thus, the major components of air (nitrogen and oxygen) retain most of the energy, cause evaporation of water vapor by heat transfer (mainly by conduction and convection) and emit radiation at longer wavelengths. The small concentration of CO2 in air (circa 420ppmv) cannot account for large changes in the climate system which have occurred in the past (Wrightstone, 2017 and 2023; Ball, 2014). Plimer (2009 and 2017) presents a great deal of geological scientific evidence which covers paleoclimatology concluding that:

“There is no such thing as the greenhouse effect. The atmosphere behaves neither as a greenhouse nor as an insulating blanket preventing heat escaping from the Earth. Competing forces of evaporation, convection, precipitation, and radiation create an energy balance in the atmosphere.” (Plimer 2009: p.364).

Ball (2014) summarizes a great deal of the geological science:

“The most fundamental assumption in the theory that human CO2 is causing global warming and climate change is that an increase in CO2 will cause an increase in temperature. The problem is that every record of any duration for any period in the history of the Earth exactly the opposite relationship occurs temperature increase precedes CO2 increase. Despite that a massive deception has developed and continues.” Ball (2014: p. 1).

This statement agrees with many other scientists working in geology, earth sciences, physics and physical chemistry as can be seen in cited references in books (Easterbrook, 2016; Wrightstone 2017 and 2023; Plimer, 2009; Plimer 2017; Ball, 2014; Ball,2011; Ball, 2016; Carter, 2010; Koutsoyiannis et al, 2023 & 2024; Hodzic, and Kennedy, 2019). Easterbrook (2016) uses the evidence-based approach to climate science and concludes that:

“Because of the absence of any physical evidence that CO2 causes global warming, the main argument for CO2 as the cause of warming rests largely on computer modelling.”  Easterbrook (2016: p.5).

The results of the models are projected far into the future (circa 80 to 100years) where uncertainties are large, but projections can be used to demonstrate unrealistic but scary scenarios (Idso et al., 2015b). The literature that is used for the IPCC reports appears to be ‘cherry picked’ to agree with their paradigms that increasing CO2 concentrations leads to warming. They ignore the vast literature in climatology, atmospheric physics, solar physics, physics, physical chemistry, geology, biology and palaeoclimatology much of which contradicts the IPCC’s assessment in the summary for policymakers (SPM).

The objective of the IPCC was to find the human causes of climate change – not to look at all the causes of climate change which would be the sensible thing to do if the science were to be used to inform policy decisions. However, there is no experimental evidence for a significant anthropogenic component to climate change (Kaupinnen and Malmi, 2019) which leaves genuine scientists and citizens concerned about the role of the IPCC.

3.1.4 Anthropogenic CO2 and the Residence time of Carbon Dioxide in Air

There is a suggestion (IPCC) that the residence time of CO2 in the atmosphere is different for anthropogenic CO2 and naturally occurring CO2. This breaks a fundamental scientific principle, the Principle of Equivalence. That is: if there is equivalence between two things, they have the same use, function, size, or value (Collins English Dictionary, online). Thus, CO2 is CO2 no matter where it comes from, and each molecule will behave physically and react chemically in the same way.

The figures above illustrate how exaggerated claims are made for CO2 based on the false assumption that CO2 resides in the atmosphere for long periods and can affect the climate. These results are enough to falsify the ideas of anthropogenic global warming caused by CO2 and shows how little human activity contributes to CO2 emissions and concentrations in air. The argument is clear, that if the fictitious greenhouse effect were real for CO2 the human contribution would have no measurable effect upon the climate in terms of global average surface temperature.

The residence time of CO2 in the atmosphere is between 3.0 and 4.1 years using the IPCC’s own data and not the supposed 100 years or 1000 years for anthropogenic CO2 suggested by the IPCC summaries for policy makers (Harde, 2017) which contravenes the Equivalence Principle (Berry, 2019).

“These results indicate that almost all of the observed change of CO2 during the industrial era followed, not from anthropogenic emission, but from changes of natural emission. The results are consistent with the observed lag of CO2 changes behind temperature changes (Humlum et al., 2013; Salby, 2013), a signature of cause and effect.” (Harde, 2017a: 25).

It is well-known that the residence time of CO2 in the atmosphere is approximately 5 years (Boehmer-Christiansen, 2007: 1124; 1137; Kikuchi, 2010). Skrable et al., (2022), show that accumulated human CO2 is 11% of CO2 in air or ~46.84ppmv based on modelling studies. Berry (2020, 2021) uses the Principle of  Equivalence (which the IPCC violates by assuming different timescales for the uptake of natural and human CO2) and agrees with Harde (2017a) that human CO2 adds about 18ppmv to the concentration in air. These are physically extremely small concentrations of CO2 which suggest most CO2 arises from natural sources. It can be concluded that the IPCC models are wrong and human CO2 will have little effect on the temperature.

4. Conclusions

Like many other researchers it was assumed there was robust science behind the greenhouse gas theory and that Net Zero was essential to achieve, but after investigation it now appears that the greenhouse gas theory is questionable and has been successfully challenged for at least 100 years (Gerlich and Tscheuschner, 2009). Much better explanations for planetary near surface atmospheric temperatures are available based on robust, empirically derived scientific laws such as the Ideal Gas law.

Better assessments of the potential increase in temperature with doubling CO2 concentrations are available and the calculated increase is small ~0.5°C (Coe et al., 2021; van Wijngaarden & Happer, 2019, 2020 and 2021; Sheahen, 2021; Schildknecht, 2020) and will remain very small with increased CO2 concentration because the infrared CO2 absorption bands are almost saturated and absorption follows the logarithmic Beer-Lambert law (Figure 1). Much of the work using the Hitran database has been tested against satellite measurements of the outgoing radiation from the Earth’s atmosphere and the calculations are in almost perfect agreement (Sheahen, 2021).

This suggests that the physicists are correct in their assessment of the likely very small increase in atmospheric temperature and therefore there is a strong case against Net Zero as it will have no discernible effect on temperature and the cost of Net Zero is huge. Therefore, the Net Zero project does not pass the cost-benefit test (Montford, 2024b; NESO, 2024). That is the costs are disproportionately high for little or no benefit. Thus, the correct response to a non-problem is to do nothing. The monies being wasted on Net Zero should be spent for the benefit of citizens (e.g. education, health care, public health, water infrastructure, waste processing, economic prosperity etc.). There are many other pressing public health problems from burning fossil fuels which should be addressed (e.g. air pollution especially particulates and carbon monoxide).

Better calculations of the human contribution to atmospheric CO2 concentrations are available and it is small ~18ppmv (Skrable et al., 2022; Berry, 2020; Harde 2017a & 2017b; Harde, 2019; Harde 2014). The phase relation between temperature and CO2 concentration changes are now clearly understood; temperature increases are followed by increases in CO2 likely from outgassing from the ocean and increased biological activity (Davis , 2017; Hodzic and Kennedy, 2019; Humlum, 2013; Salby, 2012; Koutsoyiannis et al, 2023 & 2024).

“In conclusion on the basis of observational data, the climate crisis that, according to many sources, we are experiencing today, is not evident yet.” Alimonti etal. 2022: 111.

Many researchers are addressing the ‘CO2 and climate change problem’ by suggesting decarbonization and other approaches such as Net Zero. CO2 is more than likely not the temperature control and has a very minor to negligible role in global warming (The Bruges Group, 2021; De Lange and Berkhout, 2024; Manheimer, 2022; Statistics Norway 2023; Lindzen and Happer, 2024; Lindzen, et al., 2024).

The scientific literature was examined and found to provide several alternative views concerning CO2 and the need for Net Zero. The objectives of this paper have been achieved and the conclusions can be briefly summarized:

  1. CO2 is a harmless highly beneficial rare trace gas essential for all life on Earth due to photosynthesis which produces simple sugars and carbohydrates in plants and a bi-product Oxygen (O2). CO2is therefore the basis of the entire food supply chain (see Biology or Botany textbooks or House, 2013). CO2 is close to an all-time low geologically (Wrightstone, 2017 and 2023) and controls on CO2 emissions and concentrations in air should be considered as very dangerous and expensive policy indeed. Net Zero is not necessary and should be abandoned.
  2. The greenhouse gas theory has been falsified (i.e. proven wrong) from several disciplines including paleoclimatology, geology, physics, and physical chemistry. CO2 cannot affect the climate in such small concentrations (~420ppmv or ~0.04%) and basing government policy on output from faulty climate models will prove to be very expensive and achieve nothing for the environment, public health, or the climate.

“There is no atmospheric greenhouse effect, in particular CO2 greenhouse effect, in theoretical physics and engineering thermodynamics. Thus, it is illegitimate to deduce predictions which provide a consulting solution for economics and intergovernmental policy.” (Gerlich & Tscheuschner, 2009: 354).

  1. The oceans contain approximately 50 times as much CO2 as is currently present in the air (Easterbrook, 2016; Wrightstone, 2017 and 2023) and as such Henry’s Law will work to maintain the dynamic equilibrium concentration in air over the longer term as the ocean will absorb and outgas CO2(Atkins & de Paula, 2014). Net Zero will, therefore, achieve nothing for the concentration of CO2 in the atmosphere. If the volcanic sources of CO2 are as Kamis (2021), the IPCC and others suggest many times the human contribution, then Net Zero will have no measurable effect on atmospheric CO2 concentrations. Net Zero should, therefore, be abandoned.
  2. The contribution to greenhouse gases, especially CO2, attributable to humans is extremely small, almost negligible (~4.3% or ~18ppmv total accumulation) and half is absorbed by the ocean and biomass. Other naturally occurring so-called greenhouse gases are present in very small/negligible quantities (e.g. CH4, N2O). The systematic attempts to eliminate these trace gases from the atmosphere by reducing industrial output, reducing farming, eliminating fossil fuel use, and changing the way human civilization lives is totally unnecessary – again the ‘do-nothing strategy’ is strongly recommended.
  3. The sciences have been largely ignored by politicians and activists. There have been numerous failings of governments to take notice of scientific findings and they have succumbed to unnecessary pressure from activist groups (including the United Nations and the IPCC). Net Zero is just one example where costly efforts by governments will achieve nothing and not address the real problems of air pollution, public health, or economic well-being of citizens.

“There is not a single fact, figure or observation that leads us to conclude that the world’s climate is in any way disturbed.” (Société de Calcul Mathématique SA, 2015:3).

  1. Circular reasoning is used by the climate modelers. That is, the fictitious greenhouse effect is built into the models such that when the parameter of CO2concentration is increased then the temperature output of the models increases, producing models which run relatively hot compared to natural variability. This reduces the so-called greenhouse effect to little more than a ‘fudge factor’ or ‘parameter’ within models which essentially gives you the answer that you set out to prove. This circular reasoning is hardly scientific enquiry and with data ‘homogenization’ and infilling of missing data begins to look rather peculiar. Climatologists need to recognize these issues, address the real reasons for climate change and offer genuine solutions to any real problems.
  2. The claim of consensus is completely unscientific in its approach (Idso et al, 2015a). Noting that 31,000 US scientists and engineers signed the petition protest (Robinson et al., 2007), recently 90 Italian scientists wrote an open letter to the Italian government (Crescenti et al., 2019), and 500 climatologists and scientists signed an open letter to the UN Secretary General (Berkhout, 2019). All explaining that CO2 is not the cause of climate change. There are thousands of academic papers and books questioning anthropogenic climate change with good data.

Many other concerned individuals have looked at the evidence for anthropogenic climate change based on CO2 and found it wanting (e.g. Davison, 2018; Rofe, 2018).

“If in fact ‘the science is settled’, it seems to be much more settled in the fact that there is no particular correlation between CO2 level and the earth’s temperature.” (Manheimer, 2022).

and

“If you assume the Intergovernmental Panel on Climate Change are right about everything and use only their numbers in the calculation, you will arrive at the conclusion that we should do nothing about climate change!” (Field, 2013).

The academic literature in science offers numerous and far better explanations for climate change than the fictitious greenhouse effect. Researchers should recognize this fact and start to look at dealing with the real causes of climate change. Net Zero is an enormously expensive solution to a non-problem and has no obvious redeeming features. The Net Zero policy is not financially sustainable and should be abandoned.


Global Warming Big Lie–Skip the Distractions

The notion that CO2 from human activities causes global warming has multiple flaws, many of which have been dissected and rebutted here and elsewhere.  But The Big Lie is to fundamentally misrepresent how Earth’s climate system works. Richard Lindzen explains in the above interview with Jordan Peterson.  For those who prefer reading I provide a transcript from the closed captions in italics with my bolds and added images.

JP: When you started to object to the narrative, back say in ‘92, To what narrative were you objecting and on what grounds were you objecting?

RL: You’re touching on something that took me a while to understand. You know Goebbels famously said: If you tell a big enough lie and repeat it often enough, it’ll become the truth. there’s been a lot of that in this. But there are aspects of establishing the narrative, that is, what makes something the truth that I hadn’t appreciated.

So the narrative was the climate is determined by a greenhouse effect
and adding CO2 to it increases warming. And moreover besides CO2
the natural greenhouse substances–water vapor, clouds, upper level clouds–
will amplify whatever man does.

Now that immediately goes against Le Chatelier’s principle which says: If you perturb a system and it is capable internally of counteracting that, it will. And our system is so capable.

So that was a little bit odd. You began wondering, where did these feedbacks come from? Immediately people including myself started looking into the feedbacks, and seeing whether there were any negative ones, and how did it all work?

But underlying it, and this is what I learned: if you want to get a narrative established, the crucial thing is to pepper it with errors, questionable things. So that the critics will seize on those and not question the basic narrative.

The basic narrative was that climate is controlled by the greenhouse effect. In point of fact the earth’s climate system has many regions, but two distinctly different regions. There are the tropics roughly minus 30 to plus 30 degrees latitude, and the extra Tropics outside of plus or minus 30 degrees.

They have very different dynamics, and this is the crucial thing for the Earth by the way. And this is a technicality and much harder to convey than saying that greenhouse gases are a blanket or that 97 percent of scientists agree.

This is actually a technical issue. The Earth rotates. Now people are aware that we have day and night, but there is something called the Coriolis effect. When you’re on a rotating system it gives rise to the appearance of forces that change the winds relative to the rotation. So at the pole the rotation vector is perpendicular to the surface, while at the equator it’s parallel to the surface: it’s zero.

And this gives you phenomenally different Dynamics. So where you don’t have a vertical component to the rotation, vector motions do what they do in the laboratory in small scales. If you have a temperature difference, it acts to wipe it out.
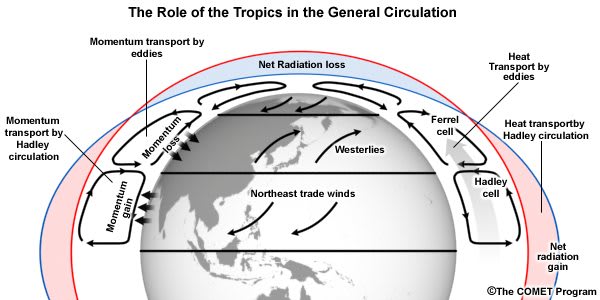
Figure 11. Most sunlight is absorbed in the tropics, and some of the heat energy is carried by air currents to the polar regions to be released back into space as thermal radiation. Along with energy, angular momentum — imparted to the air from the rotating Earth’s surface near the equator — is transported to higher northern and southern latitudes, where it is reabsorbed by the Earth’s surface. The Hadley circulation near the equator is largely driven by buoyant forces on warm, solar-heated air, but for mid latitudes the “Coriolis force” due to the rotation of the earth leads to transport of energy and angular momentum through slanted “baroclinic eddies.” Among other consequences of the conservation of angular momentum are the easterly trade winds near the equator and the westerly winds at mid latitudes.

And so if you look at the tropics the temperatures at any surface are relatively flat: they don’t vary much with latitude. On the other hand you go to the mid Latitudes, in the extra Tropics the temperature varies a lot between the tropics and the pole. We know that about how temperatures are cold at high Latitudes. And if you look at changes in climate in the Earth’s history, what they show is a Tropics that stays relatively constant, and what changes is the temperature difference between the tropics and the pole.

During the Ice Age it was about 60 degrees Centigrade, today it’s about 40.  During 50 million years ago something called the eocene the difference was about 20. So that’s all a function of what’s going on outside the tropics. Within the tropics the greenhouse effect is significant but what determines the temperature change between the tropics and the pole has very little to do with the greenhouse effect.

It is a dynamic phenomenon based on the fact that a temperature difference with latitude generates instabilities. These instabilities take the form of the cyclonic and anticyclonic patterns that you see on the weather map. You can see the tropics are very different from even a casual look at a weather map.
The systems that bring us weather travel from west to east at latitudes outside the tropics. Within the tropics they travel from east to west. The prevailing winds are opposite in the two sections.

Sometimes people say that changes due to the greenhouse effect are amplified at the poles. That is not true: there’s no physical basis for that Statement. All they do is determine the starting point for where the temperature changes in mid-latitudes and that’s determined mainly by Hydrodynamics.

Okay that’s complicated to explain to someone and yet it’s the basis for those claims of seemingly large significance of these small numbers. You know they’re saying if Global mean temperature goes up one and a half degrees it’s the end. That’s based on it getting much bigger at high latitudes and determining that. But all one and a half degrees at the equator would do or in the greenhouse part of the Earth is change the temperature everywhere by one and a half degrees, which for most of us is less than the temperature change between breakfast and lunch.

See Also

Arctic “Amplification” Not What You Think

About Meridional Cooling and Climate Change

CO2 Not a Threat, But Greatly Benefits


Beware false and misleading Cartoons.

First, a plain language scientific explanation is in this article: THE BENEFITS OF CO2 – PART 2: CO2 does not cause global warming.  By Teri Ciccone.  Excerpts in italics with my bolds.

THE BENEFITS OF CO2 – PART 2: CO2 does not cause global warming

Abstract: Climate alarmists, the press/media, and politicians say we must achieve net zero CO2 by 2050 to avoid catastrophic global warming. In reality, all humanity and all life on Earth benefit from the increased atmospheric CO2 and the slight temperature increase. In Part 1, we presented scientific arguments to show how increased CO2 and warmer temperatures benefit humanity and all life on Earth. In Part 2, we discuss why a growing number of independent scientists and engineers argue that CO2 does not cause any measurable global warming. Part 3 will present how and why increased CO2 does not cause extreme climate/weather conditions. in the concluding Part 4 we present recommendations for policymakers.

Introduction: In this study, we set out facts and scientific principles consistent with established laws of physics, chemistry, and thermodynamics to state that greenhouse gases (GHGs) and the greenhouse effect (GHE) do not measurably warm the Earth. The concept that it does is at best a 100-year-old myth. The absorption and re-emission of longwave infrared radiation from the Earth’s surface does not cause any measurable warming of the Earth.It also raises the particular concern that the UN IPCC and NASA/NOAA do not address all of the sources of heat that warm the Earth. Nor consider the many natural forces and cycles that cause weather and climate variations that operate at the Astronomical, Endo-Earth, and Bio-Earth levels. Their well-published and promoted Earth Energy Budget needs serious revisions or to be discarded. Two main concepts describe atmospheric physics and thermodynamics, and each plays a vital role in understanding how the Sun warms the Earth and how the Earth cools. The first is the Radiative Transfer Concept (RTC) and the second is the Heat Transport Concept (HTC). They are both important and both need to be studied to fully understand our weather and climate systems. RTC needs an understanding of quantum physics, radiation, photons, absorption/emissions, etc. HTC needs an understanding of the more mundane science of atmospheric thermodynamics, convection, latent heat, conduction, evaporation-condensation, air and ocean circulations, etc.
Radiation Transfer Concept-RTC. The Sun provides most of the energyneeded to warm the Earth to a comfortable and sustainable level for all life. Solar radiation (photons) readily crosses the vacuum of space and arrives at Earth’s Top Of Atmosphere (TOA) at the speed of light. We see a simplified conceptual model of this radiation in Figure 1, showing the wavelength/ frequency, amplitude, and direction of propagation. These electromagnetic energy rays are emitted over a broad set of vibrational frequencies, spanning 20 orders of magnitude, called the spectrum. This radiant energy arrives at TOA at 1,366 W/m 2 with an average of 340 Watts per square meter (W/m 2 ) when averaged over the spherical world.About 30% of the 340 W/m 2 is reflected to space leaving 240 W/m 2 for the Earth. There one-third is absorbed by the atmosphere and two-thirds by the surface (oceans + lands). The high-energy UV radiation warms the air mostly by photodissociation and photoionization. In this process, the solar radian electromagnetic energy is converted to kinetic energy, and then to physical heat through collisions with air molecules. At the surface, about 67% warms and then cools by local physical heat processes like conduction, convection, and latent heat and 33% by radiation. Most of this radiation exits directly to space through an “atmospheric window” at frequencies that are not absorbable by GHGs. It’s estimated that only about 0.09 W of the solar energy absorbed by the surface is radiated through CO2 the non-water vapor greenhouse gasses (GHGs), a trivially small amount.
In essence, the IPCC claims that these greenhouse gasses already contribute about 33 degrees C of temperature to the average global temperature, and it will continue to increase with increased quantities of human-made CO2 /GHGs. In Summary, the IPCC claim is based on three false assumptions:
1) When a photon’s electromagnetic energy is absorbed by CO2 it warms the CO2 molecule with physical heat. This heat is then shared with other air molecules and the atmosphere warms. The energized CO2 molecule will then re-emit a comparable photon, and the process is repeated hundreds/thousands of times before its heat/energy finally exits into space.
2) Half of all the re-emitted photons go upward as described in 1). But half are radiated downward and are re-absorbed by the surface and warm it.
3) The Sun provides Earth with only enough energy to give the planet an average global temperature of -18°C. But measurements tell us that the average global temperature is about 15°C, therefore they claim that CO2 and the GHE provide the missing 33°C heat.
Together these concepts allegedly warm the Earth by first converting the photon’s Electromagnetic Energy (EMI) into physical heat, and secondly, this process delays the release of the original photon energy into space allowing heat to accumulate and delaying its exit to space. The details of their false science and the errors in their explanation are provided in this article Revised Why all the fuss with CO2 and the Greenhouse effect
Heat Transport Concept, or HTC is the second step towards what happens to the EMI energy of these photons as they approach the surface. Some will be reflected to space, for example, in Antarctica, nearly 100% is reflected to space by the ice and snow. Some will be scattered in the atmosphere and cause no measurable warming of anything. Most of these photons are visible light and Infrared and are not readily absorbed by the air. Nearly all of these photons are absorbed by the surface, the dense solid matter and liquid part, and warms it. This process of photon absorption by the surface and warming is called thermalization and we now discuss the Heat Transport Concept, or HTC. In general, the atmosphere does not warm the surface because the air is normally cooler than the surface. We know this based on the established atmospheric Temperature Lapse Rates. For example, the dry air lapse rate is 9.8°C per Km of altitude. This means that the atmospheric temperature cools by 9.8°C for each kilometre of altitude up to the top of the troposphere. According to the Second Law of thermodynamics heat can only flow from a warmer object to a colder object, never the other way around. The RTC espoused by the UN IPCC violates this Second Law, thereby falsifying their point 2) above. Nitrogen, Oxygen, argon, and water vapor make up more than 99% of the atmosphere. The optical depth, or transparency of the air close to the surface is very opaque. This ensures that almost 100% of resonant Longwave Infrared Radiation (LWIR) photons emitted by the surface will be absorbed by GHGs and immediately thermalized within the first several millimetres of altitude. This means that the resonant photon will be immediately absorbed by a CO2 molecule and become energized. An energized CO2 molecule could spontaneously re-emit the absorbed photon in about half a second as described by the UN IPCC theory. In reality, however, within a millionth/billionth of a second that energised CO2 molecule will physically collide with a non-GHG molecule. The impact of the collision will heat the non-GHG molecule and de-energize the CO2 molecule. So that initial photon has disappeared, and its electromagnetic energy is changed to physical heat and is dispersed throughout the atmosphere adding a tiny bit of warmth to the air. The detailed process is described in Part 2, pages 5-6 of the paper linked above. 
Conclusion. This CO2 photon absorption and immediate collision-thermalization process dominates throughout the troposphere. This means that the CO2 resonant LWIR radiation energy radiating from the surface is saturated to extinction by an overabundance of CO2/GHG molecules. There are no resonant photons left in the troposphere for the CO2 molecule to absorb. This is readily visible in Figure 2 by the presence of the CO2 notch, the top red arrow. In the stratosphere and mesosphere where the molecules are few and far apart, we see an increase in the CO2 spontaneous re-emissions implying a reverse- thermalization and the re-emitted photons exit to space. The UN IPCC claim that CO2/GHGs is the major cause of global warming is thus falsified by the above explanation that is consistent with established laws of science, combined with the absence of any scientific test data.
This makes two powerful cases: First, we can safely abandon the goal and costs of Net Zero and Carbon Capture and Sequestration. Even in the extreme case that atmospheric CO2 doubles or quadruples there is no risk of a catastrophic, run-away global warming threat. Second, the press/media, politicians, and compromised scientists will also say that we should reduce and remove CO2 from the air just to be sure. But, there’s a fact, that there is about 50 times more CO2 dissolved in the oceans than in the air. Henry’s Law tells us nature apportions how much CO2 goes into the air and how much goes into the oceans based only on the temperature of the water’s surface. During a hot sunny day, more CO 2 flows from the oceans to the air. And in cold winters more CO 2 will flow from the air into the oceans and all water on Earth. Imagine the silliness of spending $ billions/trillions to remove CO2 from the air and then have the oceans immediately replace it.
In summary, we find out that CO2/GHG absorption of LWIR energy emitted by the surface provides a negligible amount of physical heat in the troposphere. Consequently, the GHG/GHE provides near zero of the missing heat that the IPCC attributes to the GHGs and the GHE.

Background Paper with complete discussion

Shula_Ott_Collaboration_Rev_5_Multipart_For_Wuwt_16jul2024

Missing Link in the GHE, Greenhouse Effect, by Thomas Shula – Markus Ott,  USA – Germany
2024.  From allaboutenergy.net


Man-Made Climate Change A Good Thing?

Selwyn Duke writes at American Thinker Let’s say man is changing the climate. So what? Excerpts in italics with my bolds and added images.

The temperature is rising!” “The temperature is dropping.” “The temperature is staying the same.”

We argue the “facts” of climate change (even as parts of New Jersey were just buried under 11 inches of global warming). One side wants the facts to show that man is disrupting the climate, while the other wants them to show that he’s not. But an almost never posed question should be asked:

Let’s say, for argument’s sake, that our industry
is causing global warming. So what?

No, I’m not a guy who “just wants to see the world burn” (and that would be literally). Rather, if anthropogenic climate change were occurring, why should we assume it wouldn’t be beneficial?

Greening of the earth from CO2 and warming.

Oh, it’s not just that the Earth is greener and crop yields are higher when CO2 levels are greater; it’s not just that relative warmth breeds life. It’s also this:

Some scientists have said the Earth will soon enter, or has already entered, a significant cooling phase. Others even contend that another ice age is nigh. And if this is so, any man-caused temperature increase would merely mitigate this naturally induced but deadly phenomenon.

One of these scientists was the late Professor S. Fred Singer, an atmospheric and space physics expert who had been a founding director of the Science & Environmental Policy Project. “I have recently become quite concerned about ice ages and the dangers they pose to humans on our planet,” he wrote in 2015 — “and indeed to most of terrestrial ecology.”

Singer explained later in his article that there “are two kinds of ice ages”:

(i) Major (Milankovich-style) glaciations occur on a 100,000-year time-scale and are controlled astronomically. (ii) “Little” ice ages were discovered in ice cores; they have been occurring on an approx. 1000-1500-yr cycle and are likely controlled by the Sun.

The scientist then warned that the “current cycle’s cooling phase may be imminent….”

Now, this is a frightening prospect. Even the liberal New York Times admitted in 2017, reporting on a Lancet study, that “cold weather is responsible, directly or indirectly, for 17 times as many deaths as hot weather.” That’s in our relatively warm time, too. What would happen during a major ice age?

Well, “The coolings are quite severe,” informed Singer. “[T]he most recent one, ending only about 12,000 years ago, covered much of North America and Europe with miles-thick continental ice sheets and led to the disappearance of (barely) surviving bands of Neanderthalers; they were displaced by the more adaptable Homo Sapiens.”

In other words, another major ice age would likely be a Hollywood-like, apocalyptic disaster. In fact, Singer insisted that we should be prepared to use scientific interventions to mitigate such an eventuality (while Bill Gates wants to do the same to cool down the Earth). To be clear, though, while Singer said that another ice age could begin tomorrow, it could also be tens of thousands of years away. And my article isn’t about hashing out the details, assessing probability, or recommending mitigation measures. (you can read Singer’s work for that). It is about this: prejudice.

Again, accepting for argument that man is significantly warming
the planet (not my belief), why assume this is bad?

In reality, moderns’ thinking so often reflects a kind of misanthropism or, at least, a bias against Western-triumph-born modernity. People believing that extraterrestrials furtively visit our planet never assume the aliens’ matter-of-course environmental impact could be malign; they’re too advanced. People pondering a hunter-gatherer tribe (e.g., the North Sentinelese) generally assume they just must live “in harmony with nature” and be innocuous; they’re too primitive. Never mind that American Indians deforested stretches along, and caused the sedimentation of, the Delaware River long before Europeans’ New World arrival (to provide just one perspective-lending example). The activities of man, or modern man or Western man, depending on the precise prejudice, just must be harmful for the simple reason that he engaged in them. So, yes, racial profiling is a problem — against the human race.

In fairness, we can do and have done much to damage the environment. In fairness again, though, forested area in the U.S. is greater than it was a century back and our water and air are cleaner than they were 60 years ago. And in recent times the Great Barrier Reef has actually increased in size (this isn’t necessarily due to man’s activities). So we can also be good shepherds of the Earth.

The odd thing, though, about the misanthropic prejudice is that implicit in it is an idea that man is akin to some unnatural, artificial presence. This, coming from people who generally also believe man is himself only an animal, a mere product of evolution; in other words, just another part of nature. And, of course, whether the result of divine creation or evolutionary happenstance, part of nature (or Creation) is precisely what man is.

As for the world’s fortunes, 99.9 percent of the species of life that have ever existed are extinct, partially due to ice ages. So ironically, if man’s activities — either accidentally, intentionally or both — mitigate the coming ice age, we humans may be responsible for counteracting the next great extinction.

Source: Phanerozoic_Biodiversity.png Author: SVG version by Albert Mestre

Mann’s AMOC Collapse Hoax

Dr. Kevin E. Trenberth, a distinguished scholar at the National Center for Atmospheric Research, commented on this movie: “I don’t recall a lot except that the whole science was incredibly wrong,”, “one does not get an ice age out of global warming.”

Likely you’ve heard the recent and previous warnings from Mann and friends about the ocean conveyor belt (including the Gulf Stream) slowing down and freezing us all.  With the COP gathering next month, something scary must be proclaimed, and Global Freezing is it, replacing Global Boiling earlier this year. The declaration signed by Mann and 43 other scientists was Open Letter by Climate Scientists to the Nordic Council of Ministers, Reykjavik, October 2024. Preface:

“We, the undersigned, are scientists working in the field of climate research and feel it is urgent to draw the attention of the Nordic Council of Ministers to the serious risk of a major ocean circulation change in the Atlantic. A string of scientific studies in the past few years suggests that this risk has so far been greatly underestimated. Such an ocean circulation change would have devastating and irreversible impacts especially for Nordic countries, but also for other parts of the world.”


“Given the increasing evidence for a higher risk of an AMOC collapse, we believe it is of critical importance that Arctic tipping point risks, in particular the AMOC risk, are taken seriously in governance and policy. Even with a medium likelihood of occurrence, given that the outcome would be catastrophic and impacting the entire world for centuries to come, we believe more needs to be done to minimize this risk.”

The Warning is based on Fear, not Facts

1.  The AMOC has been stable for the last four decades.

Florida Current transport observations reveal four decades of steady state Volkov et al 2024

Abstract

The potential weakening of the Atlantic Meridional Overturning Circulation (AMOC) in response to anthropogenic forcing, suggested by climate models, is at the forefront of scientific debate. A key AMOC component, the Florida Current (FC), has been measured using submarine cables between Florida and the Bahamas at 27°N nearly continuously since 1982. A decrease in the FC strength could be indicative of the AMOC weakening. Here, we reassess motion-induced voltages measured on a submarine cable and reevaluate the overall trend in the inferred FC transport. We find that the cable record beginning in 2000 requires a correction for the secular change in the geomagnetic field. This correction removes a spurious trend in the record, revealing that the FC has remained remarkably stable. The recomputed AMOC estimates at ~26.5°N result in a significantly weaker negative trend than that which is apparent in the AMOC time series obtained with the uncorrected FC transports.

Fig. 1: The Western Boundary Time Series
observing network in the Straits of Florida.

The network consists of the submarine telecommunications cable between West Palm Beach and Grand Bahama Island (cyan curve), ship sections across the Florida Current (FC) at 27°N with in situ measurements at nine stations (white circles), two bottom pressure gauges on both sides of the FC at 27°N (yellow stars), and along-track satellite altimetry measurements (magenta dotted line). CTD Conductivity-Temperature-Depth, LADCP Lowered Acoustic Doppler Current Profiler, XBT expendable bathythermograph.

Fig. 6: Florida Current (FC) volume transports corrected for
the secular change in the Earth’s Magnetic Field (EMF).

a The time series of the daily FC volume transport: (blue) not corrected for the secular change in the EMF, (red) corrected for the secular change in the EMF. The linear trends of the FC transport not corrected and corrected for the EMF are shown by the blue and red lines, respectively. b The differences between the cable and ship section transport for the cable data (blue squares) not corrected for the EMF and (red circles) corrected for the EMF. The linear trends of the differences (ΔT) not corrected and corrected for the EMF are shown by the blue and red lines, respectively.

Fig. 2: The Florida Current volume transport.

Daily transport estimates from the cable record (black; prior to corrections applied in this study); estimates from the Pegasus (orange diamonds) and Pegasus in dropsonde mode (Pegasus-DM; light blue circles) sections; estimates from the dropsonde sections (blue circles); and estimates from the Lowered Acoustic Doppler Current Profiler (LADCP) sections (red circles). The linear trends for 1982–2023, 1982–1998, and 2000–2023 periods are shown by the orange, cyan, and magenta lines, respectively.

2.  Paleo records show past AMOC changes due to seafloor shifts not climate change.

Controlling factors for the global meridional overturning circulation: A lesson from the Paleozoic, Yuan et al. 2024.

Abstract

The global meridional overturning circulation (GMOC) is important for redistributing heat and, thus, determining global climate, but what determines its strength over Earth’s history remains unclear. On the basis of two sets of climate simulations for the Paleozoic characterized by a stable GMOC direction, our research reveals that GMOC strength primarily depends on continental configuration while climate variations have a minor impact. In the mid- to high latitudes, the volume of continents largely dictates the speed of westerly winds, which in turn controls upwelling and the strength of the GMOC. At low latitudes, open seaways also play an important role in the strength of the GMOC. An open seaway in one hemisphere allows stronger westward ocean currents, which support higher sea surface heights (SSH) in this hemisphere than that in the other. The meridional SSH gradient drives a stronger cross-equatorial flow in the upper ocean, resulting in a stronger GMOC. This latter finding enriches the current theory for GMOC.

On the basis of a series of simulations for the Paleozoic, we find that the GMOC is primarily controlled by:

  • freshwater input into ocean;
  • wind-driven Ekman pumping in the midlatitudes, and
  • SH anomaly in low latitudes.

The latter two factors are especially important for the strength of the GMOC and are highly related to continental configuration. Our major conclusions find validation through Paleozoic climate simulations using the HadCM3 model by Valdes et al. (53, 67) and a non-IPCC class model, FOAM, by Pohl et al. (52) (figs. S17 and S18). This last study by Pohl et al. (52) also pointed out the unfortunate absence of proxy data for validating the direction and magnitude of the Paleozoic GMOC.

Controlling factors for the global
meridional overturning
circulation

Fig. 5. Schematic of controlling factors for the GMOC during the Paleozoic. The schematic is based on the situation for 400 Ma. Three main factors are shown, the less net precipitation in the south SH; the strong westerlies, ocean surface current, and Ekman upwelling in the midlatitude region in NH; the SSH anomaly and associated pressure anomaly in the low-latitude region.

Although there has been tremendous interest in understanding the mechanisms that govern the MOC, surface topography in the westerlies region and the presence of an open seaway in the low-latitude region were previously largely overlooked. Our study thus draws attention to how the evolution of continents in these two regions affects the strength of MOC. Our study indicates that the traditional theory for MOC misses an important element, that is, the influence of a low-latitude seaway. Previous studies either did not have such a seaway (1, 34, 43) or had a partial seaway that connected the present-day Atlantic Ocean and Pacific Ocean only (32–34). Their focus was mostly on the strength of the AMOC and mechanism invoked generally involved freshwater and salinity only (32, 33, 68), while as demonstrated above, a fully open low-latitude seaway affects the MOC in a fundamentally different way.

3.  AMOC alarm presupposes Arctic “Amplification” of Global Warming

Activist scientists claim the Arctic is warming up to five times faster than lower latitudes.  This is based on models projecting scarce temperature records great distances over the Arctic ocean drift sea ice.  There are three flaws in the arctic warming claim (from Arctic “Amplification” Not What You Think)

a. Arctic Amplification is an artifact of Temperature Anomalies

Clive Best provides this animation of recent monthly temperature anomalies which demonstrates how most variability in anomalies occur over northern continents.

b. Arctic Surface Stations Records Show Ordinary Warming

Locations of 118 arctic stations examined in this study and compared to observations at 50 European stations whose records averaged 200 years and in a few cases extend to the early 1700s.

The paper is: Arctic temperature trends from the early nineteenth century to the present W. A. van Wijngaarden, Theoretical & Applied Climatology (2015).  My synopsis: Arctic Warming Unalarming

c. Arctic Warmth Comes from Meridional Heat Transport, not CO2

4.  Hypothesis that rising CO2 will collapse the AMOC is flawed.

The “AMOC is collapsing” narrative goes like this:

Ocean circulation is driven by density differences, which depend on the salinity and the temperature of the water. Cold, salty water is heavier than warm, fresh water. When flowing water reaches Greenland, it becomes very cold and salty, causing it to sink and flow south, where the water warms and rises closer to the surface again. Some compare the process to a conveyor belt going around and around.

This graphic shows a highly simplified schematic of the Atlantic Meridional Overturning Circulation (AMOC) against a backdrop of the sea surface temperature trend since 1993 from the Copernicus Climate Change Service (https://climate.copernicus.eu/). Image credit: Ruijian Gou. > High res figure.

Changing the salinity of the water messes up the way the water flows. That’s why the melting of the Greenland ice sheets is a big problem: It’s injecting a ton of freshwater into the ocean far north, where the water is usually very salty. The more freshwater, the weaker the circulation—not to mention that atmospheric temperatures are also increasing, which also makes water lighter. The new study shows that if the density dynamics change enough, the conveyor belt will eventually stop moving, aka “collapse.” That means it won’t transport any water, saline, or heat across the globe.

So the scenario is that supposed amplified Arctic warming will cause iceberg calving and glacial melting, and the freshwater will slow and eventually stop the AMOC.  Firstly, the above study shows seafloor configuration has greater impact than salinity changing.  Secondly, the spread of freshwater is not so simple.

Role of the Labrador Current in the Atlantic Meridional Overturning Circulation response to greenhouse warming, Shan et al. 2024

Abstract

Anthropogenic warming is projected to enhance Arctic freshwater exportation into the Labrador Sea. This extra freshwater may weaken deep convection and contribute to the Atlantic Meridional Overturning Circulation (AMOC) decline. Here, by analyzing an unprecedented high-resolution climate model simulation for the 21st century, we show that the Labrador Current strongly restricts the lateral spread of freshwater from the Arctic Ocean into the open ocean such that the freshwater input has a limited role in weakening the overturning circulation. In contrast, in the absence of a strong Labrador Current in a climate model with lower resolution, the extra freshwater is allowed to spread into the interior region and eventually shut down deep convection in the Labrador Sea. Given that the Labrador Sea overturning makes a significant contribution to the AMOC in many climate models, our results suggest that the AMOC decline during the 21st century could be overestimated in these models due to the poorly resolved Labrador Current.

5.  The “Tipping Point” scare is unscientific.

Uncertainties too large to predict tipping times of major Earth system components from historical data, Ben-Yami et al. 2024

Abstract

One way to warn of forthcoming critical transitions in Earth system components is using observations to detect declining system stability. It has also been suggested to extrapolate such stability changes into the future and predict tipping times. Here, we argue that the involved uncertainties are too high to robustly predict tipping times. We raise concerns regarding

(i) the modeling assumptions underlying any extrapolation of historical results into the future,

(ii) the representativeness of individual Earth system component time series, and

(iii) the impact of uncertainties and preprocessing of used observational datasets, with focus on nonstationary observational coverage and gap filling.

We explore these uncertainties in general and specifically for the example of the Atlantic Meridional Overturning Circulation. We argue that even under the assumption that a given Earth system component has an approaching tipping point, the uncertainties are too large to reliably estimate tipping times by extrapolating historical information.

“The conclusions of this study are certainly in line with my understanding of the current state of the art,” says Gavin Schmidt, a climate scientist and professor at Columbia University and the director of NASA’s Goddard Institute for Space Studies (GISS). Schmidt was not involved in the new work, but has extensively researched climate variability and systems like AMOC.

“I have not been impressed by previous or recent efforts to predict upcoming tipping points in either AMOC or ice sheets — there is more going on than just patterns in time series and we still don’t have sufficiently complex and calibrated models to have a robust idea of what will happen,” says Gavin Schmidt, director of NASA’s GISS.

Footnote

In researching for this post I discovered an informative website Ocean to Climate  Science news & articles on topics related to ocean and climate by oceanographer Sang-Ki Lee.  Some additional examples of studies for further reading on this issue are below.

Gulf Stream’s fate to be decided by climate ‘tug-of-war’

A stable Atlantic Meridional Overturning Circulation in a changing North Atlantic Ocean since the 1990s

Detectability of an AMOC Decline in Current and Projected Climate Changes

Global surface warming enhanced by weak Atlantic overturning circulation

Nonstationarity of the Atlantic Meridional Overturning Circulation’s Fingerprint on Sea Surface Temperature


Acidification Alarmists Forced to Fake Findings


The story of fake research findings was published at the journal Science entitled Star marine ecologist committed misconduct, university says.  Excerpts below in italics with my bolds.

Finding against Danielle Dixson vindicates whistleblowers
who questioned high-profile work on ocean acidification

A major controversy in marine biology took a new twist last week when the University of Delaware (UD) found one of its star scientists guilty of research misconduct. The university has confirmed to Science that it has accepted an investigative panel’s conclusion that marine ecologist Danielle Dixson committed fabrication and falsification in work on fish behavior and coral reefs. The university is seeking the retraction of three of Dixson’s papers and “has notified the appropriate federal agencies,” a spokesperson says.

Danielle Dixson, asistant professor at the University of Delaware, will explore coral reefs off Belize over the next three years. Here, she is diving on a reef in the Indo-Pacific. Courtesy of Danielle Dixson Source: delaware online

Dixson is known as a highly successful scientist and fundraiser. She obtained her Ph.D. at James Cook University (JCU),  Townsville in Australia, in 2012; worked as a postdoc and assistant professor at the Georgia Institute of Technology for 4 years; and in 2015 started her own group at UD’s marine biology lab in Lewes, a small town on the Atlantic Coast. She received a $1.05 million grant from the Gordon and Betty Moore Foundation in 2016 and currently has a $750,000 career grant from the National Science Foundation (NSF). She presented her research at a 2015 White House meeting and has often been featured in the media, including in a 2019 story in Science.

Together with one of her Ph.D. supervisors, JCU marine biologist Philip Munday, Dixson pioneered research into the effects on fish of rising CO2 levels in the atmosphere, which cause the oceans to acidify. In a series of studies published since 2009 they showed that acidification can disorient fish, lead them to swim toward chemical cues emitted by their predators, and affect their hearing and vision. Dixson’s later work focused on coral reef ecology, the subject of her Science paper.

The colorful diversity of coral found at One Tree Island. The structure and diversity of coral we see today is already at risk of dissolution from ocean acidification. Kennedy Wolfe University of Sydney

Among the papers is a study about coral reef recovery that Dixson published in Science in 2014, and for which the journal issued an Editorial Expression of Concern in February. Science—whose News and Editorial teams operate independently of each other—retracted that paper today.

The investigative panel’s draft report, which Science’s News team has seen in heavily redacted form, paints a damning picture of Dixson’s scientific work, which included many studies that appeared to show Earth’s rising carbon dioxide (CO2) levels can have dramatic effects on fish behavior and ecology. “The Committee was repeatedly struck by a serial pattern of sloppiness, poor recordkeeping, copying and pasting within spreadsheets, errors within many papers under investigation, and deviation from established animal ethics protocols,” wrote the panel, made up of three UD researchers.

Several former members of Dixson’s lab supported the whistleblowers’ request for an investigation. One of them, former postdoc Zara Cowan, was the first to identify the many duplications in the data file for the now-retracted Science paper. Another, former Ph.D. student Paul Leingang, first brought accusations against Dixson to university officials in January 2020. He left the lab soon after and joined the broader group of whistleblowers.

Leingang, who had been at Dixson’s lab since 2016, says he had become increasingly suspicious of her findings, in part because she usually collected her fluming data alone. In November 2019 he decided to secretly track some of Dixson’s activities. He supplied the investigation with detailed notes, chat conversations, and tweets by Dixson to show that she did not spend enough time on her fluming studies to collect the data she was jotting down in her lab notebooks.

The investigative panel found Leingang’s account convincing and singled him out for praise. “It is very difficult for a young scholar seeking a Ph.D. to challenge their advisor on ethical grounds,” the draft report says. “The Committee believes it took great bravery for him to come forward so explicitly. The same is true of the other members of the laboratory who backed the Complainant’s action.”

UD “did a decent investigation. I think it’s one of the first universities that we’ve seen actually do that,” says ecophysiologist Fredrik Jutfelt of the Norwegian University of Science and Technology, one of the whistleblowers. “So that’s really encouraging.” But he and others in the group are disappointed that the committee appears to have looked at only seven of the 20 Dixson papers they had flagged as suspicious. They also had hoped UD would release the committee’s final report and detail any sanctions against Dixson. “That is a shame,” Jutfelt says.

Inventing Facts to Promote an Imaginary Crisis

Legacy and social media are awash with warnings about hydrocarbon emissions making the oceans acidic and threatening all ocean life from plankton up to whales.  For example:

Ocean acidification: A wake-up call in our waters – NOAA

Canada’s oceans are becoming more acidic – Pêches et Océans Canada

The Ocean Is Getting More Acidic—What That Actually Means– National Geographic

What Is Ocean Acidification? – NASA Climate Kids

Ocean acidification: why the Earth’s oceans are turning to acid – OA-ICC

Etc, etc., etc.

With the climatism hype far beyond any observations, marine biologists have stepped up to make an industry out of false evidence.  They are forced to do so because reality does not conform to their beliefs.  A good summary of acidification hoaxes comes from Jim Steele Un-refutable Evidence of Alarmists’ Ocean Acidification Misinformation in 3 Easy Lessons posted at WUWT.  Points covered include:

♦  The Undisputed Science

♦  The Dissolving Snail Shell Hoax

♦  The Reduced Calcification Hoax

More detail on the bogus fish behavior studies is also found at WUWT: James Cook University Researchers Refuted: “Ocean Acidification Does not Impair” Fish behaviour

A brief explanation debunking the notion of CO2 causing ocean “acidification” is here:

Background Post Shows Alarmist Claims Not Supported in IPCC WG1 References

Headlines Claim, But Details Deny

Update Sept. 9 Response to Brian Catt

Below I note that claimed %s of increasing acidity involve changes in parts per billion for H ion in water.  Further, the relation between atmospheric CO2 and ocean pH needs to be understood.

Figure 1: pH of ocean water and rain water versus concentration of CO2 in the atmosphere. Calculated with (20); Ocean alkalinity [A] = 2.3 × 10⁻³ M. Rain alkalinity [A] = 0. Temperature T = 25 C.

The source is Cohen and Happer (2015), where these conclusions are written:

This minimalist discussion already shows how hard it is to scare informed people with ocean acidification, but, alas, many people are not informed. For example:

• The oceans would be highly alkaline with a pH of about 11.4, similar to that of household ammonia, if there were no weak acids to buffer the alkalinity. Almost all of the buffering is provided by dissolved CO2, with very minor additional buffering from boric acid, silicic acid and other even less important species.

• As shown in Fig. 1, doubling atmospheric CO2 from the current level of 400 ppm to 800 ppm only decreases the pH of ocean water from about 8.2 to 7.9. This is well within the day-night fluctuations that already occur because of photosynthesis by plankton and less than the pH decreases with depth that occur because of the biological pump and the dissolution of calcium carbonate precipitates below the lysocline.

• As shown in Fig. 2, doubling atmospheric CO2 from the current level of 400 ppm to 800 ppm only decreases the carbonate-ion concentration, [CO2−3], by about 30%. Ocean surface waters are already supersaturated by several hundred per cent for formation of CaCO3 crystals from Ca2+ and CO2−3. So scare stories about dissolving carbonate shells are nonsense.

• As shown in Fig. 7, the ocean has only absorbed 1/3 or less of the CO2 that it would eventually absorb when the concentrations of CO2 in the deep oceans came to equilibrium with surface concentrations. Effects like that of the biological pump and calcium carbonate dissolution below the lysocline allow the ocean to absorb substantially more than the amount that would be in chemical-equilibrium with the atmosphere.

• Over most of the Phanerozoic, the past 550 million years, CO2 concentrations in the atmosphere have been measured in thousands of parts per million, and life flourished in both the oceans and on land. This is hardly surprising, given the relative insensitivity of ocean pH to large changes in CO2 concentrations that we have discussed above, and given the fact that the pH changes that do occur are small compared to the natural variations of ocean pH in space and time.


Latest INM Climate Model Projections Triggered by Scenario Inputs

The latest climate simulation from the Russian INM was published in April 2024: Simulation of climate changes in Northern Eurasia by two versions of the INM RAS Earth system model. The paper includes discussing how results are driven greatly by processing of cloud factors.  But first for context readers should be also aware of influences from scenario premises serving as model input, in this case  SSP3-7.0.

Background on CIMP Scenario  SSP3-7.0

A recent paper reveals peculiarities with this scenario.  Recognizing distinctiveness of SSP3-7.0 for use in impact assessments by Shiogama et al (2024).  Excerpts in italics with my bolds and added images.

Because recent mitigation efforts have made the upper-end scenario of the future GHG concentration (SSP5-8.5) highly unlikely, SSP3-7.0 has received attention as an alternative high-end scenario for impacts, adaptation, and vulnerability (IAV) studies. However, the ‘distinctiveness’ of SSP3-7.0 may not be well-recognized by the IAV community. When the integrated assessment model (IAM) community developed the SSP-RCPs, they did not anticipate the limelight on SSP3-7.0 for IAV studies because SSP3-7.0 was the ‘distinctive’ scenario regarding to aerosol emissions (and land-use land cover changes). Aerosol emissions increase or change little in SSP3-7.0 due to the assumption of a lenient air quality policy, while they decrease in the other SSP-RCPs of CMIP6 and all the RCPs of CMIP5. This distinctive high-aerosol-emission design of SSP3-7.0 was intended to enable climate model (CM) researchers to investigate influences of extreme aerosol emissions on climate.

SSP3-7.0 Prescribes High Radiative Forcing

SSP3-7.0 Presumes High Aerosol Emissions

Aerosol Emissions refer to Black Carbon, Organic Carbon, SO2 and NOx.

•  Aerosol emissions increase or change little in SSP3-7.0 due to the assumption of a lenient air quality policy, while they decrease in the other SSP-RCPs of CMIP6 and all the RCPs of CMIP5.

• This distinctive high-aerosol-emission design of SSP3- 7.0 was intended to enable AerChemMIP to investigate the consequences of continued high levels of aerosol emissions on climate.

SSP3-7.0 Supposes Forestry Deprivation

• Decreases in forest area were also substantial in SSP3- 7.0, unlike in the other SSP-RCPs.
• This design enables LUMIP to analyse the climate influences of extreme land-use and land-cover changes.

SSP3-7.0 Projects High Population Growth in Poorer Nations

Global population (left) in billions and global gross domestic product (right) in trillion US dollars on a purchasing power parity (PPP) basis. Data from the SSP database; chart by Carbon Brief using Highcharts.

SSP3-7.0 Projects Growing Use of Coal Replacing Gas and Some Nuclear

My Summary:  Using this scenario presumes high CO2 Forcing (Wm2), high aerosol emissions and diminished forest area, as well as much greater population and coal consumption. Despite claims to the contrary, this is not a “middle of the road” scenario, and a strange choice for simulating future climate metrics due to wildly improbable assumptions.

How Two Versions of a Reasonable INM Climate Model Respond to SSP3-7.0

The preceding information regarding the input scenario provides a context for understanding the output projections from INMCM5 and INMCM6.  Simulation of climate changes in Northern Eurasia by two versions of the INM RAS Earth system model. Excerpts in italics with my bolds and added images.

Introduction

The aim of this paper is the evaluation of climate changes during last several decades in the Northern Eurasia, densely populated region with the unprecedentedly rapid climate changes, using the INM RAS climate models. The novelty of this work lies in the comparison of model climate changes based on two versions of the same model INMCM5 and INMCM6, which differ in climate sensitivities ECS and TCR, with data from available observations and reanalyses. By excluding other factors that influence climate reproduction, such as different cores of GCM components, major discrepancies in description of physical process or numerical schemes, the assessment of ECS and TCR role in climate reproduction can be the exclusive focus. Also future climate projections for the middle and the end of 21st century in both model versions are given and compared.

After modification of physical parameterisations, in the model version INMCM6 ECS increased from 1.8K to 3.7K (Volodin, 2023), and TCR increased from 1.3K to 2.2K. Simulation of present-day climate by INMCM6 Earth system model is discussed in Volodin (2023). A notable increase in ECS and TCR is likely to cause a discrepancy in the simulation of climate changes during last decades and the simulation of future climate projections for the middle and the end of 21st century made by INMCM5 and INMCM6.

About 20% of the Earth’s land surface and 60% of the terrestrial land cover north of 40N refer to Northern Eurasia (Groisman et al, 2009). The Hoegh-Guldberg et al (2018) states that the topography and climate of the Eurasian region are varied, encompassing a sharply continental climate with distinct summer and winter seasons, the northern, frigid Arctic environment and the alpine climate on Scandinavia’s west coast. The Atlantic Ocean and the jet stream affect the climate of western Eurasia, whilst the Mediterranean region, with its hot summers, warm winters, and often dry spells, influences the climate of the southwest. Due to its location, the Eurasian region is vulnerable to a variety of climate-related natural disasters, including heatwaves, droughts, riverine floods, windstorms, and large-scale wildfires.

Historical Runs

One of the most important basic model experiments conducted within the CMIP project in order to control the model large-scale trends is piControl (Eyring et al, 2016). With 1850 as the reference year, PiControl experiment (Eyring et al, 2016) is conducted in conditions chosen to be typical of the period prior to the onset of large-scale industrialization. Perturbed state of the INMCM model at the end of the piControl is taken as the initial condition for historical runs. The historical experiment is conducted in the context of changing external natural and anthropogenic forcings. Prescribed time series include:

♦  greenhouse gases concentration,
♦  the solar spectrum and total solar irradiance,
♦  concentrations of volcanic sulfate aerosol in the stratosphere, and
♦  anthropogenic emissions of SO2, black, and organic carbon.

The ensemble of historical experiments consists of 10 members for each model version. The duration of each run is 165 model years from 1850 to 2014.

SSP3-7.0 Scenario

Experiments are designed to simulate possible future pathways of climate evolution based on assumptions about human developments including: population, education, urbanization, gross domestic product (GDP), economic growth, rate of technological developments, greenhouse gas (GHG) and aerosol emissions, energy supply and demand, land-use changes, etc. (Riahi et al, 2016). Shared Socio-economic Pathways or “SSP” vary from very ambitious mitigation and increasing shift toward sustainable practices (SSP1) to fossil-fueled development (SSP5) (O’Neill et al, 2016).

Here we discuss climate changes for scenario SSP3-7.0 only, to avoid presentation large amount of information. The SSP3-7.0 scenario reflects the assumption on the high GHG emissions scenario and priority of regional security, leading to societies that are highly vulnerable to climate change, combined with relatively high forcing level (7.0 W/m2 in 2100). On this path, by the end of the century, average temperatures have risen by 3.0–5.5◦C above preindustrial values (Tebaldi et al, 2021). The ensembles of historical runs with INMCM5 and INMCM6 were prolonged for 2015-2100 using scenario SSP3-7.0.

Observational data and data processing

Model near surface temperature and specific humidity changes were compared with ERA5 reanalysis data (Hersbach et al, 2020), precipitation data were compared with data of GPCP (Adler et al, 2018), sea ice extent and volume data were compared with satellite obesrvational data NSIDC (Walsh et al, 2019) and the Pan-Arctic Ice Ocean Modeling and Assimilation System (PIOMAS) (Schweiger et al, 2011) respectively, land snow area was compared with National Oceanic and Atmospheric Administration Climate Data Record (NOAA CDR) of Snow Cover Extent (SCE) reanalysis (Robinson et al, 2012) based on the satellite observational dataset Estilow et al (2015). Following Khan et al (2024) Northern Eurasia is defined as land area lying within boundaries of 35N–75N, 20E–180E. Following IPCC 6th Assessment Report (Masson-Delmotte et al, 2021), the following time horizons are distinguished: the recent past (1995– 2014), near term (2021–2040), mid-term (2041–2060), and long term (2081–2100). To compare observed and model temperature and specific humidity changes in the recent past, data for years 1991–2020 were compared with data for years 1961–1990.

Near surface air temperature change

Fig. 1 Annual near surface air temperature change in Northern Eurasia with respect to 1995–2014 for INMCM6 (red), INMCM5 (blue) and ERA5 reanalysis (Hersbach et al, 2020)(black), K. Orange and lightblue lines show ensemble spread.

Despite different ECS, both model versions show (Fig. 1) approximately the same warming over Northern Eurasia by 2010–2015, similar to observations. However, projections of Northern Eurasia temperature after year 2040 differ. By 2100, the difference in 2-m air temperature anomalies between two model versions reaches around 1.5 K. The greater value around 6.0 K is achieved by a model with higher sensitivity. This is consistent with Huusko et al (2021); Grose et al (2018); Forster et al (2013), which confirmed that future projections show a stronger relationship than historical ones between warming and climate sensitivity. In contrast to feedback strength, which is more important in forecasting future temperature change, historical warming is more associated with model forcing. Both INMCM5 and INMCM6 show distinct seasonal warming patterns. Poleward of about 55N the seasonal warming is more pronounced in winter than in summer (Fig. 2). That means the smaller amplitude of the seasonal temperature cycle in 1991– 2020 compared to 1961–1990. The same result was shown in Dwyer et al (2012) and Donohoe and Battisti (2013). The opposite situation is observed during the hemispheric summer, where stronger warming is observed over the Mediterranean region (Seager et al, 2014; Kr¨oner et al, 2017; Brogli et al, 2019), subtropics and midlatitudinal regions of the Pacific Ocean, leading to an amplification of the seasonal cycle. The spatial patterns of projected warming in winter and summer in model historical experiments for 1991-2020 relative to 1961-1990 are in a good agreement with ERA5 reanalysis data, although for ERA5 the absolute values of difference are greater.

East Atlantic/West Russia (EAWR) Index

The East Atlantic/West Russia (EAWR) pattern is one of the most prominent large-scale modes of climate variability, with centers of action on the Caspian Sea, North Sea, and northeast China. The EOF-analysis identifies the EAWR pattern as the tripole with different signs of pressure (or 500 hPa geopotential height) anomalies encompassing the aforementioned region.

In this study, East Atlantic/ West Russia (EAWR) index was calculated as the projection coefficient of monthly 500 hPa geopotential height anomalies to the second EOF of monthly reanalysis 500 hPa geopotential height anomalies over the region 20N–80N, 60W–140E.

Fig. 5 Time series of June-July-August 5-year mean East Atlantic/ West Russia (EAWR) index. Maximum and minimum of the model ensemble are shown as a dashed lines. INMCM6 and INMCM5 ensemble averaged indices are plotted as a red and blue solid lines, respectively.  The ERA5 (Hersbach et al, 2020) EAWR index is shown in green.

[Note: High EAWR index indicates low pressure and cooler over Western Russia, high pressure and warmer over Europe. Low EAWR index is the opposite–high pressure and warming over Western Russia, low pressure and cooling over Europe.]

East Atlantic/ West Russia (EAWR) index Time series of EAWR index can be seen in Fig. 5. Since the middle of 1990s the sign of EAWR index has changed from positive to negative according to reanalysis data. Both versions of the INMCM reproduce the change in the sign of EAWR index. Therefore, the corresponding climate change in the Mediterranean and West Russia regions should be expected. Actually, the difference in annual mean near-surface temperature and specific humidity between 2001–2020 and 1961–1990 shows warmer and wetter conditions spreading from the Eastern Mediterranean to European Russia both for INMCM6 and INMCM5 with the largest difference being observed for the new version of model.

Fig. 6 Annual mean near surface temperature, K (left) and specific humidity, kg/kg (right) in 2001– 2020 with respect to 1961–1990 for INMCM6 (a,b) and INMCM5 (c,d).

Fig. 7 Annual precipitation change (% with respect to 1995–2014) in Northern Eurasia for INMCM6 (red), INMCM5 (blue) and GPCP analysis (Adler et al, 2018) (black). Orange and lightblue lines show ensemble spread.

Discussion and conclusions

Climate changes during the last several decades and possible climate changes until 2100 over Northern Eurasia simulated with climate models INMCM5 and INMCM6 are considered. Two model versions differ in parametrisations of cloudiness, aerosol scheme, land snow cover and atmospheric boundary layer, isopycnal diffusion discretisation and dissipation scheme of the horizontal components of velocity. These modifications in atmosphere and ocean blocks of the model have led to increase of ECS to 3.7 K and TCR to 2.2 K, mainly due to modification of cloudiness parameterisation.

Comparison of model data with available observations and reanalysis show that both models simulate observed recent temperature and precipitation changes consistently with observational datasets. The decrement of seasonal temperature cycle amplitude poleward of about 55N and its increase over the Mediterranean region, subtropics, and mid-latitudinal Pacific Ocean regions are two distinct seasonal warming patterns that are displayed by both INMCM5 and INMCM6. In the long-term perspective, the amplification of difference in projected warming during June-JulyAugust (JJA) and December-January-February (DJF) increases. Both versions of the INMCM reproduce the observed change in the sign of EAWR index from positive to negative in the middle of 1990s, that allows to expect correct reproduction of the corresponding climate change in the Mediterranean and West Russia regions.

Specifically, the enhanced precipitation in the North Eurasian region since the mid-1990s has led to increased specific humidity over the Eastern Mediterranean and European Russia, which is simulated by the INMCM5 and INMCM6 models. Both versions of model correctly reproduce the precipitation change and continue its increasing trend onwards.

Both model versions simulate similar temperature, precipitation, Arctic sea ice extent in 1990–2040 in spite of INMCM5 having much smaller ECS and TCR than INMCM6. However, INMCM5 and INMCM6 show differences in the long-term perspective reproduction of climate changes. After 2040, model INMCM6 simulated stronger warming, stronger precipitation change, stronger Arctic sea ice and land snow extent decrease than INMCM5.

My Comment

So both versions of the model replicate well the observed history.  And when fed the SSP3-7.0 inputs, both project a warmer, wetter world out to 2100; INMCM5 reaches 4.5C and INMCM6 gets to 6.0C.  The scenario achieves the desired high warming, and the cloud enhancements in version 6 amplify it.  I would like to see a similar experiment done with the actual medium scenario SSP2-4.5.

The Original Sin of GHG Theory

In reality, Water only spontaneously flows down a
pressure gradient (downhill).
Energy only spontaneously flows
down an energy density gradient (from high to low).

In the domain of theology, original sin refers to Adam and Eve choosing to trust the serpent’s lies rather than natural truth placed by God in the Garden of Eden.  In legal proceedings, a similar concept concerns evidence obtained under false pretences.  “The fruit of a poisonous tree” refers to analyses, interpretations or conclusions that must be excluded because they started with a falsehood.

This post delves into a fraud at the root of consensus Climate Science™, illustrated by the image above showing how both water and energy flow down their respective gradients.  William Happer alluded to the problem in a recent presentation: (See Happer: Cloud Radiation Matters, CO2 Not So Much)

As we shall see below, mischief is a very polite term for a math and science error that has poisoned most all thinking and discussion about changes in climate and weather.  In a previous post, I summarized an important empirical experiment by Thomas Allmendinger proving that a parcel of pure CO2 and a parcel of ordinary air warm exactly the same when exposed to both SW and LW radiation.  (See Experimental Proof Nil Warming from GHGs).

So we know the notion is empirically wrong, now let’s discuss how GHG theory went off the rails from the beginning.  For that I provide below a synopsis of commentary by blogger Morpheus which he posted at Tallbloke’s Talkshop.  Excerpts in italics with my bolds and added images. (Title in red is link to blog)

CAGW (Catastrophic Anthropogenic Global Warming, due to CO2)
is nothing more than a complex mathematical scam.

The takeaways:

1) The climatologists have conflated their purported “greenhouse effect” with the Kelvin-Helmholtz Gravitational Auto-Compression Effect (aka the lapse rate).

2) The climatologists purport the causative agent for their purported “greenhouse effect” to be “backradiation”.

3) The Kelvin-Helmholtz Gravitational Auto-Compression Effect’s causative agent is, of course, gravity.

4) “Backradiation” is physically impossible because energy cannot spontaneously flow up an energy density gradient.

5) The climatologists misuse the Stefan-Boltzmann (S-B) equation, using the idealized blackbody form of the equation upon graybody objects, which manufactures out of thin air their purported “backradiation”. It is only a mathematical artifact due to that aforementioned misuse of the S-B equation. It does not and cannot actually exist. Its existence would imply rampant violations of the fundamental physical laws.

6) Polyatomic molecules are net atmospheric radiative coolants, not “global warming” gases. Far from the ‘global warming gas’ claimed by the climatologists, water acts as a literal refrigerant (in the strict ‘refrigeration cycle’ sense) below the tropopause. CO2 is the most prevalent atmospheric radiative coolant above the tropopause and the second-most prevalent (behind water vapor) below the tropopause. Peer reviewed studies corroborating this are referenced in the paper at the end of this post.

As you can see, there are two forms of the Stefan-Boltzmann (S-B) equation… one for idealized blackbody objects, one for graybody objects.

The idealized blackbody form of the S-B equation assumes emission to 0 K and ε = 1 by the very definition of idealized blackbody objects. ( ε is the term for emissivity from 0 to 1).

Idealized Blackbody Object (assumes emission to 0 K and ε = 1 by definition):
q_bb = ε σ (T_h^4 – T_c^4) A_h
= 1 σ (T_h^4 – 0 K) 1 m^2
=    σ  T^4

The graybody form of the S-B equation assumes emission to > 0 K and ε < 1.

Graybody Object (assumes emission to > 0 K and ε < 1):
q_gb = ε σ (T_h^4 – T_c^4) A_h

The ‘A_h’ term is merely a multiplier, used if one is calculating for an area larger than unity [for instance: >1 m^2], which converts the result from radiant exitance (W m-2, radiant flux per unit area) to radiant flux (W).

One can see from the immediately-above equation that the Stefan-Boltzmann (S-B) equation is all about subtracting the radiation energy density of the cooler object from the radiation energy density of the warmer object.

So radiant exitance at its most simplified (and thus the S-B equation at its most simplified) is just the emissivity of the warmer object (because emissivity only applies to objects which are emitting, and only the warmer object will be emitting… the colder object will be unable to emit in the direction of the warmer object because energy cannot spontaneously flow up an energy density gradient) multiplied by the speed of light in vacua, multiplied by the energy density differential, all divided by 4.

For graybody objects, it is the radiation energy density differential between warmer object and cooler object which determines warmer object radiant exitance. Warmer objects don’t absorb radiation from cooler objects (a violation of 2LoT in the Clausius Statement sense and Stefan’s Law); the lower radiation energy density gradient between warmer and cooler objects (as compared to between warmer object and 0 K) lowers radiant exitance of the warmer object (as compared to its radiant exitance if it were emitting to 0 K). The radiation energy density differential between objects manifests a radiation energy density gradient, each surface’s radiation energy density manifesting a proportional radiation pressure.

The climatologists use:   q = σ T^4… on graybody objects, and sometimes slap ε<1 onto that,
when they should be using:  q = ε σ (T_h^4 – T_c^4)

This has the effect of artificially inflating radiant exitance of all calculated-upon objects.

Essentially, the climatologists are treating real-world graybody objects as though they are idealized blackbody objects… with emission to 0 K and emissivity of 1 (sometimes… other times they slap emissivity onto the idealized blackbody form of the S-B equation while still assuming emission to 0 K… which is still a misuse of the S-B equation, for graybody objects).

This essentially isolates each object into its own system so it cannot interact with other objects via the ambient EM field, which grossly inflates radiant exitance of all objects, necessitating that the climatologists carry these incorrect values through their calculation and cancel them on the back end (to get their equation to balance) by subtracting a wholly-fictive ‘cooler to warmer’ energy flow from the real (but far too high because it was calculated for emission to 0 K) ‘warmer to cooler’ energy flow.

That wholly-fictive ‘cooler to warmer’ energy flow is otherwise known as ‘backradiation’... it is nothing more than a mathematical artifact due to that aforementioned misuse of the S-B equation.

As I show here and in the below-linked paper, the correct usage of the S-B equation for graybody objects is via subtracting cooler object energy density from warmer object energy density to arrive at the energy density gradient, which determines radiant exitance of the warmer object.

So we’re talking about the same concept as water only spontaneously flowing down a pressure gradient (ie: downhill) when we talk of energy (of any form) only spontaneously flowing down an energy density gradient. Energy density is pressure, an energy density gradient is a pressure gradient… for energy.

It’s a bit more complicated for gases because they can convert that energy density to a change in volume (1 J m-3 = 1 Pa), for constant-pressure processes, which means the unconstrained volume of a gas will change such that its energy density (in J m-3) will tend toward being equal to pressure (in Pa). This is the underlying mechanism for convection. It should also have clued the climatologists in to the fact that it is solar insolation and atmospheric pressure which ‘sets’ temperature, not any ‘global warming’ gases.

Since a warmer object will have higher radiation energy density at all wavelengths than a cooler object (because remember, temperature is a measure of radiation energy density, equal to the fourth root of radiation energy density divided by Stefan’s Constant):

… ‘backradiation’ can do nothing to warm the surface because energy cannot spontaneously radiatively flow from lower to higher radiation energy density, and thus CAGW is nothing more than a complex mathematical scam perpetrated to obtain multiple billions of dollars in funding for trough-grubbing line-toeing ‘scientists’ and by perfidious politicians.

“But how does that make CAGW a scam?”, some may ask… well, because we’re being lied to, based upon an unscientific premise.

The climatologists have misused the Stefan-Boltzmann (S-B) equation (and the fundamental physical laws), and in the process, have practically flipped reality on its head… polyatomics (CO2, H2O, etc.) are not “global warming gases”, they are net atmospheric radiative coolants (radiative emission to space being the only way that Earth can shed energy); monoatomics (Ar) are not inert gases that have no effect upon climate, they are the actual “greenhouse gases” (because they cannot emit IR, and thus cannot shed energy to space… they dilute the radiative coolant gases); homonuclear diatomics (N2, O2) are somewhere in between… they can radiatively emit IR (and thus shed energy from the system known as ‘Earth’), but only under certain conditions (collisional perturbation of their net-zero electric dipole, which is why homonuclear diatomic vibrational mode quantum states are meta-stable and relatively long-lived. Collisions happen exponentially less frequently as altitude increases), and thus are “greenhouse gases” like the monoatomics, just not to the same extent.

We live, at the planet’s surface, in what can be analogized to the evaporator section of a world-sized AC unit, with polyatomics being net atmospheric radiative coolants (a higher concentration of them increases thermodynamic coupling between heat source (surface) and sink (space)), and with monoatomics and homonuclear diatomics playing the same role as non-condensable gases would play in an AC unit… diluting the polyatomic radiative gases which transit the majority of the energy, thus reducing the efficiency at which energy is transited from surface to upper atmosphere, then radiatively emitted to space.

Think about it this way… we all know the air warms up during the daytime as the planet’s surface absorbs energy from the sun. Conduction of that energy when air contacts the planet’s surface is the major reason air warms up.

How does that ~99% of the atmosphere (N2, O2, Ar) cool down? It cannot effectively radiatively emit.

Convection moves energy around in the atmosphere, but it cannot shed energy to space. Conduction depends upon thermal contact with other matter and since space is essentially a vacuum, conduction cannot shed energy to space… this leaves only radiative emission. The only way our planet can shed energy is via radiative emission to space. Fully ~76.2% of all surface energy is removed via convection, advection and evaporation. The surface only radiatively emits ~23.8% of all surface energy to space. That ~76.2% must be emitted to space by the atmosphere.

ERBE Earth Radiation Budget Experiment

Thus, common sense dictates that the thermal energy of the constituents of the atmosphere which cannot effectively radiatively emit (N2, O2, Ar) must be transferred to the so-called ‘greenhouse gases’ (CO2 being a lesser contributor below the tropopause and the largest contributor above the tropopause, water vapor being the main contributor below the tropopause) which can radiatively emit and thus shed that energy to space. Peer-reviewed studies corroborating this are referenced in the linked file below.

So, far from being ‘greenhouse gases’ which ‘trap heat’ in the atmosphere, those polyatomic radiative gases actually shed energy from the atmosphere to space. They are net atmospheric radiative coolants.

In short, in an atmosphere sufficiently dense such that collisional energy transfer can significantly occur, all polyatomic radiative molecules play the part of atmospheric radiative coolants at and above the temperature at which the combined translational mode energy of two colliding particles (atoms or molecules) exceeds the lowest excited vibrational mode quantum state energy of the radiative molecule. Below this temperature, they act to warm the atmosphere via thermalization (the mechanism the climate alarmists claim happens all the time), but if that occurs below the tropopause, the net result is an increase of Convective Available Potential Energy, which increases convection, which is a net cooling process. It is a gradation… as temperature increases, so too does the population of vibrationally excited polyatomics, and thus increases radiative emission. For CO2, that ‘transition temperature’ (the temperature at which the molecule transitions from being ‘net warmant’ to ‘net coolant’ and vice versa) is ~288 K.

The climatologists only told people half the story (thermalization by CO2 via vibrational mode to translation mode (v-t) collisional energy transfer processes). They didn’t tell anyone about the inverse (translational mode to vibrational mode (t-v) collisional energy transfer processes, (then that energy being radiatively emitted to space)), which is a cooling process. That didn’t fit their doomsaying narrative, so they left it out.

In other words, the climatologists only told people about the warming part (thermalization), not the cooling part. In order to hew to the fundamental physical laws, one must consider energy flow both to and from the CO2 molecule.

This doesn’t just apply to CO2, however. It applies to all atmospheric polyatomic molecules. In fact, far from the ‘global warming gas’ claimed by the climatologists, water acts as a literal refrigerant (in the strict ‘refrigeration cycle’ sense) below the tropopause:

That’s why, after all, the humid adiabatic lapse rate (~3.5 to ~6.5 K km-1) is lower than the dry adiabatic lapse rate (~9.81 K km-1).

You will note that the dry adiabatic lapse rate is due to the monoatomics and homonuclear diatomics... we’ve removed in this case the predominant polyatomic which reduces lapse rate.

Remember that an actual greenhouse works by hindering convection of energy out of the greenhouse.

In an atmosphere consisting of solely monoatomics and homonuclear diatomics (ie: no polyatomic radiative molecules), the atoms / molecules could pick up energy via conduction by contacting the surface, just as the polyatomics do; they could convect just as the polyatomics do… but once in the upper atmosphere, they could not as effectively radiatively emit that energy, the upper atmosphere would warm, lending less buoyancy to convecting air, thus hindering convection… and that’s how an actual greenhouse works, by hindering convection.

For homonuclear diatomics, there would be some collisional perturbation of their net-zero electric dipole and thus some emission in the atmosphere, but by and large the atmosphere could not effectively emit (especially at higher altitudes, because the probability of collision decreases exponentially with altitude).

Thus the surface would have to radiatively emit that energy (which is currently ~76.2% of all energy removed from the surface via radiation, convection and evaporation) instead… and a higher surface radiant exitance implies a higher surface temperature.

On the contrary, in our actual atmosphere, as temperature increases, (t-v) (translational mode -to- vibrational mode) collisional energy transfer processes increase and thus spectral emission increases only because CO2 is a net atmospheric radiative coolant (transferring translational mode energy to vibrational mode energy, then radiatively emitting it). So they are attempting to claim that CO2 is a “global warming gas” and simultaneously a net atmospheric radiative coolant, a contradiction… which is why their claims make no sense upon close examination.

In fact, removing CO2 would increase upper atmosphere temperature (due to fewer emitters in the upper atmosphere), which would set the starting point of the lapse rate higher, which translates down through the lapse rate to a warmer surface. That doesn’t occur with Ar, because it is a monoatomic, has no vibrational mode quantum states and thus cannot emit (nor absorb) IR in any case, and thus it only dilutes the radiative polyatomics, reducing the efficiency by which energy is transited from surface to space.

Because we don’t live in a ‘greenhouse’ as the climatologists claim… we live in what can be analogized to a world-sized AC unit… the surface is akin to the AC unit’s evaporator section (ie: the heat source); the atmosphere is akin to the AC unit’s working fluid; space is akin to the AC unit’s condenser section (ie: the heat sink); convection is akin to the AC unit’s compressor (ie: the motive force to move the working fluid).

These concepts used to be common knowledge. Somewhere along the way, the concepts got skewed to fit a particular narrative. Eventually, the concepts described herein will be common knowledge again, whereupon CAGW and its offshoots will be dumped on the midden heap of bad scientific ideas.