Dec. 22 Arctic Ice Nearly Normal

The image above, supported by the table later on shows that in December ice has recovered in the central Arctic with open water found only on the margins, as is typical this time of year. The animation shows progression of ice extent from Dec. 1 to Dec. 22, 2019.

Most dramatic is Hudson Bay on the left filling in over these 3 weeks, from 445k km2 up to 1214k km2, 96% of maximum. At the top, Chukchi Sea also ices over, from 589k km2 to 933k km2, 97% of max. Above Chukchi is Bering Sea just starting with fast ice, and Okhotsk upper right growing ice as usual. The two places lagging behind in ice recovery are Bering Sea and Baffin Bay.

The graph below shows the ice extent growing during December compared to some other years and the 12 year average (2007 to 2018 inclusive).

Note that the  NH ice extent 12 year average increases almost 2M km2 during December, up to 13.1M km2. MASIE 2019 shows a faster icing rate, starting 600k km2 lower than average and now down 200k km2, or 1.5%. MASIE and SII are tracking quite closely this month.  By month end all years appear to be converging on the 12-year average.

Region 2019356 Day 356 Average 2019-Ave. 2010356 2019-2010
 (0) Northern_Hemisphere 12428357 12623541  -195184  12257118 171239 
 (1) Beaufort_Sea 1070223 1070266  -42  1070445 -222 
 (2) Chukchi_Sea 933276 953650  -20374  964317 -31041 
 (3) East_Siberian_Sea 1087137 1087133  1087137
 (4) Laptev_Sea 897845 897842  897845
 (5) Kara_Sea 929742 864955  64786  934937 -5195 
 (6) Barents_Sea 447093 358194  88899  607130 -160037 
 (7) Greenland_Sea 533666 562497  -28831  579647 -45980 
 (8) Baffin_Bay_Gulf_of_St._Lawrence 751185 924722  -173536  630041 121144 
 (9) Canadian_Archipelago 854282 853082  1201  853214 1068 
 (10) Hudson_Bay 1213848 1199010  14839  767479 446370 
 (11) Central_Arctic 3225391 3199892  25499  3244808 -19417 
 (12) Bering_Sea 147493 312873  -165379  219969 -72475 
 (13) Baltic_Sea 11462 20025  -8564  100363 -88902 
 (14) Sea_of_Okhotsk 324167 306066  18101  283712 40455 

The table shows where the ice is distributed compared to average.  Bering Sea and Baffin Bay have the only large deficits to average, while Kara and Barents Seas are in surplus.

Footnote:  Interesting comments today by Dr. Judah Cohen at his blog regarding the Arctic fluctuations. Excerpts with my bolds.

I have said many times the first thing that you learn as a seasonal forecaster is humility and these are one of those times. What is humbling me at the moment is that I have expected a weakening of the stratospheric polar vortex (PV) based on fall Arctic predictors – extensive Siberian snow cover, more limited Arctic sea ice extent and a relatively warm Arctic. Following the PV weakening or disruption, severe winter weather would be more frequent at least regionally across the mid-latitudes of the Northern Hemisphere (NH). But to be honest it is hard to see from today’s viewpoint how this verifies. And as I have shared on Twitter the new operational GFS, the FV3, has been especially bullish on a strong PV.

The biggest challenge that I see right now is the center of low mid-tropospheric heights currently just north of Alaska and is expected to expand in breadth over the next two weeks enough so to fill the entire Arctic basin. This a fairly class pattern of low heights in the Arctic and high heights in the mid-latitudes resulting in a cold Arctic/warm continents pattern, all consistent with a positive AO. It seems a bit ironic (at least to me) that with the record low sea ice in the Chukchi-Bering seas this fall, the incredibly warm year Alaska just experienced both in part due to persistent ridging in the region, this same region is predicted to now experience an extended period of low heights and below normal temperatures. As an aside, this is something that I had a hard time anticipating even just a few weeks ago. 

So, for now I remain steadfast in the winter forecast that based on high fall snow cover/low Arctic sea ice that they will in tandem perturb the PV. Given the westerly quasi-biennial oscillation (QBO) I expect a scenario somewhere between winter 2016/17 and winter 2017/18. Both of those winters were westerly QBO winters and the most significant disruption of the stratospheric PV took place in February.

Illustration by Eleanor Lutz shows Earth’s seasonal climate changes. If played in full screen, the four corners present views from top, bottom and sides.

CO2 Hysteria Impairs Thinking

An article by James Pero at Daily Mail confirms suspicions about muddled thinking regarding global warming/climate change.  Is carbon dioxide making it harder to THINK straight?   Excerpts in italics with my comments and images.

Rising CO2 levels may hinder cognitive function and could decrease decision-making efficiency by 50 PERCENT in 2100, study says. 

  • Carbon emissions may have a drastic impact on cognitive function
  • Researchers say that CO2 may decrease classroom decision making
  • It could reduce decision making by as much as 50 percent in 2100, they say

Rational thought may eventually become a victim of climate change according to a new study.

[Well, media announcements and studies like this one show rationality is already greatly compromised.]

Research presented by scientists at the annual American Geophysical Union and submitted to the journal GeoHealth suggests that increased CO2 may soon diminish humans’ capacity to think clearly.

The findings follow previous studies that show how indoor air pollution and poor ventilation can hinder people’s ability to perform mentally, including a study published last year from the University College London.

[Note the chart at the top showing that CO2 in the atmosphere is 410ppm (parts/per/million) , or 0.04%.  Note also that health and safety regulations for buildings expect no harmful effects below 5000 ppm, which would be 10 times the present amount.]

‘Human cognitive performance declines with an increase in CO2’, the researchers wrote in the paper.

‘Direct impacts of CO2 emissions on human cognitive performance may be unavoidable.’

Those studies concluded that circulating air and regulating the amount of CO2 trapped in a room can help mitigate the effects of too much CO2, but new research suggests ventilation in a climate change-addled future might just make matters worse.

[This diagram shows the ratio of human to natural carbon dioxide in the atmosphere equals the ratio of their inflows, independent of residence time.
The amount of CO2 flowing from humans into the atmosphere is miniscule (about 4%) compared to CO2 flowing from the oceans and biosphere (96%).  Thus the human component presently is 17ppm (or 0.002%).  Eliminating our emissions entirely would have no discernable impact on the total amount.  See Who to Blame for Rising CO2?]

It also used two different climate models – one that factors in reductions in CO2 and another that projects conditions if emissions continue unfettered.

In the model that factors in some emissions intervention, scientists say decision making in the classroom could decrease by 25 percent while a model without emissions mitigation could see a whopping 50 percent reduction.

Though previous studies have shown a correlation between brain function and CO2, not much is currently understood about why the gas affects our brains the way it does.

As noted by Gizmodo, a previous study on CO2’s correlation to brain function showed that an increase as little as 5 percent had reduces brain activity.

[Let’s see: A 5% increase in CO2 would be a leap from 0.041% to 0.043%, requiring some fine sensors to even detect it.  Doubtful that brains are that sensitive to the gas itself, but obviously there is huge sensitivity to the idea of rising CO2.

OTOH plants have sensed and appreciated the increased CO2 as shown in the greening of the planet since 1982]
No current research has studied the kind of long-term exposure that will would result from rampant climate change.

As noted by researchers, however, all of the adverse effects of CO2 on mental performance can still be averted by making a concerted effort to lower emissions and stave off climate change.

This is your brain on CO2 hysteria. Just say no!


2019 Ocean pH Spin

The ocean “acidification” scare is again rearing its head in efforts to sway public opinion on the Paris accord. The latest study is from NOAA Research News Tiny shells reveal waters off California are acidifying twice as fast as the global ocean.  Excerpts in italics with my bolds.

The Claim:  

In first-of-its-kind research, NOAA scientists and academic partners used 100 years of microscopic shells to show that the coastal waters off California are acidifying twice as fast as the global ocean average — with the seafood supply in the crosshairs.

California coastal waters contain some of our nation’s more economically valuable fisheries, including salmon, crabs and shellfish. Yet, these fisheries are also some of the most vulnerable to the potential harmful effects of ocean acidification on marine life. That increase in acidity is caused by the ocean absorbing excess carbon dioxide from the atmosphere.

The Science:

From Autonomous seawater pCO2 and pH time series from 40 surface buoys and the emergence of anthropogenic trends published at Earth System Science Data.  Excerpts in italics with my bolds.

Conclusions

This product provides a unique data set for a range of users including providing a more accessible format for non-carbon chemists interested in surface ocean pCO2 and pH time series data. These 40 time series locations represent a range of ocean, coastal, and coral reef regimes that exhibit a broad spectrum of daily to interannual variability. These time series can be used as a tool for estimating climatologies, assessing natural variability, and constraining models to improve predictions of trends in these regions.

However, at this time, only two time series data sets (WHOTS and Stratus) are long enough to estimate long-term anthropogenic trends. ToE estimates show that at all but these two sites, an anthropogenic signal cannot be discerned at a statistically significant level from the natural variability of surface seawater pCO2 and pH. If and when that date of trend detection is attained, it is essential to seasonally detrend data prior to any trend analyses.

Even though the ToE provided are conservative estimates, data users should still use caution in interpreting that an anthropogenic trend is distinct from decadal-scale ocean forcing that is not well characterized. Future work should be directed at improving upon these ToE estimates in regions where other data, proxies, or knowledge about decadal forcing are more complete.

Background from previous post: Basics of Ocean Acidification

Updates added below June 20 and 24, 2015

Update below July 2, 2015: Ocean pH is actually trending alkaline

Update below September 15, 2015: Extensive discussion of ocean chemistry

If surface temperatures don’t skyrocket soon, expect to hear a lot in the coming months about “ocean acidification.”  This sounds scary, and that is the point of emphasizing it to build support for Paris COP.

So here’s the basic chemistry of CO2 and H20:

8lrtxibuouhqy8limppbfwkc76e5k_rxa9xbrm8mssw

That seems straight forward,  So what is the problem?

That looks fairly serious.  So what does the IPCC have to say about this issue?

What does it say in the SPM (Summary for Policy Makers)?

For this issue, I looked at the topic of ocean acidification and fish productivity. The SPM asserts on Page 17 that fish habitats and production will fall and that ocean acidification threatens marine ecosystems.

“Open-ocean net primary production is projected to redistribute and, by 2100, fall globally under all RCP scenarios. Climate change adds to the threats of over-fishing and other non-climatic stressors, thus complicating marine management regimes (high confidence).” Pg 17 SPM

“For medium- to high-emission scenarios (RCP4.5, 6.0, and 8.5), ocean acidification poses substantial risks to marine ecosystems, especially polar ecosystems and coral reefs, associated with impacts on the physiology, behavior, and population dynamics of individual species from phytoplankton to animals (medium to high confidence).” Pg 17 SPM

So, the IPCC agrees that ocean acidification is a serious problem due to rising CO2 emissions from burning fossil fuels.

What does it say in the Working Group Reports?

But wait a minute.  Let’s see what is in the working group reports that are written by scientists, not politicians.

WGII Report, Chapter 6 covers Ocean Systems. There we find a different story with more nuance and objectivity:

“Few field observations conducted in the last decade demonstrate biotic responses attributable to anthropogenic ocean acidification” pg 4

“Due to contradictory observations there is currently uncertainty about the future trends of major upwelling systems and how their drivers (enhanced productivity, acidification, and hypoxia) will shape ecosystem characteristics (low confidence).” Pg 5

“Both acclimatization and adaptation will shift sensitivity thresholds but the capacity and limits of species to acclimatize or adapt remain largely unknown” Pg 23

“Production, growth, and recruitment of most but not all non-calcifying
seaweeds also increased at CO2 levels from 700 to 900 µatm Pg 25

“Contributions of anthropogenic ocean acidification to climate-induced alterations in the field have rarely been established and are limited to observations in individual species” Pg. 27

“To date, very few ecosystem-level changes in the field have been attributed to anthropogenic or local ocean acidification.” Pg 39

Ocean Chemistry on the Record

Contrast the IPCC headlines with the the Senate Testimony of John T. Everett, in which he said:

“There is no reliable observational evidence of negative trends that can be traced definitively to lowered pH of the water. . . Papers that herald findings that show negative impacts need to be dismissed if they used acids rather than CO2 to reduce alkalinity, if they simulated CO2 values beyond triple those of today, while not reporting results at concentrations of half, present, double and triple, or as pointed out in several studies, they did not investigate adaptations over many generations.”

“In the oceans, major climate warming and cooling and pH (ocean pH about 8.1) changes are a fact of life, whether it is over a few years as in an El Niño, over decades as in the Pacific Decadal Oscillation or the North Atlantic Oscillation, or over a few hours as a burst of upwelling (pH about 7.59-7.8) appears or a storm brings acidic rainwater (pH about 4-6) into an estuary.”
http://www.epw.senate.gov/public/index.cfm?FuseAction=Files.View&FileStore_id=db302137-13f6-40cc-8968-3c9aac133b16

Many organisms benefit from less alkaline water.

(Added in thanks to David A.’s comment below)

In addition, IPCC has ignored extensive research showing positive impacts on marine life from lower pH. These studies are catalogued at CO2 Science with this summary:

There are numerous observations of improvement in calcification of disparate marine life in realistic rates of PH change due to increased CO2.

“In the final graphical representations of the information contained in our Ocean Acidification Database, we have plotted the averages of all responses to seawater acidification (produced by additions of both HCl and CO2) for all five of the life characteristics of the various marine organisms that we have analyzed over the five pH reduction ranges that we discuss in our Description of the Ocean Acidification Database Tables, which pH ranges we illustrate in the figure below.”

“The most striking feature of Figure 11 is the great preponderance of data located in positive territory, which suggests that, on the whole, marine organisms likely will not be harmed to any significant degree by the expected decline in oceanic pH. If anything, in fact, the results suggest that the world’s marine life may actually slightly benefit from the pH decline, which latter possibility is further borne out by the scatter plot of all the experimental data pertaining to all life characteristic categories over the same pH decline range, as shown below in Figure 12.”

At PH decline from control of .125, calcification, metabolism, fertility, growth and survival all moved into positive territory.

http://www.co2science.org/data/acidification/acidification.php

Summary

The oceans are buffered by extensive mineral deposits and will never become acidic. Marine life is well-adapted to the fluctuations in pH that occur all the time.

This is another example of climate fear-mongering:  It never happened before, it’s not happening now, but it surely will happen if we don’t DO SOMETHING!.

Conclusion

Many know of the Latin phrase “caveat emptor,” meaning “Let the buyer beware”.

When it comes to climate science, remember also “caveat lector”–”Let the reader beware”.

Update added June 20, 2015

For additional commentary on ocean acidification:

http://www.newsmax.com/FastFeatures/ocean-acidification-global-warming-quotes-debate/2015/05/06/id/642876/

Update added June 24, 2015

Patrick Moore also provides a thorough debunking here:

“It is a fact that people who have saltwater aquariums sometimes add CO2 to the water in order to increase coral growth and to increase plant growth. The truth is CO2 is the most important food for all life on Earth, including marine life. It is the main food for photosynthetic plankton (algae), which in turn is the food for the entire food chain in the sea.”

http://news.heartland.org/editorial/2015/05/27/why-coral-reefs-and-shellfish-will-not-die-ocean-acidification

Update added July 2, 2015

Scientists have had pH meters and measurements of the oceans for one hundred years. But experts decided that computer simulations in 2014 were better at measuring the pH in 1910 than the pH meters were. The red line (below) is the models recreation of ocean pH. The blue stars are the data points — the empirical evidence.

What we have here is one of the basic foundations of the climate change scare, that is falling ocean pH levels with increased atmospheric CO2 content, being completely dismissed by the empirical ocean pH data the alarmist climate scientists didn’t want to show anyone because it contradicted their ‘increasing ocean acidity’ narrative.

Oceans not acidifying – “scientists” hid 80 years of pH data

Update added September 15, 2015

In summary, recent research publications are using a term (OA) that is technically incorrect, misleading, and pejorative; it could not be found in the oceanography literature before about 15 years ago. . .

The claim that the surface-water of the oceans has declined in pH from 8.2 to 8.1, since the industrial revolution, is based on sparse, contradictory evidence, at least some of which is problematic computer modeling. Some areas of the oceans, not subject to algal blooms or upwelling, may be experiencing slightly lower pH values than were common before the industrial revolution. However, forecasts for ‘average’ future pH values are likely exaggerated and of debatable consequences. The effects of alkaline buffering and stabilizing biological feedback loops seem to be underappreciated by those who carelessly throw around the inaccurate term “ocean acidification.”

Are the Oceans Becoming More Acidic?

Stoking Big Climate Business

Rupert Darwall writes from Madrid to Real Clear Energy The Business of Climate Change. Excerpts in italics with my bolds.

Open image in new tab to enlarge. Details at Follow the money.

Saving the planet takes money, and lots of it. Money is both the theme and the subtext of the latest round of UN climate talks being held here—a vast river of cash flows through the UN climate process. Formally, the meeting is about nailing down one of the more obscure provisions of the Paris Agreement: Article 6, which provides for market-based instruments so that countries can trade their way out of their decarbonization commitments. Billions of cross-border dollars and transaction fees hang on the outcome.

With the negotiations concerning mind-paralyzing definitions of interest only to the most intrepid climate geeks, business and finance leaders could wind up taking center stage. When they first started coming to climate conferences, it was to observe and advise. Now it’s to show-and-tell their green virtue. “Momentum is there,” declared Paul Polman, the former Uniliver CEO. “Climate change is the biggest business opportunity of all time.” We’re close to several policy tipping points, he suggested.

The EU is about to approve a massive Green New Deal. Michael Bloomberg’s Task Force on Climate-related Financial Disclosures (TFCD) encourages companies to make voluntary climate-related risk disclosures. Draft EU regulations, meantime, could pave the way for mandatory climate disclosures that would force investment managers to justify their investments against climate and environmental benchmarks. Businesses are transitioning to “net zero,” Polman claims—meaning zero carbon emissions. They’re so far advanced that at this point, it’s only governments holding them back.

Peeling away the hype reveals a very different picture. Companies promising to cut their carbon emissions rely on offsetting—that is, paying for their consumption of hydrocarbon energy by supporting projects that reduce greenhouse-gas emissions, such as renewable energy. If companies were genuine in their commitment to tackle climate change, though, they would develop zero-carbon baselines for their own activities.

A growing number of companies boast about the proportion of wind and solar in their energy consumption. These claims rely on an entirely legal accounting fraud that says that renewable electricity can be stored; the physical reality is that electricity is consumed the instant that it’s generated. In peddling the falsehood that business and households can depend on anything close to 100% intermittent renewable energy, companies are misleading the public.

Rather than demonstrating a genuine – and painful – commitment to radical decarbonization, business leaders’ public professions of climate awareness reflect a confluence of interest between, on the one hand, corporate public-affairs departments steeped in doctrines of corporate social responsibility (CSR), and, on the other, nongovernmental organizations (NGOs). It’s a collusive process. The more environmental reporting requirements, the greater the importance of CSR in corporate hierarchies, the more work there is for external environmental consultants—and the greater the leverage NGOs wield over corporations.

Then there’s the psychology of herding, whereby CEOs are fearful of being hung out to dry if they don’t sign the latest statement pledging their company to save the world from climate breakdown. All this might remind readers of two groups in Ayn Rand’s Atlas Shrugged: the Moochers, comprising, in this example, the craven CEOs and their in-house CSR crowd; and the Looters, the environmental NGOs.

Their ultimate victim is capitalism, the only economic system ever to have produced durable, transformative economic growth.

Madrid also marks the debut of finance ministers at UN climate talks, with the formation of a coalition of finance ministers for climate action. Under their Santiago Action Plan, over 50 finance ministers, including most from the EU, pledged to incorporate climate-change considerations into economic policy and seek “analytical expertise” to put their economies on the path of “inclusive economics, social, and wider restructuring.”

The first rule of economic policymaking is that any government intervention in the economy involves trade-offs.

In the case of decarbonization policies that drive up energy costs, “net zero” means zero growth. The en masse capitulation of finance ministries before the altar of climate change sends a negative signal about future economic growth. Patricia Espinosa, executive secretary of the UN climate-change convention, has already sent out invitations to finance ministers to attend next year’s talks. Once on the climate bandwagon, it’s almost impossible to get off.

Then there are those desperate to get on the climate bandwagon and never get off. Anyone who has attended a UN climate conference will have noticed that some of the best-dressed participants are from Africa’s poorest nations, some with chunky Rolexes on their wrists. The UN makes sure that they suffer no hardship from their climate-change-fighting efforts. The Daily Subsistence Allowance, once handed out in envelopes with $100 bills, is now disbursed in its plastic equivalent of Swiss value cards. NGOs, whose role at climate conferences is to act as the spontaneous expression of civil society, are also eligible. Unsurprisingly, youth NGOs want to get in on the DSA act, too.

The incentive this creates is to make the UN what its critics always accuse it of being: a talking shop. According to one estimate, participants in the Article 6 discussions have already spent 70,000 hours failing to define what a “market instrument” is. Why decide, when another comfortable meeting in another expensive city beckons?

When it comes to Article 6, rich nations want tight rules to ensure that their money won’t be used to fund phony emissions cuts. Environment ministries in poorer nations naturally see Article 6 as a stream of funding that will flow through them. In principle, though, it’s hard to see how an emissions market can work as intended, when developed nations with hard caps on their emissions can pay to outsource their cuts to nations with no caps and no rigorous inventory of greenhouse gases.

Back in the U.S., some 80 business leaders have signed a statement urging the U.S. to remain in the Paris Agreement, with its commitment to limit warming to 1.5 degrees Centigrade above pre-industrial levels. Anyone who has looked at the numbers and what they entail in terms of global emissions cuts knows that this is next to impossible. It’s conceivable that global greenhouse-gas emissions will plateau, but steep cuts to “zero” aren’t going to happen. But America must have a seat at the table, comes the response. Perhaps, then, to show that they have some skin in the game, these business leaders should endure thousands of hours of meetings trying to decide what a market instrument is.

Bill Gates on Financiers Climate Fantasies:

Background from Previous Post: Why Al Gore Keeps Yelling “Fire!”

Some years ago I attended seminars regarding efforts to achieve operational changes in organizations. The notion was presented that people only change their habits, ie. leave their comfort zone, when they fear something else more than changing their behavior. The analogy was drawn comparing to workers leaping from a burning oil platform, or tenants from a burning building.

Al Gore is fronting an agenda to unplug modern societies, and thereby the end of life as we know it. Thus they claim the world is on fire, and only if we abandon our ways of living can we be saved.

The big lie is saying that the world is burning up when in fact nothing out of the ordinary is happening. The scare is produced by extrapolating dangerous, fearful outcomes from events that come and go in the normal flow of natural and seasonal climate change. They can not admit that the things they fear have not yet occurred.  We will jump only if we believe our platform, our way of life, is already crumbling.

And so we come to Al Gore recently claiming that his past predictions of catastrophe have all come true.

J.Frank Bullitt writes at Issues and Insights Gore Says His Global Warming Predictions Have Come True? Can He Prove It? Excerpts in italics with my bolds.

When asked Sunday about his 2006 prediction that we would reach the point of no return in 10 years if we didn’t cut human greenhouse gas emissions, climate alarmist in chief Al Gore implied that his forecast was exactly right.

“Some changes unfortunately have already been locked in place,” he told ABC’s Jonathan Karl.

Sea level increases are going to continue no matter what we do now. But, we can prevent much larger sea level increases. Much more rapid increases in temperature. The heat wave was in Europe. Now it’s in Arctic. We’re seeing huge melting of the ice there. So, the warnings of the scientists 10 years ago, 20 years ago, 30 years ago, unfortunately were accurate.”

Despite all this gloom, he’s found “good news” in the Democratic presidential field, in which “virtually all of the candidates are agreed that this is either the top issue or one of the top two issues.”

So what has Gore been predicting for the planet? In his horror movie “An Inconvenient Truth,” he claimed:

Sea levels could rise as much as 20 feet. He didn’t provide a timeline, which was shrewd on his part. But even if he had said 20 inches, over 20 years, he’d still have been wrong. Sea level has been growing for about 10,000 years, and, according to the National Oceanic and Atmospheric Administration, continues to rise about one-eighth of an inch per year.

“Storms are going to grow stronger.” There’s no evidence they are stronger nor more frequent.

Mt. Kilimanjaro was losing its snow cap due to global warming. By April 2018, the mountain glaciers were taking their greatest snowfall in years. Two months later, Kilimanjaro was “covered by snow” for “an unusually long stint. But it’s possible that all the snow and ice will be gone soon. Kilimanjaro is a stratovolcano, with a dormant cone that could erupt.

Point of no return. If we have truly gotten this far, why even care that “virtually all” of the Democratic candidates have agreed that global warming is a top issue? If we had passed the point of no return, there’d be no reason to maintain hope. The fact Gore’s looking for a “savior” from among the candidates means that even he doesn’t believe things have gone too far.

A year after the movie, Gore was found claiming that polar bears’ “habitat is melting” and “they are literally being forced off the planet.” It’s possible, however, that there are four times as many polar bears as there were in the 1960s. Even if not, they’ve not been forced off the planet.

Also in 2007, Gore started making “statements about the possibility of a complete lack of summer sea ice in the Arctic by as early as 2013,” fact-checker Snopes, which leans so hard left that it often falls over and has to pick itself up, said, before concluding that “Gore definitely erred in his use of preliminary projections and misrepresentations of research.”

Unwilling to fully call out one its own, Snopes added that “Arctic sea ice is, without question, on a declining trend.” A fact check shows that to be true. A deeper fact check, though, shows that while Arctic sea ice has been falling, Antarctic sea ice has been increasing.

Finally — just for today because sorting out Gore’s fabrications is an ongoing exercise — we remind readers of the British judge who found that “An Inconvenient Truth” contained “nine key scientific errors” and “ruled that it can only be shown with guidance notes to prevent political indoctrination,” the Telegraph reported in 2007.

Gore has been making declarative statements about global warming for about as long as he’s been in the public eye. He has yet to prove a single claim, though. But how can he? The few examples above show that despite his insistence to the contrary, his predictions have failed.

Even if all turned out to be more accurate than a local three-day forecast, there’s no way to say with 100% certainty that the extreme conditions were caused by human activity. Our climate is a complex system, there are too many other variables, and the science itself has limits, unlike Gore’s capacity to inflate the narrative.

Footnote: 

Lest anyone think this is all about altruism, Al Gore is positioned to become even more wealthy from the war on meat.

Generation Investment Management is connected to Kleiner Perkins, where former Vice President Al Gore is one of its partners and advisors.

Who’s Kleiner Perkins? It turns out they are Beyond Meat’s biggest investor, according to bizjournals.com here. Beyond Meat is a Los Angeles-based producer of plant-based meat substitutes founded in 2009 by Ethan Brown. The company went public in May and just weeks later more than quadrupled in value.

Yes, Al Gore, partner and advisor to Kleiner Perkins, Beyond Meat’s big investor, stands to haul in millions, should governments move to restrict real meat consumption and force citizens to swallow the dubious substitutes and fakes.

If taken seriously, the World Research Institute Report, backed by Gore hacks, will help move the transition over to substitute meats far more quickly.


Hurricanes Unrelated to CO2

A recent study exposes the lack of relation between CO2 and hurricanes in the US North Atlantic. Ryan Truchelut and Erica Staehling published  An Energetic Perspective on United States Tropical Cyclone Landfall Droughts in Geophysical Research Letters, December 2017. Excerpts in italics with my bolds. H/T Craig Idso and Master Resource

Summary

The 2017 Atlantic hurricane season has been extremely active both in terms of the strength of the tropical cyclones that have developed and the amount of storm activity that has occurred near the United States. This is even more notable as it comes at the end of an extended period of below normal U.S. hurricane activity, as no major (category 3 or higher) hurricanes made landfall from 2006 through 2016. Our study examines how rare the recent “landfall drought” actually was using a record of the estimated total energy of storms over the U.S., rather than prior methods of counting hurricanes making U.S. landfall. Using this technique, we found that 2006–2015 was in the least active 10% of 10 year periods in terms of U.S. tropical cyclone energy but that several less active periods had occurred in the last 50 years. The 2006–2016 drought years did record the lowest percentage of storm activity occurring over the U.S. relative to what was observed over the entire Atlantic. This finding is further evidence for a trade‐off between atmospheric conditions favoring hurricane development and those that are most favorable for powerful storms to move towards the U.S. coastline.

[The graph above shows exhibit 2a from Truchelut and Staehling overlaid with the record of atmospheric CO2 concentrations.  From NOAA combining Mauna Loa with earlier datasets.]

To determine Integrated Storm Activity Annually over the Continental U.S. (ISAAC) from 1900 through 2017, we summed this landfall ACE spatially over the entire continental U.S. and temporally over each hour of each hurricane season. We used the same methodology to calculate integrated annual landfall ACE for five additional geographic subsets of the continental U.S.

Figure 2 (a) Time series of ISAAC for 1900–2017, with a 10 year centered average value (red). (b) Spatial distribution of ACE over the U.S. for 1900–2017, summing all hourly intensities of TCs occurring within 0.5° of each grid point.

ISAAC accounts for 4.3% of annual total Atlantic ACE since 1950, with a seasonal median value of 3.4%. The maximum value of 18.5% occurred in 1985, in which there were six U.S. hurricane landfalls despite near‐normal basin‐wide total ACE. Minimum values of lower than 0.5% occurred in several years in the time series. In 2017, around 4.5% of total Atlantic TC activity occurred over the continental U.S., almost exactly in‐line with the long‐term mean percentage.

Ultimately, the 2017 hurricane season is a stark reminder that understanding interannual variability in TC hazard risk is of utmost importance to scientists, policymakers, emergency managers, insurers, and coastal citizens. The use of energetic metrics is a step toward better acuity in diagnostic and predictive modeling of this risk variance; for instance, in years during which three hurricanes made U.S. landfall, the number of ACE units over the continental U.S. ranged from fewer than 4 to more than 14. As a means of more fully incorporating the reliable climatological record into this and future studies, landfall ACE is promising for properly contextualizing the rarity of events like the recent landfall drought.

Wrap Up 2019 Hurricane Season (Previous post)


Figure: Global Hurricane Frequency (all & major) — 12-month running sums. The top time series is the number of global tropical cyclones that reached at least hurricane-force (maximum lifetime wind speed exceeds 64-knots). The bottom time series is the number of global tropical cyclones that reached major hurricane strength (96-knots+). Adapted from Maue (2011) GRL.

This post refers to statistics for this year’s Atlantic and Global Hurricane season, now likely completed.  The chart above was updated by Ryan Maue yesterday.  A detailed report is provided by the Colorado State University Tropical Meteorology Project, directed by Dr. William Gray until his death in 2016.  More from Bill Gray in a reprinted post at the end.

The article is Summary of 2019 Atlantic Tropical Cyclone Activity and Verification of Authors’ Seasonal And Two-week Forecasts.   By Philip J. Klotzbach, Michael M. Bell, and Jhordanne Jones In Memory of William M. Gray.  Excerpts in italics with my bolds.

Summary: 

The 2019 Atlantic hurricane season was slightly above average and had a little more activity than what was predicted by our June-August updates. The climatological peak months of the hurricane season were characterized by a below-average August, a very active September, and above-average named storm activity but below-average hurricane activity in October. Hurricane Dorian was the most impactful hurricane of 2019, devastating the northwestern Bahamas before bringing significant impacts to the
southeastern United States and the Atlantic Provinces of Canada. Tropical Storm Imelda also brought significant flooding to southeast Texas.

Open image in new tab to enlarge.

The 2019 hurricane season overall was slightly above average. The season was characterized by an above-average number of named storms and a near-average number of hurricanes and major hurricanes. Our initial seasonal forecast issued in April somewhat underestimated activity, while seasonal updates issued in June, July and August, respectively, slightly underestimated overall activity. The primary reason for the underestimate was due to a more rapid abatement of weak El Niño conditions than was originally anticipated. August was a relatively quiet month for Atlantic TC activity, while September was well above-average. While October had an above-average number of named storm formations, overall Accumulated Cyclone Energy was slightly below normal.

Figure: Last 4-decades of Global and Northern Hemisphere Accumulated Cyclone Energy: 24 month running sums. Note that the year indicated represents the value of ACE through the previous 24-months for the Northern Hemisphere (bottom line/gray boxes) and the entire global (top line/blue boxes). The area in between represents the Southern Hemisphere total ACE.

Previous Post:  Bill Gray: H20 is Climate Control Knob, not CO2

William Mason Gray (1929-2016), pioneering hurricane scientist and forecaster and professor of atmospheric science at Colorado State University.

Dr. William Gray made a compelling case for H2O as the climate thermostat, prior to his death in 2016.  Thanks to GWPF for publishing posthumously Bill Gray’s understanding of global warming/climate change.  The paper was compiled at his request, completed and now available as Flaws in applying greenhouse warming to Climate Variability This post provides some excerpts in italics with my bolds and some headers.  Readers will learn much from the entire document (title above is link to pdf).

The Fundamental Correction

The critical argument that is made by many in the global climate modeling (GCM) community is that an increase in CO2 warming leads to an increase in atmospheric water vapor, resulting in more warming from the absorption of outgoing infrared radiation (IR) by the water vapor. Water vapor is the most potent greenhouse gas present in the atmosphere in large quantities. Its variability (i.e. global cloudiness) is not handled adequately in GCMs in my view. In contrast to the positive feedback between CO2 and water vapor predicted by the GCMs, it is my hypothesis that there is a negative feedback between CO2 warming and and water vapor. CO2 warming ultimately results in less water vapor (not more) in the upper troposphere. The GCMs therefore predict unrealistic warming of global temperature. I hypothesize that the Earth’s energy balance is regulated by precipitation (primarily via deep cumulonimbus (Cb) convection) and that this precipitation counteracts warming due to CO2.

Figure 14: Global surface temperature change since 1880. The dotted blue and dotted red lines illustrate how much error one would have made by extrapolating a multi-decadal cooling or warming trend beyond a typical 25-35 year period. Note the recent 1975-2000 warming trend has not continued, and the global temperature remained relatively constant until 2014.

Projected Climate Changes from Rising CO2 Not Observed

Continuous measurements of atmospheric CO2, which were first made at Mauna Loa, Hawaii in 1958, show that atmospheric concentrations of CO2 have risen since that time. The warming influence of CO2 increases with the natural logarithm (ln) of the atmosphere’s CO2 concentration. With CO2 concentrations now exceeding 400 parts per million by volume (ppm), the Earth’s atmosphere is slightly more than halfway to containing double the 280 ppm CO2 amounts in 1860 (at the beginning of the Industrial Revolution).∗

We have not observed the global climate change we would have expected to take place, given this increase in CO2. Assuming that there has been at least an average of 1 W/m2 CO2 blockage of IR energy to space over the last 50 years and that this energy imbalance has been allowed to independently accumulate and cause climate change over this period with no compensating response, it would have had the potential to bring about changes in any one of the following global conditions:

  • Warm the atmosphere by 180◦C if all CO2 energy gain was utilized for this purpose – actual warming over this period has been about 0.5◦C, or many hundreds of times less.
  • Warm the top 100 meters of the globe’s oceans by over 5◦C – actual warming over this period has been about 0.5◦C, or 10 or more times less.
  • Melt sufficient land-based snow and ice as to raise the global sea level by about 6.4 m. The actual rise has been about 8–9 cm, or 60–70 times less. The gradual rise of sea level has been only slightly greater over the last ~50 years (1965–2015) than it has been over the previous two ~50-year periods of 1915–1965 and 1865–1915, when atmospheric CO2 gain was much less.
  • Increase global rainfall over the past ~50-year period by 60 cm.

Earth Climate System Compensates for CO2

If CO2 gain is the only influence on climate variability, large and important counterbalancing influences must have occurred over the last 50 years in order to negate most of the climate change expected from CO2’s energy addition. Similarly, this hypothesized CO2-induced energy gain of 1 W/m2 over 50 years must have stimulated a compensating response that acted to largely negate energy gains from the increase in CO2.

The continuous balancing of global average in-and-out net radiation flux is therefore much larger than the radiation flux from anthropogenic CO2. For example, 342 W/m2, the total energy budget, is almost 100 times larger than the amount of radiation blockage expected from a CO2 doubling over 150 years. If all other factors are held constant, a doubling of CO2 requires a warming of the globe of about 1◦C to enhance outward IR flux by 3.7 W/m2 and thus balance the blockage of IR flux to space.

Figure 2: Vertical cross-section of the annual global energy budget. Determined from a combination of satellite-derived radiation measurements and reanalysis data over the period of 1984–2004.

This pure IR energy blocking by CO2 versus compensating temperature increase for radiation equilibrium is unrealistic for the long-term and slow CO2 increases that are occurring. Only half of the blockage of 3.7 W/m2 at the surface should be expected to go into an temperature increase. The other half (about 1.85 W/m2) of the blocked IR energy to space will be compensated by surface energy loss to support enhanced evaporation. This occurs in a similar way to how the Earth’s surface energy budget compensates for half its solar gain of 171 W/m2 by surface-to-air upward water vapor flux due to evaporation.

Assuming that the imposed extra CO2 doubling IR blockage of 3.7 W/m2 is taken up and balanced by the Earth’s surface in the same way as the solar absorption is taken up and balanced, we should expect a direct warming of only ~0.5◦C for a doubling of CO2. The 1◦C expected warming that is commonly accepted incorrectly assumes that all the absorbed IR goes to the balancing outward radiation with no energy going to evaporation.

Consensus Science Exaggerates Humidity and Temperature Effects

A major premise of the GCMs has been their application of the National Academy of Science (NAS) 1979 study3 – often referred to as the Charney Report – which hypothesized that a doubling of atmospheric CO2 would bring about a general warming of the globe’s mean temperature of 1.5–4.5◦C (or an average of ~3.0◦C). These large warming values were based on the report’s assumption that the relative humidity (RH) of the atmosphere remains quasiconstant as the globe’s temperature increases. This assumption was made without any type of cumulus convective cloud model and was based solely on the Clausius–Clapeyron (CC) equation and the assumption that the RH of the air will remain constant during any future CO2-induced temperature changes. If RH remains constant as atmospheric temperature increases, then the water vapor content in the atmosphere must rise exponentially.

With constant RH, the water vapor content of the atmosphere rises by about 50% if atmospheric temperature is increased by 5◦C. Upper tropospheric water vapor increases act to raise the atmosphere’s radiation emission level to a higher and thus colder level. This reduces the amount of outgoing IR energy which can escape to space by decreasing T^4.

These model predictions of large upper-level tropospheric moisture increases have persisted in the current generation of GCM forecasts.§ These models significantly overestimate globally-averaged tropospheric and lower stratospheric (0–50,000 feet) temperature trends since 1979 (Figure 7).

Figure 8: Decline in upper tropospheric RH. Annually-averaged 300 mb relative humidity for the tropics (30°S–30°N). From NASA-MERRA2 reanalysis for 1980–2016. Black dotted line is linear trend.

All of these early GCM simulations were destined to give unrealistically large upper-tropospheric water vapor increases for doubling of CO2 blockage of IR energy to space, and as a result large and unrealistic upper tropospheric temperature increases were predicted. In fact, if data from NASA-MERRA24 and NCEP/NCAR5 can be believed, upper tropospheric RH has actually been declining since 1980 as shown in Figure 8. The top part of Table 1 shows temperature and humidity differences between very wet and dry years in the tropics since 1948; in the wettest years, precipitation was 3.9% higher than in the driest ones. Clearly, when it rains more in the tropics, relative and specific humidity decrease. A similar decrease is seen when differencing 1995–2004 from 1985–1994, periods for which the equivalent precipitation difference is 2%. Such a decrease in RH would lead to a decrease in the height of the radiation emission level and an increase in IR to space.

The Earth’s natural thermostat – evaporation and precipitation

What has prevented this extra CO2-induced energy input of the last 50 years from being realized in more climate warming than has actually occurred? Why was there recently a pause in global warming, lasting for about 15 years?  The compensating influence that prevents the predicted CO2-induced warming is enhanced global surface evaporation and increased precipitation.

Annual average global evaporational cooling is about 80 W/m2 or about 2.8 mm per day.  A little more than 1% extra global average evaporation per year would amount to 1.3 cm per year or 65 cm of extra evaporation integrated over the last 50 years. This is the only way that such a CO2-induced , 1 W/m2 IR energy gain sustained over 50 years could occur without a significant alteration of globally-averaged surface temperature. This hypothesized increase in global surface evaporation as a response to CO2-forced energy gain should not be considered unusual. All geophysical systems attempt to adapt to imposed energy forcings by developing responses that counter the imposed action. In analysing the Earth’s radiation budget, it is incorrect to simply add or subtract energy sources or sinks to the global system and expect the resulting global temperatures to proportionally change. This is because the majority of CO2-induced energy gains will not go into warming the atmosphere. Various amounts of CO2-forced energy will go into ocean surface storage or into ocean energy gain for increased surface evaporation. Therefore a significant part of the CO2 buildup (~75%) will bring about the phase change of surface liquid water to atmospheric water vapour. The energy for this phase change must come from the surface water, with an expenditure of around 580 calories of energy for every gram of liquid that is converted into vapour. The surface water must thus undergo a cooling to accomplish this phase change.

Therefore, increases in anthropogenic CO2 have brought about a small (about 0.8%) speeding up of the globe’s hydrologic cycle, leading to more precipitation, and to relatively little global temperature increase. Therefore, greenhouse gases are indeed playing an important role in altering the globe’s climate, but they are doing so primarily by increasing the speed of the hydrologic cycle as opposed to increasing global temperature.

Figure 9: Two contrasting views of the effects of how the continuous intensification of deep
cumulus convection would act to alter radiation flux to space.
The top (bottom) diagram represents a net increase (decrease) in radiation to space

Tropical Clouds Energy Control Mechanism

It is my hypothesis that the increase in global precipitation primarily arises from an increase in deep tropical cumulonimbus (Cb) convection. The typical enhancement of rainfall and updraft motion in these areas together act to increase the return flow mass subsidence in the surrounding broader clear and partly cloudy regions. The upper diagram in Figure 9 illustrates the increasing extra mass flow return subsidence associated with increasing depth and intensity of cumulus convection. Rainfall increases typically cause an overall reduction of specific humidity (q) and relative humidity (RH) in the upper tropospheric levels of the broader scale surrounding convective subsidence regions. This leads to a net enhancement of radiation flux to space due to a lowering of the upper-level emission level. This viewpoint contrasts with the position in GCMs, which suggest that an increase in deep convection will increase upper-level water vapour.

Figure 10: Conceptual model of typical variations of IR, albedo and net (IR + albedo) associated with three different areas of rain and cloud for periods of increased precipitation.

The albedo enhancement over the cloud–rain areas tends to increase the net (IR + albedo) radiation energy to space more than the weak suppression of (IR + albedo) in the clear areas. Near-neutral conditions prevail in the partly cloudy areas. The bottom diagram of Figure 9 illustrates how, in GCMs, Cb convection erroneously increases upper tropospheric moisture. Based on reanalysis data (Table 1, Figure 8) this is not observed in the real atmosphere.

Ocean Overturning Circulation Drives Warming Last Century

A slowing down of the global ocean’s MOC is the likely cause of most of the global warming that has been observed since the latter part of the 19th century.15 I hypothesize that shorter multi-decadal changes in the MOC16 are responsible for the more recent global warming periods between 1910–1940 and 1975–1998 and the global warming hiatus periods between 1945–1975 and 2000–2013.

Figure 12: The effect of strong and weak Atlantic THC. Idealized portrayal of the primary Atlantic Ocean upper ocean currents during strong and weak phases of the thermohaline circulation (THC)

Figure 13 shows the circulation features that typically accompany periods when the MOC is stronger than normal and when it is weaker than normal. In general, a strong MOC is associated with a warmer-than-normal North Atlantic, increased Atlantic hurricane activity, increased blocking action in both the North Atlantic and North Pacific and weaker westerlies in the mid-latitude Southern Hemisphere. There is more upwelling of cold water in the South Pacific and Indian Oceans, and an increase in global rainfall of a few percent occurs. This causes the global surface temperatures to cool. The opposite occurs when the MOC is weaker than normal.

The average strength of the MOC over the last 150 years has likely been below the multimillennium average, and that is the primary reason we have seen this long-term global warming since the late 19th century. The globe appears to be rebounding from the conditions of the Little Ice Age to conditions that were typical of the earlier ‘Medieval’ and ‘Roman’ warm periods.

Summary and Conclusions

The Earth is covered with 71% liquid water. Over the ocean surface, sub-saturated winds blow, forcing continuous surface evaporation. Observations and energy budget analyses indicate that the surface of the globe is losing about 80 W/m2 of energy from the global surface evaporation process. This evaporation energy loss is needed as part of the process of balancing the surface’s absorption of large amounts of incoming solar energy. Variations in the strength of the globe’s hydrologic cycle are the way that the global climate is regulated. The stronger the hydrologic cycle, the more surface evaporation cooling occurs, and greater the globe’s IR flux to space. The globe’s surface cools when the hydrologic cycle is stronger than average and warms when the hydrologic cycle is weaker than normal. The strength of the hydrologic cycle is thus the primary regulator of the globe’s surface temperature. Variations in global precipitation are linked to long-term changes in the MOC (or THC).

I have proposed that any additional warming from an increase in CO2 added to the atmosphere is offset by an increase in surface evaporation and increased precipitation (an increase in the water cycle). My prediction seems to be supported by evidence of upper tropospheric drying since 1979 and the increase in global precipitation seen in reanalysis data. I have shown that the additional heating that may be caused by an increase in CO2 results in a drying, not a moistening, of the upper troposphere, resulting in an increase of outgoing radiation to space, not a decrease as proposed by the most recent application of the greenhouse theory.

Deficiencies in the ability of GCMs to adequately represent variations in global cloudiness, the water cycle, the carbon cycle, long-term changes in deep-ocean circulation, and other important mechanisms that control the climate reduce our confidence in the ability of these models to adequately forecast future global temperatures. It seems that the models do not correctly handle what happens to the added energy from CO2 IR blocking.

Figure 13: Effect of changes in MOC: top, strong MOC; bottom weak MOC. SLP: sea level pressure; SST, sea surface temperature.

Solar variations, sunspots, volcanic eruptions and cosmic ray changes are energy-wise too small to play a significant role in the large energy changes that occur during important multi-decadal and multi-century temperature changes. It is the Earth’s internal fluctuations that are the most important cause of climate and temperature change. These internal fluctuations are driven primarily by deep multi-decadal and multi-century ocean circulation changes, of which naturally varying upper-ocean salinity content is hypothesized to be the primary driving mechanism. Salinity controls ocean density at cold temperatures and at high latitudes where the potential deep-water formation sites of the THC and SAS are located. North Atlantic upper ocean salinity changes are brought about by both multi-decadal and multi-century induced North Atlantic salinity variability.

josh-knobs

 Footnote:

The main point from Bill Gray was nicely summarized in a previous post Earth Climate Layers

The most fundamental of the many fatal mathematical flaws in the IPCC related modelling of atmospheric energy dynamics is to start with the impact of CO2 and assume water vapour as a dependent ‘forcing’.  This has the tail trying to wag the dog. The impact of CO2 should be treated as a perturbation of the water cycle. When this is done, its effect is negligible. — Dr. Dai Davies

climate-onion2

Get A Grip on Climate Panic


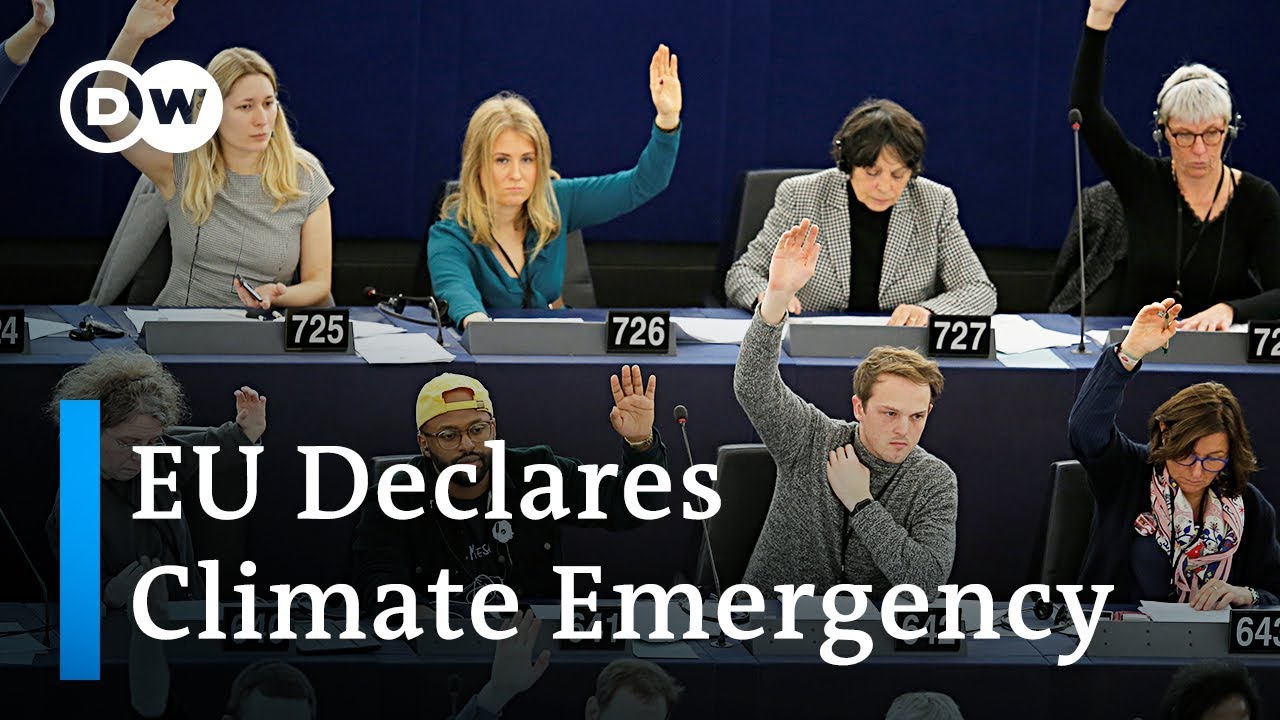
Deutsche Welle provides this opinion article during the second week of COP25:  In times of climate change, panic rules. Excerpts in italics with my bolds

As the planet heats up, so does the debate about climate change. Sensible debate is becoming increasingly difficult in these fearful times, and Zoran Arbutina says people with rational arguments are at a disadvantage.

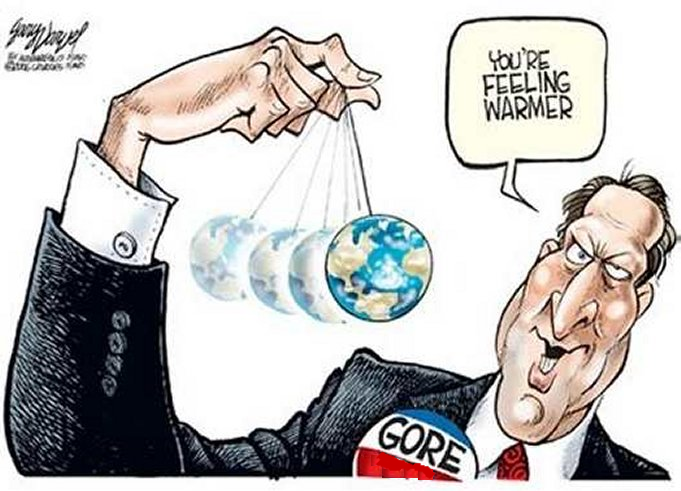
“I want you to panic. I want you to feel the fear I feel every day. … I want you to act as if our house is on fire.” The words spoken by teenage climate activist Greta Thunberg at the World Economic Forum in Davos in January are certain to end up high on the list of the year’s most important quotes.

It’s rare to see someone express the zeitgeist so clearly. It’s as if millions of mainly young people were just waiting for someone to give them the go-ahead to finally do what they needed to do: stand up, take to the streets and speak out against man-made climate change.

In Germany, even more so than in other European countries, it seems the urgent call of the young Swedish activist has unleashed a veritable avalanche of protest and outrage, overrunning everything in its path. These days, panic rules the country — and it’s putting pressure on politicians.

Just do ‘something’

More and more German cities have declared a “climate emergency,” with even the European Parliament recently getting carried away and following suit. Such declarations are essentially symbolic; the climate isn’t any better off as a result, but that’s not the point. It’s all about creating a social climate of fear, of panic.

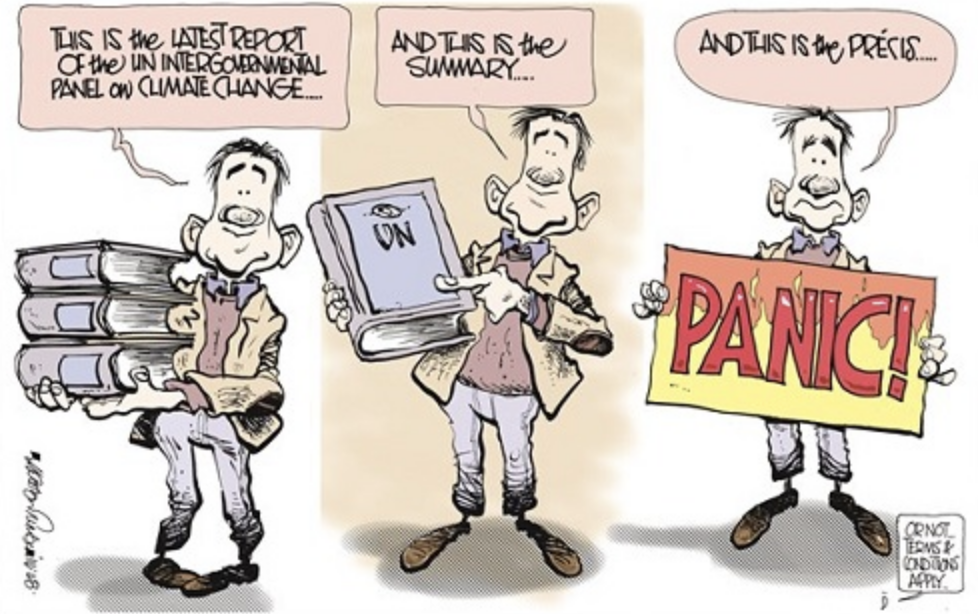
The latest alarming contribution is a new report by environmental think tank Germanwatch, which ranked Germany as the third-most weather-affected country in the world in 2018, after Japan and the Philippines. Germanwatch said its Global Climate Risk Index, published annually, doesn’t allow for conclusions to be drawn about how climate change has influenced extreme weather events, and said its analysis included “statistical uncertainties.” But that’s not important —what matters is the warning that rising temperatures will make extreme weather occurrences more likely. It wasn’t much, but the report was enough to spread fear even further.

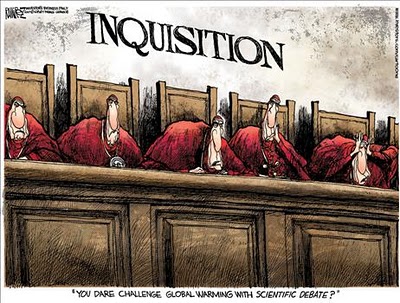
Fear, however, usually isn’t the best guide. When people panic, they rarely make good decisions — and that’s certainly the case for a society. In a democracy, political decisions should be based on rational arguments and reason. In a climate of fear, rational arguments only come out when they help to further the agenda.

Signs of climate change?

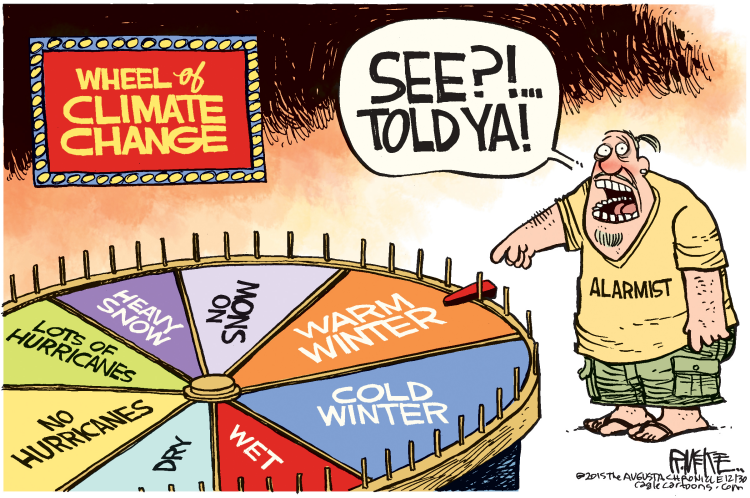
An example: those who question global warming during extreme cold spells (yes, they still happen!) are often informed that there is a difference between climate and weather. If, on the other hand, we go through two dry, hot summers in a row, it’s almost always seen as a sign of runaway climate change.

Activists like to point to allegedly unambiguous scientific findings to make their claims that climate change is upon us. But when a renowned climate researcher like Hans von Storch says that protesters only “mix up” and “exaggerate” everything, his scientific integrity is immediately called into question.

Exaggerated expectations

While climate activists have pressured Germany’s traditional political parties, the Greens have sailed on the waves of the environmental movement and made huge gains in recent elections. But a new conflict awaits on the horizon: should the environmentalists return to power on the federal level, the Greens and their voters will find that they cannot fulfill the raised expectations of their followers. That failure will trigger fresh disappointment, anger and even more fear.

Of course, one can and should argue about climate policy. And naturally, the climate activists have made some good points. But climate policy must be decided as everything else in politics: through societal debate, and the belief in the power of the better argument. Climate change is too important an issue to be left to climate activists alone. Their worries should be taken seriously, as should the worries of many other social groups. But being dominated by the fears of a single group is never a good approach.

Previous Post Shows How Panic Distorts Reality (from last summer)

People who struggle with anxiety are known to have moments of “hair on fire.” IOW, letting your fears take over is like setting your own hair on fire. Currently the media, pandering as always to primal fear instincts, is declaring that the Arctic is on fire, and it is our fault. Let’s see what we can do to help them get a grip.

1. Summer is fire season for northern boreal forests and tundra.

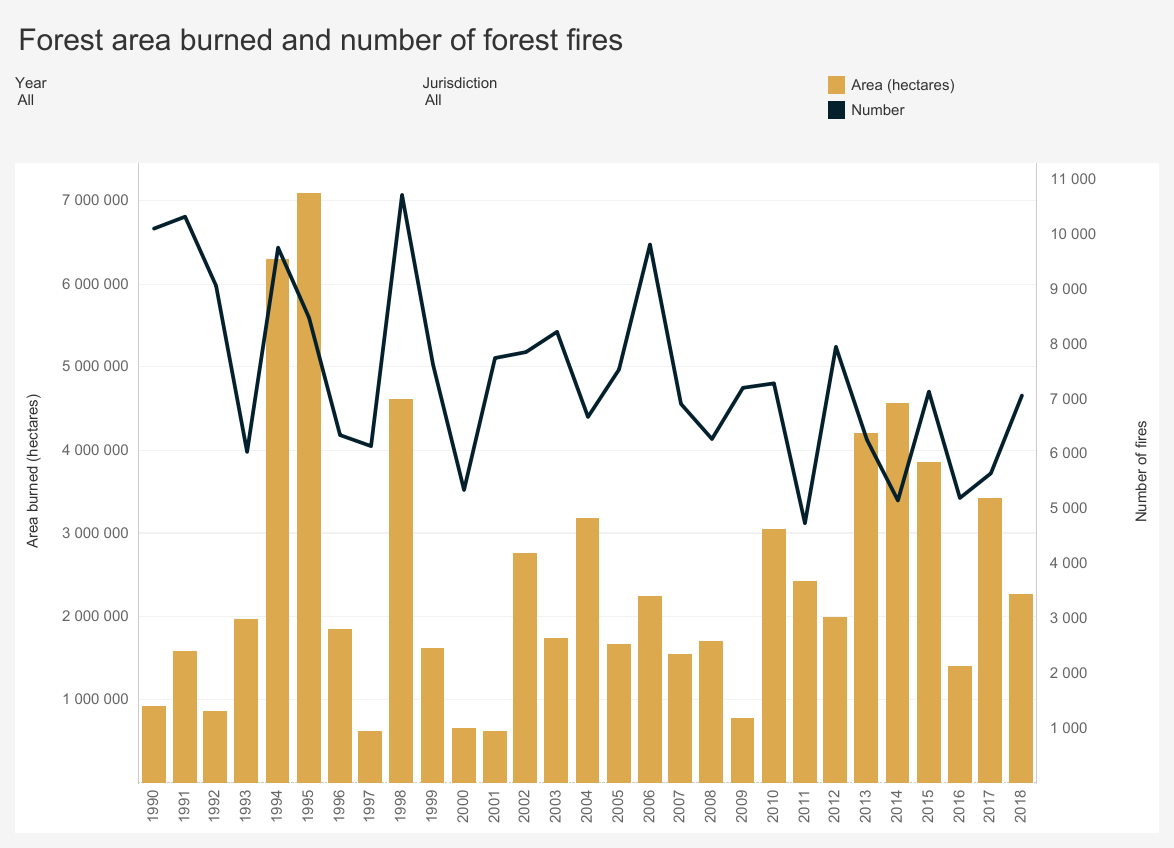
From the Canadian National Forestry Database

Since 1990, “wildland fires” across Canada have consumed an average of 2.5 million hectares a year.

Recent Canadian Forest Fire Activity 2015 2016 2017
Area burned (hectares) 3,861,647 1,416,053 3,371,833
Number of fires 7,140 5,203 5,611

The total area of Forest and other wooded land in Canada  is 396,433,600 (hectares).  So the data says that every average year 0.6% of Canadian wooded area burns due to numerous fires, ranging from 1000 in a slow year to over 10,000 fires and 7M hectares burned in 1995.

2. With the warming since 1980 some years have seen increased areas burning.

From Wildland Fire in High Latitudes, A. York et al. (2017)

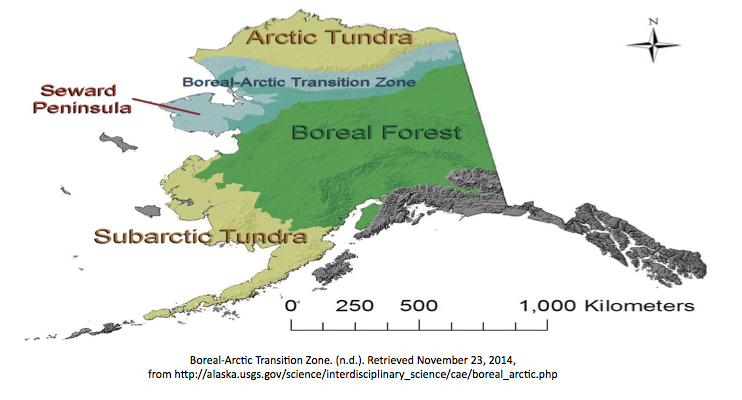
Despite the low annual temperatures and short growing seasons characteristic of northern ecosystems, wildland fire affects both boreal forest (the broad band of mostly coniferous trees that generally stretches across the area north of the July 13° C isotherm in North America and Eurasia, also known as Taiga) and adjacent tundra regions. In fact, fire is the dominant ecological disturbance in boreal forest, the world’s largest terrestrial biome. Fire disturbance affects these high latitude systems at multiple scales, including direct release of carbon through combustion (Kasischke et al., 2000) and interactions with vegetation succession (Mann et al., 2012; Johnstone et al., 2010), biogeochemical cycles (Bond-Lamberty et al., 2007), energy balance (Rogers et al., 2015), and hydrology (Liu et al., 2005). About 35% of global soil carbon is stored in tundra and boreal systems (Scharlemann et al., 2014) that are potentially vulnerable to fire disturbance (Turetsky et al., 2015). This brief report summarizes evidence from Alaska and Canada on variability and trends in fire disturbance in high latitudes and outlines how short-term fire weather conditions in these regions influence area burned.

Climate is a dominant control of fire activity in both boreal and tundra ecosystems. The relationship between climate and fire is strongly nonlinear, with the likelihood of fire occurrence within a 30-year period much higher where mean July temperatures exceed 13.4° C (56° F) (Young et al., 2017). High latitude fire regimes appear to be responding rapidly to recent environmental changes associated with the warming climate. Although highly variable, area burned has increased over the past several decades in much of boreal North America (Kasischke and Turetsky, 2006; Gillett et al., 2004). Since the early 1960s, the number of individual fire events and the size of those events has increased, contributing to more frequent large fire years in northwestern North America (Kasischke and Turetsky, 2006). Figure 1 shows annual area burned per year in Alaska (a) and Northwest Territories (b) since 1980, including both boreal and tundra regions.

[Comment: Note that both Alaska and NW Territories see about 500k hectares burned on average each year since 1980.  And in each region, three years have been much above that average, with no particular pattern as to timing.]

Recent large fire seasons in high latitudes include 2014 in the Northwest Territories, where 385 fires burned 8.4 million acres, and 2015 in Alaska, where 766 fires burned 5.1 million acres (Figs. 1 & 2)—more than half the total acreage burned in the US (NWT, 2015; AICC, 2015). Multiple northern communities have been threatened or damaged by recent wildfires, notably Fort McMurray, Alberta, where 88,000 people were evacuated and 2400 structures were destroyed in May 2016. Examples of recent significant tundra fires include the 2007 Anaktuvuk River Fire, the largest and longest-burning fire known to have occurred on the North Slope of Alaska (256,000 acres), which initiated widespread thermokarst development (Jones et al., 2015). An unusually large tundra fire in western Greenland in 2017 received considerable media attention.

Large fire events such as these require the confluence of receptive fuels that will promote fire growth once ignited, periods of warm and dry weather conditions, and a source of ignition—most commonly, convective thunderstorms that produce lightning ignitions. High latitude ecosystems are characterized by unique fuels—in particular, fast-drying beds of mosses, lichens, resinous shrubs, and accumulated organic material (duff) that underlie dense, highly flammable conifers. These understory fuels cure rapidly during warm, dry periods with long daylight hours in June and July. Consequently, extended periods of drought are not required to increase fire danger to extreme levels in these systems.

Most acreage burned in high latitude systems occurs during sporadic periods of high fire activity; 50% of the acreage burned in Alaska from 2002 to 2010 was consumed in just 36 days (Barrett et al., 2016). Figure 3 shows cumulative acres burned in the four largest fire seasons in Alaska since 1990 (from Fig. 1) and illustrates the varying trajectories of each season. Some seasons show periods of rapid growth during unusually warm and dry weather (2004, 2009, 2015), while others (2004 and 2005) were prolonged into the fall in the absence of season-ending rain events. In 2004, which was Alaska’s largest wildfire season at 6.6 million acres, the trajectory was characterized by both rapid mid-season growth and extended activity into September. These different pathways to large fire seasons demonstrate the importance of intraseasonal weather variability and the timing of dynamical features. As another example, although not large in total acres burned, the 2016 wildland fire season in Alaska was more than 6 months long, with incidents requiring response from mid-April through late October (AICC, 2016).

3. Wildfires are part of the ecology cycle making the biosphere sustainable.

Forest Fire Ecology: Fire in Canada’s forests varies in its role and importance.

In the moist forests of the west coast, wildland fires are relatively infrequent and generally play a minor ecological role.

In boreal forests, the complete opposite is true. Fires are frequent and their ecological influence at all levels—species, stand and landscape—drives boreal forest vegetation dynamics. This in turn affects the movement of wildlife populations, whose need for food and cover means they must relocate as the forest patterns change.

lThe Canadian boreal forest is a mosaic of species and stands. It ranges in composition from pure deciduous and mixed deciduous-coniferous to pure coniferous stands.

The diversity of the forest mosaic is largely the result of many fires occurring on the landscape over a long period of time. These fires have varied in frequency, intensity, severity, size, shape and season of burn.

The fire management balancing act: Fire is a vital ecological component of Canadian forests and will always be present.

Not all wildland fires should (or can) be controlled. Forest agencies work to harness the force of natural fire to take advantage of its ecological benefits while at the same time limiting its potential damage and costs.

Tundra Fire Ecology

From Arctic tundra fires: natural variability and responses to climate change, Feng Sheng Hu et al. (2015)

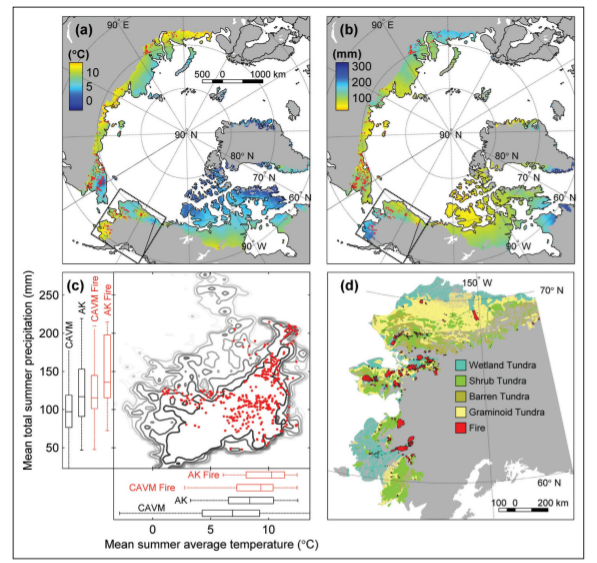
Circumpolar tundra fires have primarily occurred in the portions of the Arctic with warmer summer conditions, especially Alaska and northeastern Siberia (Figure 1). Satellite-based estimates (Giglio et al. 2010; Global Fire Emissions Database 2015) show that for the period of 2002–2013, 0.48% of the Alaskan tundra has burned, which is four times the estimate for the Arctic as a whole (0.12%; Figure 1). These estimates encompass tundra ecoregions with a wide range of fire regimes. For instance, within Alaska, the observational record of the past 60 years indicates that only 1.4% of the North Slope ecoregion has burned (Rocha et al. 2012); 68% of the total burned area in this ecoregion was associated with a single event, the 2007 AR Fire.

The Noatak and Seward Peninsula ecoregions are the most flammable of the tundra biome, and both contain areas that have experienced multiple fires within the past 60 years (Rocha et al. 2012). This high level of fire activity suggests that fuel availability has not been a major limiting factor for fire occurrence in some tundra regions, probably because of the rapid post-fire recovery of tundra vegetation (Racine et al. 1987; Bret-Harte et al. 2013) and the abundance of peaty soils.

However, the wide range of tundra-fire regimes in the modern record results from spatial variations in climate and fuel conditions among ecoregions. For example, frequent tundra burning in the Noatak ecoregion reflects relatively warm/dry climate conditions, whereas the extreme rarity of tundra fires in southwestern Alaska reflects a wet regional climate and abundant lakes that act as natural firebreaks.

Fire alters the surface properties, energy balance, and carbon (C) storage of many terrestrial ecosystems. These effects are particularly marked in Arctic tundra (Figure 5), where fires can catalyze biogeochemical and energetic processes that have historically been limited by low temperatures.

In contrast to the long-term impacts of tundra fires on soil processes, post-fire vegetation recovery is unexpectedly rapid. Across all burned areas in the Alaskan tundra, surface greenness recovered within a decade after burning (Figure 6; Rocha et al. 2012). This rapid recovery was fueled by belowground C reserves in roots and rhizomes, increased nutrient availability from ash, and elevated soil temperatures.

At present, the primary objective for wildland fire management in tundra ecosystems is to maintain biodiversity through wildland fires while also protecting life, property, and sensitive resources. In Alaska, the majority of Arctic tundra is managed under the “Limited Protection” option, and most natural ignitions are managed for the purpose of preserving fire in its natural role in ecosystems. Under future scenarios of climate and tundra burning, managing tundra fire is likely to become increasingly complex. Land managers and policy makers will need to consider trade-offs between fire’s ecological roles and its socioeconomic impacts.

4. Arctic fire regimes involve numerous interacting factors.

Frequent Fires in Ancient Shrub Tundra: Implications of Paleorecords for Arctic Environmental Change
Philip E. Higuera et al. (2008)

Although our fire-history records provide unique insights into the potential response of modern tundra ecosystems to climate and vegetation change, they are imperfect analogs for future fire regimes. First, ongoing vegetation changes differ from those of the late-glacial period: several shrub taxa (Salix, Alnus, and Betula) are currently expanding into tundra [10], whereas Betula was the primary constituent of the ancient shrub tundra. The lower flammability of Alnus and Salix compared to Betula could make future shrub tundra less flammable than the ancient shrub tundra. Second, mechanisms of past and future climate change also differ. In the late-glacial and early-Holocene periods, Alaskan climate was responding to shrinking continental ice volumes, sea-level changes, and amplified seasonality arising from changes in the seasonal cycle of insolation [13]; in the future, increased concentrations of atmospheric greenhouse gases are projected to cause year-round warming in the Arctic, but with a greater increase in winter months [8]. Finally, we know little about the potential effects of a variety of biological and physical processes on climate-vegetation-fire interactions. For example, permafrost melting as a result of future warming [8] and/or increased burning [24] could further facilitate fires by promoting shrub expansion [10], or inhibit fires by increasing soil moisture [24].

5. The Arctic has adapted to many fire regimes stronger than today’s activity.

The Burning Tundra: A Look Back at the Last 6,000 Years of Fire in the Noatak National Preserve, Northwestern Alaska

Fire history in the Noatak also suggests that subtle changes in vegetation were linked to changes in tundra fire occurrence. Spatial variability across the study region suggests that vegetation responded to local-scale climate, which in turn influenced the flammability of surrounding areas. This work adds to evidence from ‘ancient’ shrub tundra in the southcentral Brooks Range suggesting that vegetation change will likely modify tundra fire regimes, and it further suggests that the direction of this impact will depend upon the specific makeup of future tundra vegetation. Ongoing climate-related vegetation change in arctic tundra such as increasing shrub abundance in response to warming temperatures (e.g., Tape et al. 2006), could both increase (e.g., birch) or decrease (e.g., alder) the probability of future tundra fires.

This study provides estimated fire return intervals (FRIs) for one of the most flammable tundra ecosystems in Alaska. Fire managers require this basic information, and it provides a valuable context for ongoing and future environmental change. At most sites, FRIs varied through time in response to changes in climate and local vegetation. Thus, an individual mean or median FRI does not capture the range of variability in tundra fire occurrence. Long-term mean FRIs in many periods were both shorter than estimates based on the past 60 years and statistically indistinct from mean FRIs found in Alaskan boreal forests (e.g., Higuera et al. 2009) (Figure 2). These results imply that tundra ecosystems have been resilient to relatively frequent burning over the past 6,000 years, which has implications for both managers and scientists concerned about environmental change in tundra ecosystems. For example, increased tundra fire occurrence could negatively impact winter forage for the Western Arctic Caribou Herd (Joly et al. 2009). Although the Noatak is only a portion of this herd’s range, our results indicate that if caribou utilized the study area over the past 6,000 years, then they have successfully co-existed with relatively frequent fire.
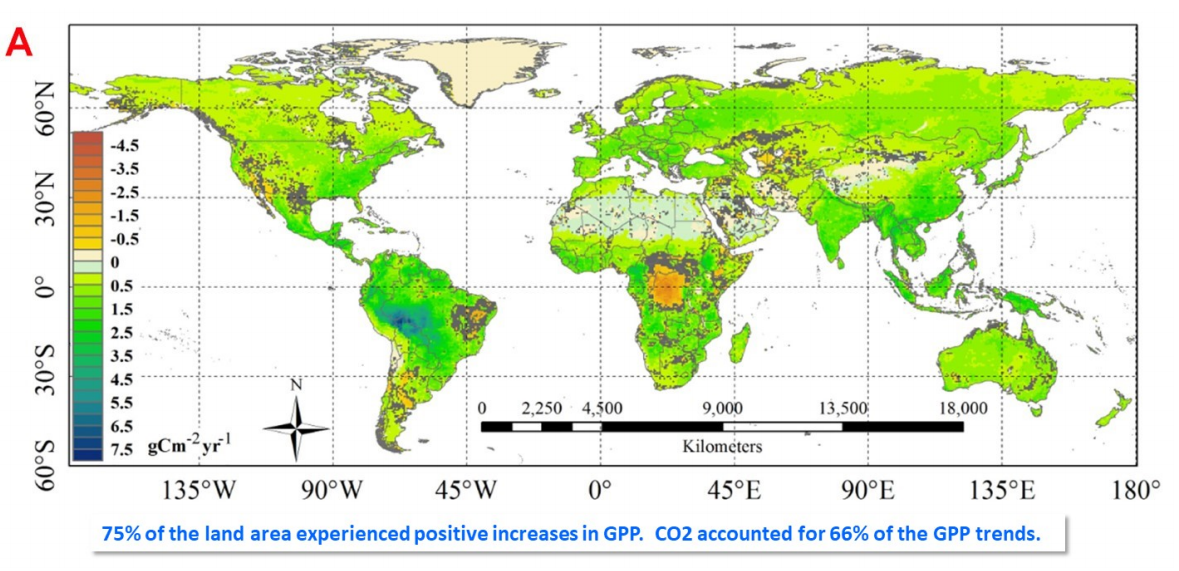
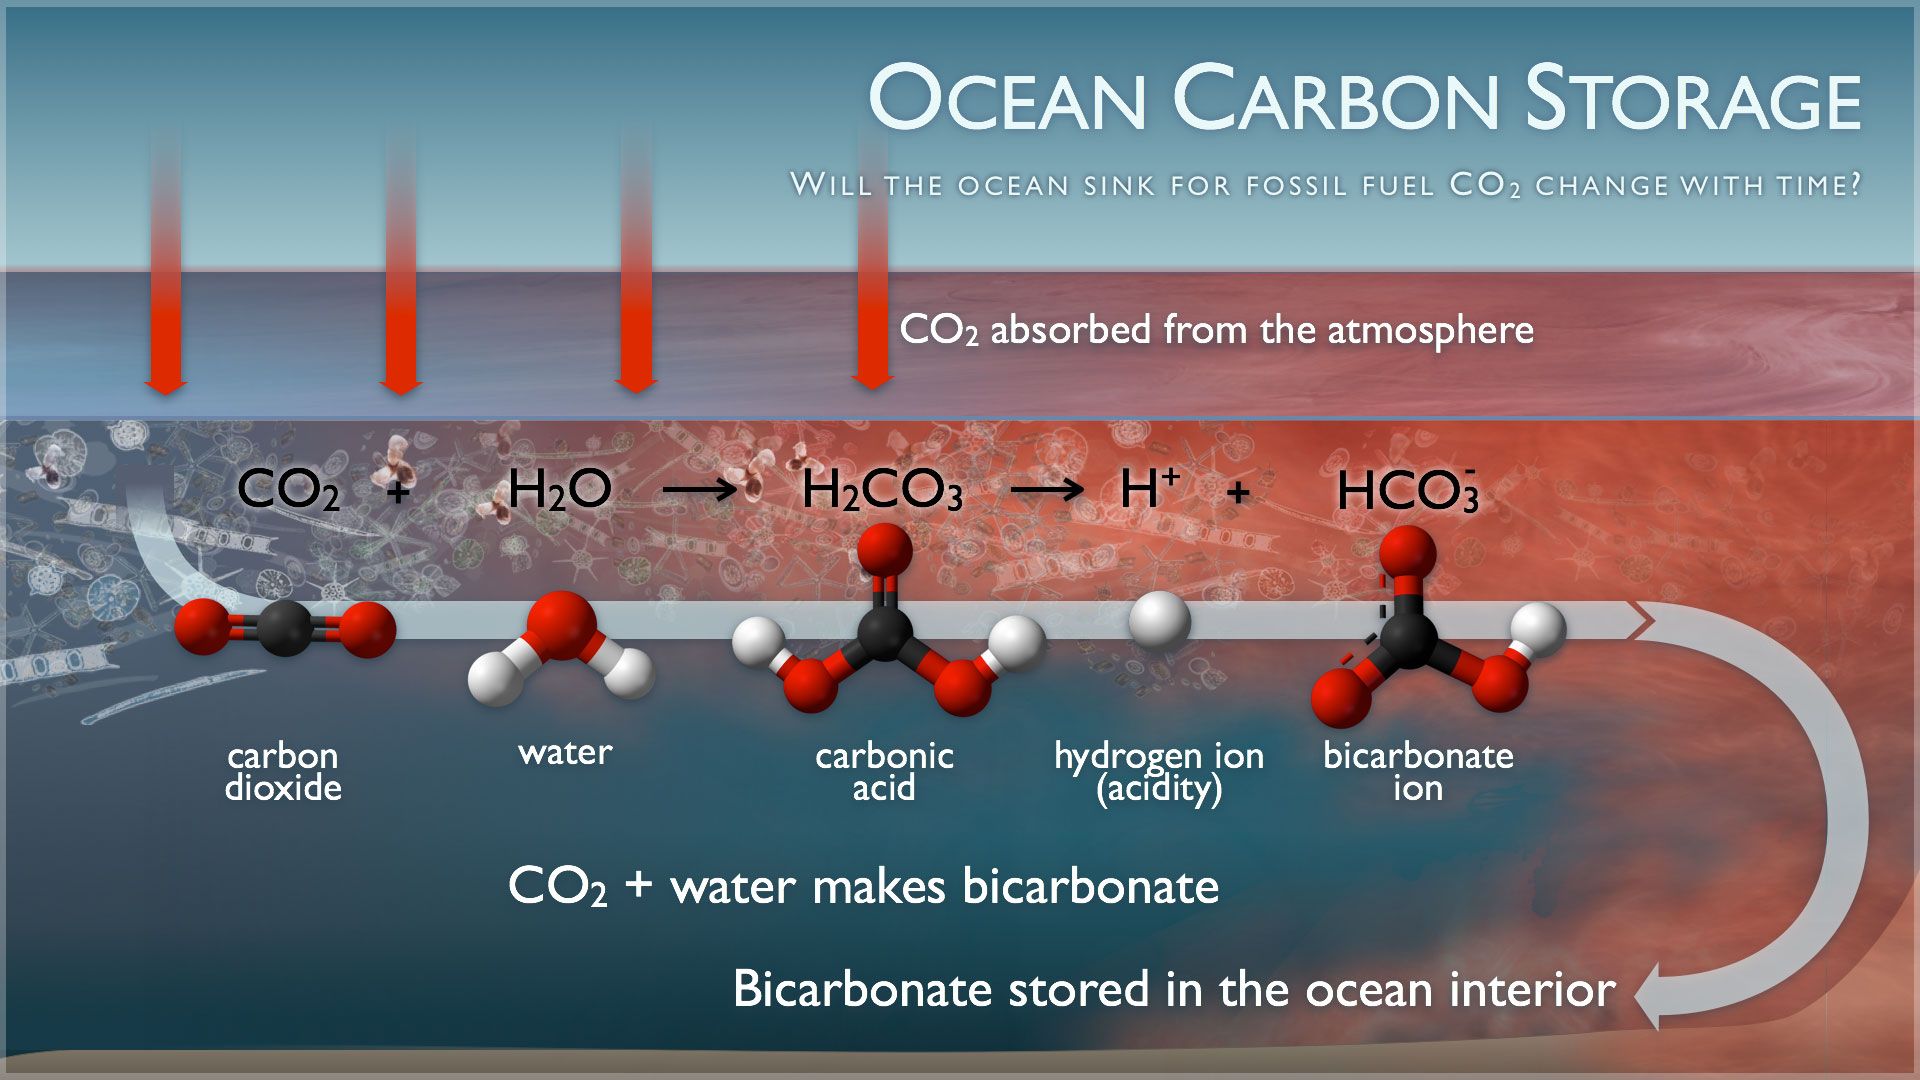
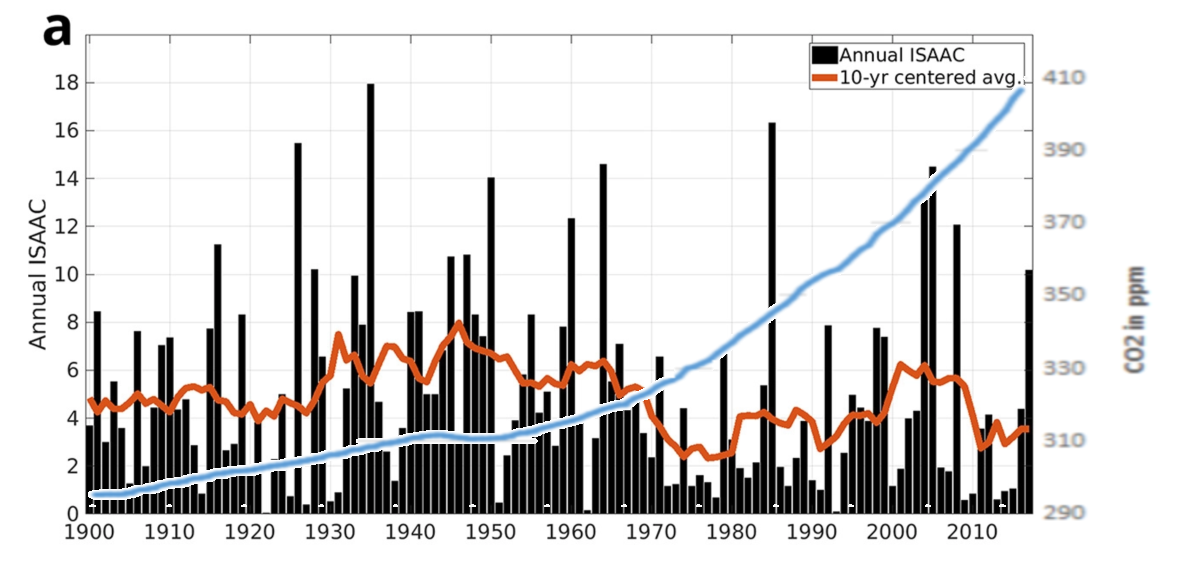
 

Tipping Points Confuse Social and Earth Science

In the drive to push public opinion over the top regarding global warming/climate change, the media is increasingly filled with references to climate “tipping points.”  For example, some months ago an IPCC spokesperson claimed a climate disaster is now happening each and every week.  And the media abounds with reports to press home the point. Here are some of the current disasters caused by climate change, ripped (as they say) from the headlines.

Birds are shrinking as the climate warms

Climate change-related deaths and damage on the rise

Europe Could Face Annual Extreme Heat Waves Due to Climate Change

Food Prices Expected To Jump Next Year Due To Climate Change

Climate change taking serious toll on human health: WHO report

Climate Crisis Causing Hunger for Millions of Africans

How climate change is causing more premature births

Et cetera, et cetera. (A complete list would provide more than one disaster for every week of the year.)

IOW, as Pys.org reported, all this hype may make this year the tipping point: The year the world woke up to the climate emergency.

Background on the Use of “Tipping Points”

The context for understanding the rise of the “tipping point” notion is provided by a 2018 paper in Environmental Research Letters Defining tipping points for social-ecological systems scholarship—an interdisciplinary literature review. As the title suggests the researchers are not studying the earth, but rather people’s perceptions about the earth. This growing field of environmental psychology confirms how “climate change” muddles social and physical sciences. Excerpts in italics with my bolds

Abstract

The term tipping point has experienced explosive popularity across multiple disciplines over the last decade. Research on social-ecological systems (SES) has contributed to the growth and diversity of the term’s use. The diverse uses of the term obscure potential differences between tipping behavior in natural and social systems, and issues of causality across natural and social system components in SES. This paper aims to create the foundation for a discussion within the SES research community about the appropriate use of the term tipping point, especially the relatively novel term ‘social tipping point.’

We review existing literature on tipping points and similar concepts (e.g. regime shifts, critical transitions) across all spheres of science published between 1960 and 2016 with a special focus on a recent and still small body of work on social tipping points. We combine quantitative and qualitative analyses in a bibliometric approach, rooted in an expert elicitation process.

Historical Analysis and Concerns

We find that the term tipping point became popular after the year 2000—long after the terms regime shift and critical transition—across all spheres of science. We identify 23 distinct features of tipping point definitions and their prevalence across disciplines, but find no clear taxonomy of discipline-specific definitions. Building on the most frequently used features, we propose definitions for tipping points in general and social tipping points in SES in particular.

Being located at the intersection between the social and natural sciences, SES researchers need to tread carefully when borrowing concepts from other disciplines. Such a move often involves the crossing of ontological boundaries, where the metaphorical use of a concept can mask important differences between two objects of study. The two phenomena included in the analogy should be similar in the sense that they can be characterized by common laws or principles. The success of the analogy depends on whether attributes of tipping points in the target domain can be tested and assessed similar to the one in the source domain (Daniel 1955, Gentner 1983). However, SES research pays little attention to whether the presumed observation of tipping behavior in a social system is conceptually equal or (partly) different than tipping processes in an ecological system. It remains unknown whether tipping points in natural systems, such as a lake or the climate, display the same underlying mechanisms as tipping points in social systems, such as in financial markets or political institutions.

The tipping point concept traces its origins back to scientific papers in chemistry (Hoadley 1884) and mathematics (Poincare´ 1885), which refer to a qualitative change in a system described mathematically as a bifurcation. Bifurcation theory is still used today in mathematics, physics, complex systems science, and related fields.

In the social sciences, tipping points originated much later to address neighborhood dynamics of racial segregation in political science (Grodzins 1957), sociology/urban planning (Wolf 1963), and economics (Schelling 1978). Social scientists began to develop similar concepts of social change without the tipping point language. For example, sociologist Mark Granovetter (1978) uses the term threshold to understand the differences in individuals’ decisions to engage in a collective behavior, such as rioting.

Whether or not it can be attributed to Malcolm Gladwell’s book The Tipping Point (2000), starting around 2005, the term was widely adopted among climate scientists (Russill and Nyssa 2009, Kopp et al 2016) to describe rapid, non-linear change in parts of the climate system. Previously this phenomenon had been referred to with different terminology, such as critical points, but now climate scientists embraced tipping point language, with three papers using tipping point terminology to focus on ice sheet dynamics in the Arctic (Holland et al 2006, Lindsay and Zhang 2005, Winton 2006). A 2008 paper introduced the idea of tipping elements in the climate system, defined as subsystems of the climate system that can experience abrupt change,‘triggering a transition to a new state.’

The historical account of the movement of the concept from its origins in mathematics and chemistry to the social sciences, popular discourse and back to mathematical modeling in the climate sciences raises important scientific questions.

The increasingly frequent use of the concept of tipping points in both the natural and social sciences could be scientifically questionable: sociological and political tipping points might be very different phenomena than climatic tipping points, even if both natural and social systems may be subject to rapid qualitative change. If institutional tipping and ecosystem tipping are different ‘things in nature’— different ontological entities—scientific language should not treat them as the same. Scientific language should clarify rather than veil potential differences between tipping points in different fields.

Phenomena in nature—the objects of tipping point research Different fields of science deploy tipping point terminology to study vastly different real-world phenomena. In the natural sciences (Ecology, Climate and Earth System Science), scholars are primarily interested in the tipping of ecological systems, e.g. the eutrophication of lakes, and of larger Earth System components, also called climate tipping elements (e.g. Arctic ice sheets). This research crosses multiple scales of interest, but focuses on a shared mechanism of change: positive, self-reinforcing feedbacks moving a system into a different stability domain. Key research challenges include the limited reversibility of a system to its previous state and significant predictive challenges related to tipping points.

Conclusions

To conclude, we have proposed a unifying definition for tipping points, building on the most frequent themes identified in our analysis: a tipping point is a threshold at which small quantitative changes in the system trigger a non-linear change process that is driven by system-internal feedback mechanisms and inevitably leads to a qualitatively different state of the system, which is often irreversible.  This definition establishes a minimum set of four constitutive features of tipping points that apply across disciplines:

    • multiple stable states;
    • non-linear change;
    • feedbacks as driving mechanism; 
    • limited reversibility. 

If these four essential characteristics are given, the use of the term tipping point is justified.  However, whether it is possible to apply these tools to social and social-ecological change phenomena remains unclear and is a subject that requires future research.

Our research found that the tipping point concept is applied to a vast array of change processes, ranging from ice sheet dynamics to societal transformations, which might mask ontological differences between these diverse phenomena. Concerned about the pattern of terminological replacement—the use of tipping point language instead of previously existing terms—and its potential effects on the quality of science, we encourage researchers to critically assess their terminological choices and avoid ‘conceptual amnesia’.

My Comment

Besides the issue of confusing natural and social processes, the paper only touched tangentially on three related problems applying this terminology to global warming/climate change.  Firstly, in the natural world there are shifts between multiple stable states, in some cases reversing back and forth in cyclical patterns.  For example, paleoclimatologists have mapped the earth’s oscillations between “hot house” and “ice house.”

Secondly, headlines like those above always portray change as negative and destructive.  In both natural and social tipping points there can be desirable, transformative shifts, not just adverse, gloomy results.
Thirdly, as Brothers Judd warn, there is less than meets the eye in claims of tipping points.  From their review of Gladwell’s book:

As a general matter Gladwell’s Tipping Point idea, like Darwin’s idea of Evolution, is grounded more in literary metaphor than in science. If you ask, as Gladwell does, why Hush Puppies suddenly became fashionable again after years of declining or stagnant sales, the answer must be that they hit a Tipping Point. If you ask why they stayed unpopular for so long, the answer must be there were no Tipping Points during that time. Why did the book Divine Secrets of the Ya-Ya Sisterhood become a best seller, while Rebecca Wells’s previous books hadn’t, or other (better) novels didn’t ? One hit a Tipping Point, the others didn’t. But this doesn’t really add anything to our understanding of the human behavior and desires that fueled the crazes nor does it help us to determine how to tip other products and processes in the future. Gladwell’s argument, like all pseudoscience, is a closed loop–if something tips then it hit a Tipping Point; if it doesn’t, then it didn’t. Rather than explaining what happened, the metaphor, once accepted, stifles intelligent analysis. The fact that something happened comes to seem a sufficient explanation and a justification for saying that the process occurred; the actual elements of this theoretical process need never be demonstrated, nor tested; it’s as if the circular beauty of the metaphor precludes questioning its validity.

Finally, as the critique shows, tipping points are like climate change itself:  Applying labels to something that has already happened, with no predictive utility.

Polar Bears Are Alright (How Dare You Say That!)

Polar bear walking the streets in Norilsk, Russia © Reuters / Stringer

Helen Buyniski writes an op ed at Russia Today The REAL inconvenient truth: Polar bears thriving in spite of climate change, but saying this gets scientists fired.  Others have covered this disgraceful episode, but the article provides some important details and European perspective. Excerpts in italics with my bolds.

Polar bears have become the poster child for climate change, their population supposedly devastated by shrinking ice cover. But when one zoologist disproved the myth, she came under the inquisition of the climate church.

Zoologist and polar bear expert Susan Crockford was shunned by the academy for her insistence that despite the polar bear’s status as a climate change icon, the warming planet had actually caused the species to thrive. She did not deny climate change – merely the idea that it was harming the bears.

After losing her contract as an adjunct professor at Canada’s University of Victoria, where she worked for 15 years, she has been vindicated by a report from northern Canada confirming her theory that polar bears are climate change’s beneficiaries, rather than its victims.

Footage of an emaciated polar bear, captioned “this is what climate change looks like,” yanked at the world’s heartstrings when it was posted on National Geographic in 2017. Eight months later, the publication changed the caption to “this is what starvation looks like,” admitting there was no way to tell why the bear was starving. But it wasn’t the first sick bear to be pressed into service for the environmentalist cause, and it won’t be the last. Climate change’s PR team may have made an unfortunate choice in elevating the polar bear to icon status.

© Reuters / Mal Langsdon

The Inuit groups who actually live with the bears in northern Canada seem to agree with Crockford’s claim that bear populations are increasing, as documented in a court affidavit by the director of wildlife management for the Nunavik Marine Region Wildlife Board. Faced with cuts to their bear-hunting quota by an environment ministry concerned with population numbers, Nunavut residents have seen an “increase in the polar bear population and a particularly notable increase since the 1980s,” the director attested.

Nor are the (plentiful) bears suffering or sickly: “Nunavik Inuit report that it is rare to see a skinny bear and most bears are observed to be healthy,” the affidavit continued. Locals are, however, reportedly concerned about outside perception of declining polar bear numbers, fueled by groups like the World Wildlife Federation (WWF), which explicitly described the bears as the “poster child for the impacts of climate change on species.”

Crockford has been saying for years that bear populations are either growing or stable – even though they may go down in some habitats, they increase in others. She does say starvation is the most common cause of death for adult bears, but there are many factors that could lead them to the state captured by National Geographic – from too many bears, straining food supplies and leaving slower hunters out-competed; to broken jaws, other injuries, and disease.

But as ice cover decreases, she claims, polar bears thrive. The ringed seals that are one of their primary food sources multiply in the warmer water, and polar bear populations have been steady or on the rise since 2005, all predictions of doom aside.

Polar bear populations hit record highs in 2018, Crockford revealed in last year’s State of the Polar Bear report, whose publication by the climate skeptic Global Warming Policy Foundation was sparsely noted outside fellow-traveler sites like Climate Depot. Despite sea ice depletion to levels not expected until 2050, which was supposed to decimate two thirds of the bear population, the animals are thriving.

In fact, they’re thriving too much, according to the humans who have to live with them. The Nunavut government sounded the alarm last year: “Inuit believe there are now so many bears that public safety has become a major concern… the polar bear may have exceeded the coexistence threshold.” Two locals were killed in bear attacks in the region. Nor is Canada the only habitat affected – in 2017, they laid siege to the Siberian town of Ryrkaypiy, invading human homes and terrifying the locals.

Even the WWF has softened its predictions of a polar bear apocalypse, admitting that only one of the 19 bear populations are in decline as of 2017 while two are increasing and seven are stable. Yet the International Union for Conservation of Nature insists the numbers will plummet 30 percent by 2050, linking population decline with dwindling sea ice.

Crockford’s view – even though it’s based on years of research and previous studies – is considered heretical and scorned by climate doomsayers, for whom no deviation from orthodoxy is permitted, even when the facts do not match the propaganda.

The University of Victoria declined to renew her contract in May this year after 15 years of employment despite having promoted her work in the past. The school’s speakers’ bureau, which had sent her out for ten years to give lectures to schools and adult groups, dropped her like a hot potato in May 2017 after a vague outside complaint about her “lack of balance” allegedly triggered a kafkaesque cascade of deplatforming culminating in her removal. The school did not deny the reason she was let go was because of her heretical polar bear science, but would not confirm it either.

global-warming-inquisition

Misrepresenting thriving wildlife populations as a harbinger of their doom is nothing new for nature photographers and documentarians – David Attenborough’s depiction of suicidal walruses plummeting from cliffs “because of climate change” was recently exposed as less than the whole truth.Walruses ‘hauled out’ on land are spooked easily and will plummet from cliffs in their rush to return to the safety of the water. These stampedes can be triggered by polar bears, who do so deliberately in order to feast on the dead walruses left trampled or smashed at the cliff bottom, or by overhead planes (or the drones used for documentary filming).

One of the most notorious examples of phony wildlife tragedy gave rise to the myth of suicidal, cliff-jumping lemmings. A 1958 Disney nature documentary captured the little creatures marching off a precipice, seemingly to their doom, teaching viewers a valuable lesson about blindly following a leader, but that scene was staged by the filmmakers for the sake of added drama.

Climate change proponents may not be staging mass animal suicide to convince the public, but their effort to torpedo the career of a scientist for reasons unrelated to the integrity of her research is equally unprofessional. The climate change debate must be had in good faith by scientific professionals on all sides, with participants free to voice their research-based dissent with prevailing orthodoxy, or it is not science but doctrine.


11 Empty Climate Claims

Below are a series of rebuttals of the 11 most common climate alarmists’ claims such as those made in the recently released Fourth National Climate Assessment Report.[2] The authors of these rebuttals are all recognized experts in the relevant fields.  H/T Joseph D’Aleo for compiling work by many experts at his website ACRESEARCH Fact Checking Climate Claims.  Excerpts in italics with my bolds.

For each alarmist claim, a summary of the relevant rebuttal is provided below along with a link to the full text of the rebuttal, which includes the names and the credentials of the authors of each rebuttal.

Claim: Heat Waves are increasing at an alarming rate and heat kills.
Fact:  They have been decreasing since the 1930s in the U.S. and globally.

There has been no detectable long-term increase in heat waves in the United States or elsewhere in the world. Most all-time record highs here in the U.S. happened many years ago, long before mankind was using much fossil fuel. Thirty-eight states set their all-time record highs before 1960 (23 in the 1930s!). Here in the United States, the number of 100F, 95F and 90F days per year has been steadily declining since the 1930s. The Environmental Protection Agency Heat Wave Index confirms the 1930s as the hottest decade.

Days over 95F vs. CO2Detailed Rebuttal and Authors: Heat Waves (08/19/19)

Claim: Global warming is causing more hurricanes and stronger hurricanes.
Fact:  Hurricane activity is flat to down since 1900, landfalls in the US are declining

The long-term linear trend in the number and intensity of global hurricane activity has remained flat or down. Hurricane activity does vary year-to-year and over longer periods as short-term ocean cycles like El Nino/La Nina and multidecadal cycles in the Pacific (PDO) and Atlantic (AMO) ocean temperature regimes favor changes in activity levels and some basins over others.

Credible data show this is true despite much better open ocean detection than before the 1960s when many short-lived storms at sea would have been missed as there were no satellites, no aircraft reconnaissance, no radar, no buoys and no automated weather stations.


Detailed Rebuttal and Authors: AC Rebuttal Hurricanes (10/19/19).

Claim: Global warming is causing more and stronger tornadoes.
Fact:  The number of strong tornadoes have declined over the last half century

Tornadoes are failing to follow “global warming” predictions. Strong tornadoes have seen a decline in frequency since the 1950s. The years 2012, 2013, 2014, 2015 and 2016 all saw below average to near record low tornado counts in the U.S. since records began in 1954. 2017 rebounded only to the long-term mean. 2018 ranked well below the 25thpercentile. Tornadoes increased this spring as extreme cold and late snow clashed with southeast warmth to produce a series of strong storms with heavy rains and severe weather including tornadoes. May ranked among the biggest months and the season rebounded after 7 quiet years above the 50th percentile.

Detailed Rebuttal and Authors: AC Rebuttals Tornadoes (08/20/19)

Claim: Global warming is increasing the magnitude and frequency of droughts and floods.
Fact: Droughts and floods have not changed since we’ve been using fossil fuels

Our use of fossil fuels to power our civilization is not causing droughts or floods. NOAA found there is no evidence that floods and droughts are increasing because of climate change.

The number, extend or severity of these events does increase dramatically for a brief period of years at some locations from time to time but then conditions return to more normal. This is simply the long-established constant variation of weather resulting from a confluence of natural factors.

Detailed Rebuttal and Authors: AC Rebuttals Droughts and Floods (08/22/19

Claim: Global Warming has increased U.S. Wildfires.
Fact: Wildfires have been decreasing since 1800s. The increase in damage in recent years is due to population growth in vulnerable areas and poor forest management.

Wildfires are in the news almost every late summer and fall. The National Interagency Fire Center has recorded the number of fires and acreage affected since 1985. This data show the number of fires trending down slightly, though the acreage burned had increased before leveling off over the last 20 years.

The NWS tracks the number of days where conditions are conducive to wildfires when they issue red-flag warnings. It is little changed.

Detailed Rebuttal and Authors: AC Rebuttal Wildfires 080719

Claim: Global warming is causing snow to disappear.
Fact: Snowfall is increasing in the fall and winter in the Northern Hemisphere and North America with many records being set.

This is one claim that has been repeated for decades even as nature showed very much the opposite trend with unprecedented snows even in the big coastal cities. Every time they repeated the claim, it seems nature upped the ante more.

Alarmists have eventually evolved to crediting warming with producing greater snowfall, because of increased moisture but the snow events in recent years have usually occurred in colder winters with high snow water equivalent ratios in frigid arctic air.

Detailed Rebuttal and Authors: AC Rebuttal Snow (09/19/19)

Claim: Global warming is resulting in rising sea levels as seen in both tide gauge and satellite technology.
Fact: The rate of global sea level rise on average has fallen by 40% the last century. Where it is increasing – local factors such as land subsidence are to blame.

This claim is demonstrably false. It really hinges on this statement: “Tide gauges and satellites agree with the model projections.” The models project a rapid acceleration of sea level rise over the next 30 to 70 years. However, while the models may project acceleration, the tide gauges clearly do not.

All data from tide gauges in areas where land is not rising or sinking show instead a steady linear and unchanging sea level rate of rise from 4 up to 6 inches/century, with variations due to gravitational factors. It is true that where the land is sinking as it is in the Tidewater area of Virginia and the Mississippi Delta region, sea levels will appear to rise faster but no changes in CO2 emissions would change that.

Detailed Rebuttal and Authors: Rebuttal – Sea Level (01/18/19)

Claim: Arctic, Antarctic and Greenland ice loss is accelerating due to global warming.
Fact: The polar ice varies with multidecadal cycles in ocean temperatures. Current levels are comparable to or above historical low levels

Satellite and land surface temperature records and sea surface temperatures show that both the East Antarctic Ice Sheet and the West Antarctic Ice Sheet are cooling, not warming and glacial ice is increasing, not melting. Satellite and land surface temperature measurements of the southern polar area show no warming over the past 37 years. Growth of the Antarctic ice sheets means the sea level rise is not being caused by melting of polar ice and, in fact, is slightly lowering the rate of rise. Satellite Antarctic temperature records show 0.02C/decade cooling since 1979. The Southern Ocean around Antarctica has been getting sharply colder since 2006. Antarctic sea ice is increasing, reaching all-time highs. Surface temperatures at 13 stations show the Antarctic Peninsula has been sharply cooling since 2000.

Arctic temperature records show that the 1920s and 1930s were warmer than in the 2000s. Official historical fluctuations of Arctic sea ice begin with the first satellite images in 1979. That happens to coincide with the end of the recent 1945–1977 global cold period and the resulting maximum extent of Arctic sea ice. During the warm period from 1978 until recently, the extent of sea ice has diminished, but increased in the past several years. The Greenland ice sheet has also grown with cooling after an anomalously warm 2012.

Detailed Rebuttal and Authors: AC Rebuttal Arctic, Antarctic and Greenland (05/19/19)

Claim: Global warming responsible for record July warmth in Alaska.
Fact:  Alaska July 2019 heat records resulted from a warm North Pacific and reduced ice in the Bering Sea late winter due to strong storms. The opposite occurred with record cold in 2012.

Alaska climate (averages and extremes) varies over time but the changes can be explained by natural variability in the North Pacific Ocean, which controls the climate regime in downstream land areas. These ocean temperature regimes (modes of the Pacific Decadal Oscillation or PDO) improves season-to-season and year-to-year climate forecasts for North America because of its strong tendency for multi-season and multi-year persistence. The PDO correlates well with tendencies for El Nino and La Nina, which have a major impact on Alaska and much of North America.

See Rebuttal: AC Rebuttal- Alaska’s hot July caused by global warming (08/21/19)

Claim: Rising atmospheric CO2 concentrations are causing ocean acidification, which is catastrophically harming marine life.
Fact: When life is considered, ocean acidification is often found to be a non-problem, or even a benefit.

The ocean chemistry aspect of the ocean acidification hypothesis is rather straightforward, but it is not as solid as it is often claimed to be. For one thing, the work of a number of respected scientists suggests that the drop in oceanic pH will not be nearly as great as the IPCC and others predict. And, as with all phenomena involving living organisms, the introduction of life into the analysis greatly complicates things. When a number of interrelated biological phenomena are considered, it becomes much more difficult, if not impossible, to draw such sweeping negative conclusions about the reaction of marine organisms to ocean acidification. Quite to the contrary, when life is considered, ocean acidification is often found to be a non-problem, or even a benefit. And in this regard, numerous scientific studies have demonstrated the robustness of multiple marine plant and animal species to ocean acidification—when they are properly performed under realistic experimental conditions.

Detailed Rebuttal and Author: AC Rebuttal – Ocean Acidification (02/04/19)

Claim: Carbon pollution is a health hazard.
Fact: Carbon dioxide (CO2) is an odorless invisible trace gas that is plant food and it is essential to life on the planet. It is not a pollutant.

The term “carbon pollution” is a deliberate, ambiguous, disingenuous term, designed to mislead people into thinking carbon dioxide is pollution. It is used by the environmentalists to confuse the environmental impacts of CO2 emissions with the impact of the emissions of unwanted waste products of combustion. The burning of carbon-based fuels (fossil fuels – coal, oil, natural gas – and biofuels and biomass) converts the carbon in the fuels to carbon dioxide (CO2), which is an odorless invisible gas that is plant food and it is essential to life on the planet.
Detailed Rebuttal and Authors: AC Rebuttal Health Impacts (02/04/19)

Claim: CO2-induced climate change is threatening global food production and harming natural ecosystems.
Fact: The vitality of global vegetation in both managed and unmanaged ecosystems is better off now than it was a hundred years ago, 50 years ago, or even a mere two-to-three decades ago thanks in part to CO2.

Such claims are not justified; far from being in danger, the vitality of global vegetation in both managed and unmanaged ecosystems is better off now than it was a hundred years ago, 50 years ago, or even a mere two-to-three decades ago.

With respect to managed ecosystems (primarily the agricultural enterprise), yields of nearly all important food crops have been rising for decades (i.e., the Green Revolution). Reasons for these increases are manifold, but they have mainly occurred in response to continuing advancements in agricultural technology and scientific research that have expanded the knowledge or intelligence base of farming (e.g., fertilizers, pesticides, irrigation, crop selection and breeding, computers, machinery and other devices).

Spatial pattern of trends in Gross Primary Production (1982- 2015). Source: Sun et al. 2018.

Detailed Rebuttal and Authors: AC Rebuttal Agriculture and NaturalEcosystems_Idso020619 (1)

Conclusion:

The well-documented invalidation of the “three lines of evidence” upon which EPA attributes global warming to human -caused CO2 emissions breaks the causal link between such CO2 emissions and global warming.

This in turn necessarily breaks the causal chain between CO2 emissions and the alleged knock-on effects of global warming, such as loss of Arctic ice, increased sea level, and increased heat waves, floods, droughts, hurricanes, tornadoes, etc. These alleged downstream effects are constantly cited to whip up alarm and create demands for ever tighter CO2 regulation. EPA explicitly relied on predicted increases in such events to justify the Endangerment Finding supporting its Clean Power Plan. But as shown above, there is no evidence to support such claims, and copious empirical evidence that refutes them.

Climate Doomsday Films Debunked

Debunking The Top 5 Environmental Disaster Films by Julianne Geiger at Oil Price.com Excerpts below in italics with my bolds.

It’s 1983, and the height of the Cold War. The more thoughtful Gen-Xers were contemplating the chances of surviving a nuclear war in a leaky cellar, wondering if the actor-turned-president really knew what he was doing.

They weren’t thinking about whether they had to choose between a world with oil and gas or no world at all due to climate change. There was little polarization.

Climate change seemed far away, indeed. Nuclear war was the clear and present bogeyman.

It was difficult to roller skate with any enthusiasm after watching ABC’s TV movie The Day After.

As far as movies go, the nuclear-war-based film definitely wasn’t an Oscar-winner, but it did manage to horrify an entire generation.

The conclusion of nearly everyone after watching this film: That’s it. We’re screwed. And the most horrifying aspect of apocalypse-by-nuclear war is that we can’t blame it on anyone but ourselves. Alien apocalypse movies are so much easier to take.

Since then, given our addiction to anything apocalyptic, a long line-up of environmental disaster films to feed our self-fulfilling prophecies of destruction have made their way through the box office.

While The Day After back in 1983 was, by all accounts, a realistic portrayal of our pending doom, many others that have followed have been about as realistic as an alien invasion.

It’s difficult, after all, to stuff catastrophic climate change into a couple of hours.

Let us debunk some of the best ones for you in the increasingly popular ‘Cli-Fi’ genre:

#1 The Day After Tomorrow (2004)

Attempting to leech off the wildly dark popularity of the 1983 doom-and-gloom, The Day After Tomorrow (2004) managed to take home the second-place trophy in an IMDB poll for favorite ‘Cli-Fi’ movie of all time (which we don’t understand).

And that is despite being simultaneously recognized as a work of highly implausible global warming fiction. It doesn’t matter: movie-goers crave catastrophes galore, and this film has a new one every minute.

But it has also been ripped apart by the scientific community–including many climate scientists–for violating nearly every law of thermodynamics.

It’s always one man against the world in movies like this. In this case, it’s a paleoclimatologist who uncovers a climate shift in ice core samples. Predictably, he is ignored and a superstorm plunges the world into catastrophic disaster upon disaster. In other words, the whole premise of the movie is that an ice age is upon us–suddenly.

To add to the hero aspect, the paleoclimatologist must travel across the US–by foot–to save his son, braving the superstorms.

Prior to the movie’s release, scientists worried the plot was so extreme it would lead people to dismiss global warming as a complete fantasy. In all likelihood, the film succeeded in sucking some legitimacy out of the climate crusade.

Wacky science will do that, and in this case, our favorite implausibility is the entire premise of the movie which suggests that a network of massive hurricane-shaped snowstorms covering entire continents deposits enough snow to reflect sunlight and create an ice age within a matter of days. This is a development that the National Center for Atmospheric Research (NCAR) debunks categorically. While temperatures in parts of the world could drop, it wouldn’t create an ice age in a matter of days. Of course, the movie only has an hour and a half to lay out the earth’s demise.

Temperatures that dropped suddenly at a rate of 10 degrees per second; or 600 degrees per minute (satellite readings themselves take even longer than this)

Helicopters crashing to the ground because their fuel froze at -150 degrees F (the tropopause, the coldest part of the troposphere, never reaches this temperature)

People freezing in place so quickly they don’t have time to exit their vehicles.

#2 Interstellar (2014)

Interstellar is definitely one of the better cli-fi movies ever made, and the science is particularly … sciencey.

Some of the science portrayed in the movie was spot on, according to scientists themselves, but some was … theoretical, at best.

The movie starts with a grim picture of an earth no longer able to sustain the growing of crops due to “The Blight”. With the world about to run out of food and humanity on the brink, a few brave souls travel to the outermost reaches of space to find a more suitable home for mankind.

The movie covers the science of a microorganism called the blight–a scenario that is particularly unlikely given that it would span across multiple types of crops, which are all genetically dissimilar.

The film also covers space-time warps (true), slingshotting around a neutron star (unlikely), and beings that can live in five dimensions in the bulk (false).

Despite some artistic liberties, it’s entertainment value is top-notch. Just don’t go rushing home to stock up on grains to prepare for a blight-induced famine. It’s just not going to happen.

#3 San Andreas (2015)

San Andreas wasn’t a work of Hollywood genius, but it has the requisite story of earth’s destruction, and a Hollywood hero played by The Rock. The film may be a fun two hours, but it seems the science behind the movie is a bit suspect.

In San Andreas, the world is rocked by the largest earthquake ever, triggered by the San Andreas fault.

There are so many scientific impossibilities that we’re not even sure where to begin. First, science does not exist to predict earthquakes in the manner shown. There is just no way to predict when and where an earthquake will happen. Second, the San Andreas fault is a land-based fault, and those don’t create tsunamis, let alone the major one shown in the movie. Despite the large earthquake in the film, new buildings are designed–particularly in California–to withstand large quakes.

The San Andreas fault is 800 miles long and 10 or so miles long. Because the magnitude of the earthquake is dependent on the area of the fault, anything more than an 8.3 is unlikely.

And that gaping hole in the ground left by the quake? Utter nonsense. While small crevasses may occur from landslides and such, the ground does not split apart, exposing the major chasm like the one shown in the movie.

#4 Mad Max: Fury Road (2015)

Can the world really run out of water? Will water someday be the new oil?

NASA’s chief water expert, Jay Famigletti, says it absolutely can, adding that California may actually see such a scenario if its drought continues.

In Mad Max: Fury Road, which is set decades after the original Mad Max, water is definitely the new oil, and drilling for it is a horrifyingly violent business.

In the Max Max world, only people with the means to pump water from deep within the earth have any access at all. Those with lesser means are left scrambling for the most precious commodity.

Toxic dust storms and other perils depicted in the movie are possibly exaggerated, but some scientists were quick to jump on the movie’s message, saying that this is the world we may be living in if we fail to work at curbing climate change.

“Our climate models certainly predict increasing ‘desertification’,” Farnigletti said of the film, adding that there were “metaphorical elements of ‘Mad Max’ that are already happening, and that will only worsen with time.”

Farnigletti was careful to add that some conditions in the movie were exaggerated.

#5 Sunshine (2007)

The year is 2057, and Earth’s sun is dying, threatening to end humanity along with it. The planet’s only hope is an internationally diverse group of eight men and women who are brave enough to venture into space with a nuclear fission bomb that is supposed to revive the sun.

The premise is that the sun is being eaten alive from the inside out by a supersymmetric particle called a Q-Ball. It’s based on a theory by Harvard physicist Sidney Coleman, who posited that the Q-Ball may have formed during the Big Bang and potentially had the ability to break down ordinary matter made of protons and neutrons.

We’re not physicists, nor will we attempt to be, but the movie’s theory that the Q-Ball is eating away at the sun like a cancer is debunked by pretty much every scientist out there, not least because the Q-Ball theory itself has never been proven. Scientists from New York University studying the Q-Ball theory say that the biggest problem with the movie is that, if it existed, a Q-Ball would actually have the opposite effect on the sun: It would not die; rather, it’s radiation would vastly increase and we wouldn’t freeze–we’d all fry.

Footnote:  I’m sorry the list excluded my favorite:

That one inspired reflections on the fact our planet is misnamed “Earth”  when it is so obviously “Ocean.”  See Climate Report from the Water World

Coming soon to your neighborhood: Watch for it!