Fires in US West: History vs. Hysteria

People who struggle with anxiety are known to have moments of “hair on fire.” IOW, letting your fears take over is like setting your own hair on fire. Currently the media, pandering as always to primal fear instincts, is declaring that the US West is on fire, and it is our fault. Let’s see what we can do to help them get a grip.
First the media hysteria.
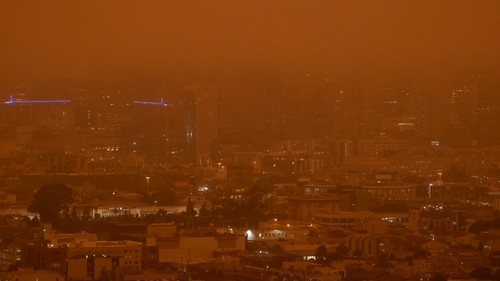
BAY AREA ON SEPTEMBER 9, 2020. IMAGE: BAY AREA AIR QUALITY
The Headlines are Screaming!
Why wildfire smoke can turn the sky orange and damage your lungs Vox18:31
A 2006 Heat Wave Was a Wake-Up Call. Why Didn’t L.A. Pay Attention? Curbed18:25
Wildfires and weather extremes: It’s not coincidence, it’s climate change CBS News18:20
Trillions up in smoke: The staggering economic cost of climate change inaction The New Daily18:09
‘Zombie Fires’ May Have Sparked Record High Carbon Emissions in the Arctic Smithsonian Magazine17:33
How Did the Wildfires Start? Here’s What You Need to Know The New York Times17:32
‘It Looks Like Doomsday’: California Residents React to Orange Sky The New York Times17:20
Apocalyptic Orange Haze And Darkness Blanket California Amid Fires HuffPost (US)16:46
Fire experts: Western fires are ‘unreal’ Mashable16:00
Devastating Wildfires Ravage The West HuffPost (US)14:25
‘Entire Western US on Fire’ as Region Faces Deadly Flames Compounded by Heatwave, Blackouts, and Coronavirus Common Dreams13:24
Unprecedented Wildfires Turn California Skies Orange Vice (US)13:43
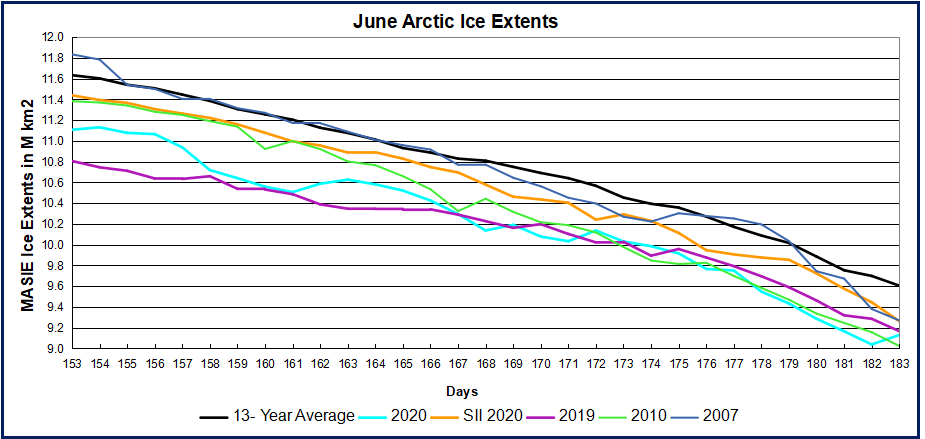
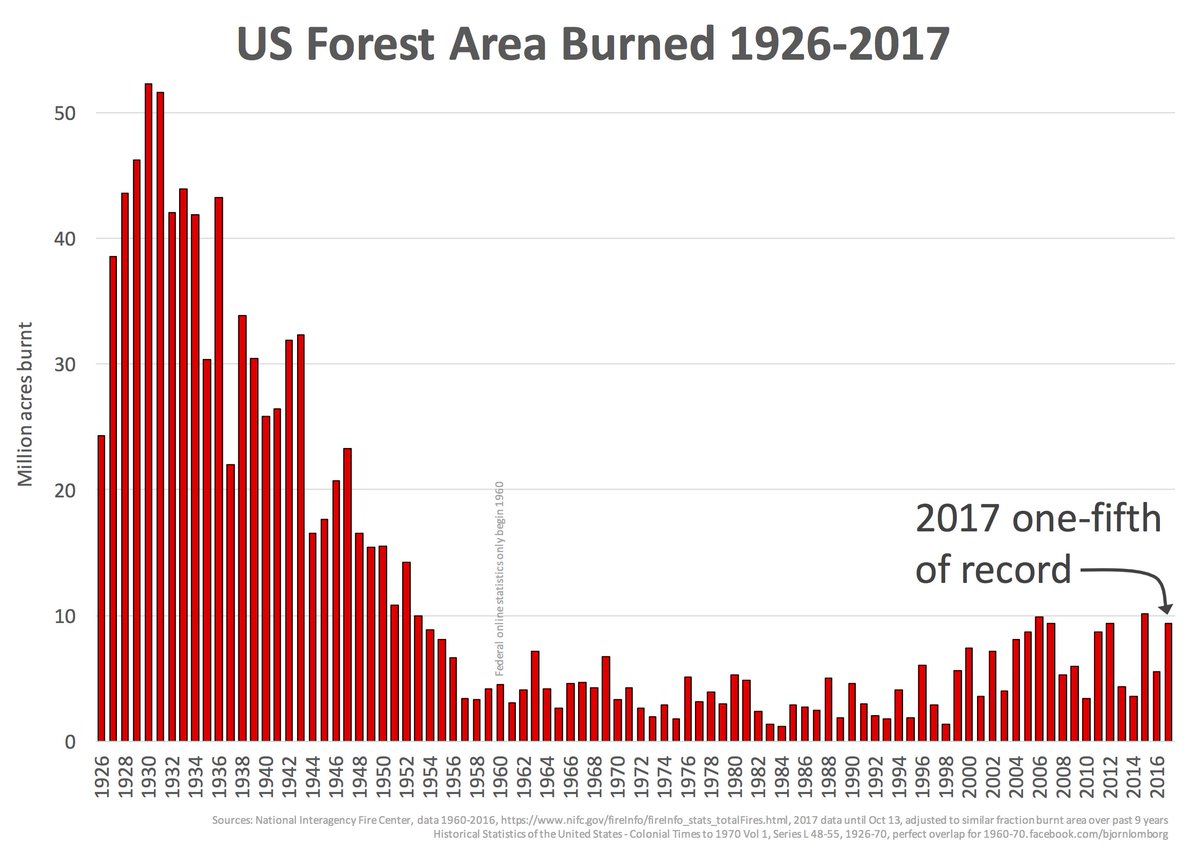
Now the History. Are these wildfires “unprecedented?”

The National Interagency Fire Center provides the facts and historical context. Here are the details on this year and the last decade.
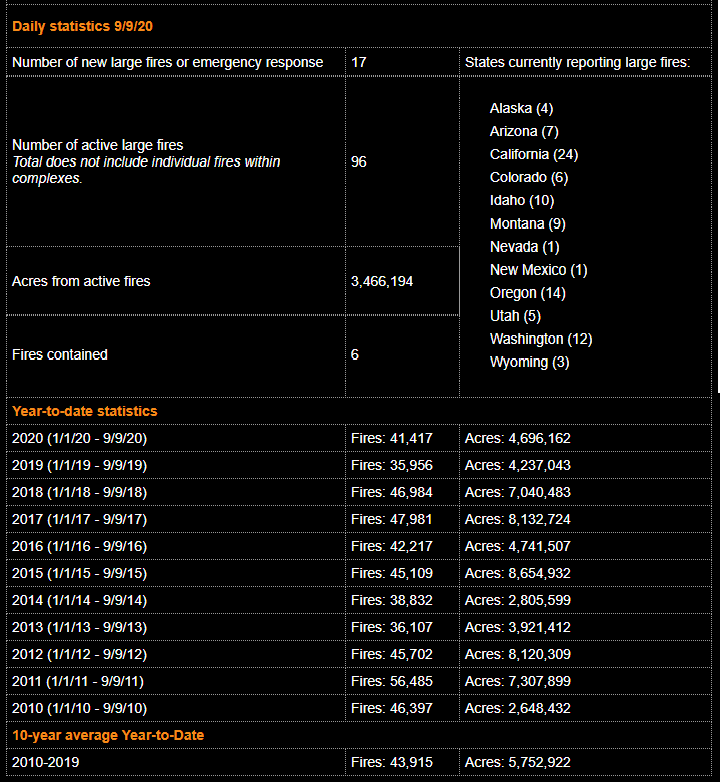
Note that for the year-to-date, 2020 is below average both for number of fires and acreage. Three years were over 8M acres at this point in the year. And one of them (2012) was also an election year, but lacked the current media fury politicizing everything.
Annual Number of Acres Burned in US Wildland Fires, 1980-2019
Background Information from Previous Post Arctic on Fire! Not.
1. Summer is fire season for northern boreal forests and tundra.
From the Canadian National Forestry Database
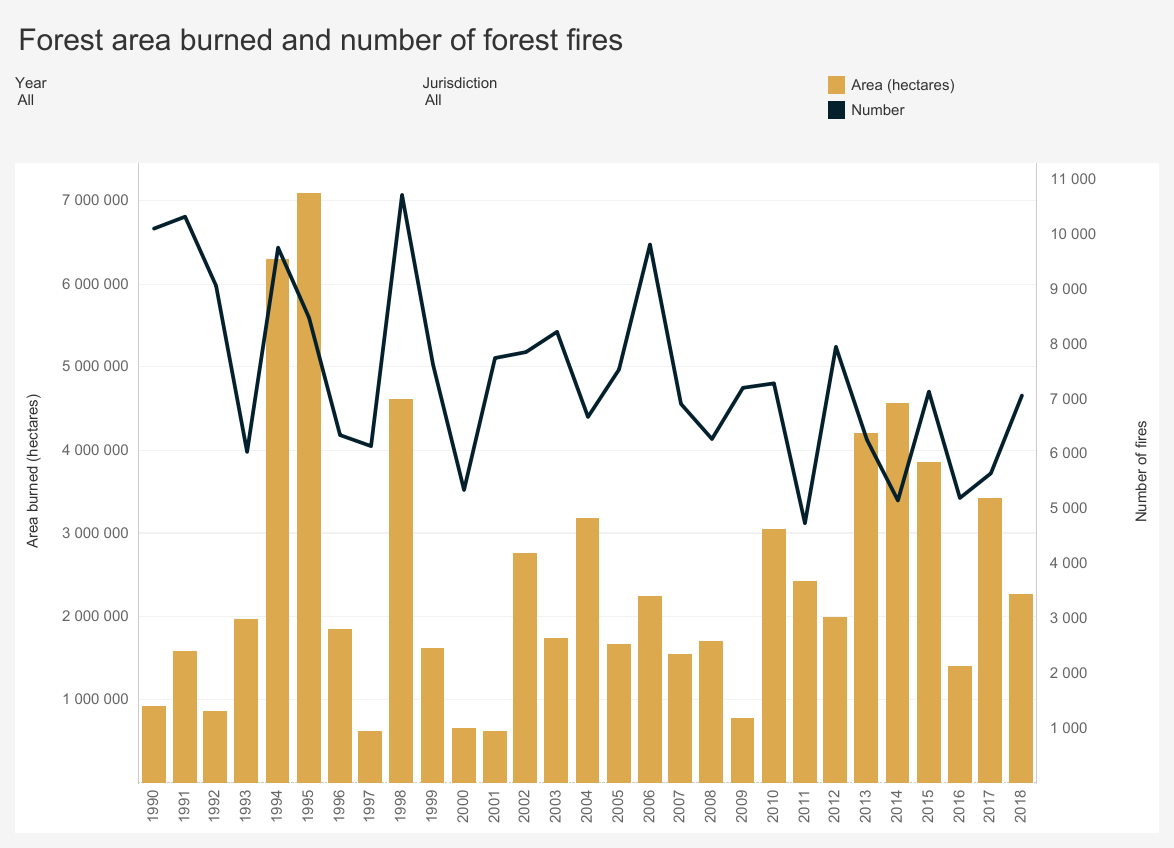
Since 1990, “wildland fires” across Canada have consumed an average of 2.5 million hectares a year.
| Recent Canadian Forest Fire Activity | 2015 | 2016 | 2017 |
| Area burned (hectares) | 3,861,647 | 1,416,053 | 3,371,833 |
| Number of fires | 7,140 | 5,203 | 5,611 |
The total area of Forest and other wooded land in Canada is 396,433,600 (hectares). So the data says that every average year 0.6% of Canadian wooded area burns due to numerous fires, ranging from 1000 in a slow year to over 10,000 fires and 7M hectares burned in 1994.
2. With the warming since 1980 some years have seen increased areas burning.
From Wildland Fire in High Latitudes, A. York et al. (2017)
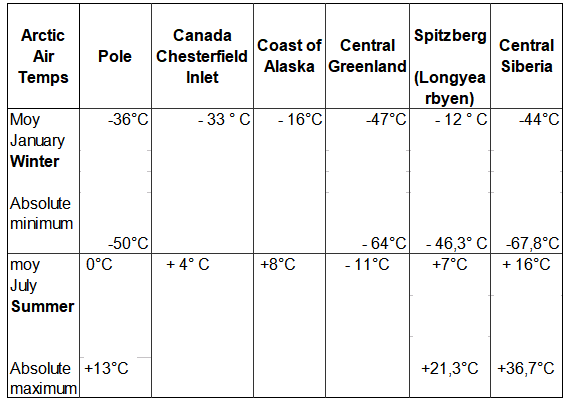
Despite the low annual temperatures and short growing seasons characteristic of northern ecosystems, wildland fire affects both boreal forest (the broad band of mostly coniferous trees that generally stretches across the area north of the July 13° C isotherm in North America and Eurasia, also known as Taiga) and adjacent tundra regions. In fact, fire is the dominant ecological disturbance in boreal forest, the world’s largest terrestrial biome. Fire disturbance affects these high latitude systems at multiple scales, including direct release of carbon through combustion (Kasischke et al., 2000) and interactions with vegetation succession (Mann et al., 2012; Johnstone et al., 2010), biogeochemical cycles (Bond-Lamberty et al., 2007), energy balance (Rogers et al., 2015), and hydrology (Liu et al., 2005). About 35% of global soil carbon is stored in tundra and boreal systems (Scharlemann et al., 2014) that are potentially vulnerable to fire disturbance (Turetsky et al., 2015). This brief report summarizes evidence from Alaska and Canada on variability and trends in fire disturbance in high latitudes and outlines how short-term fire weather conditions in these regions influence area burned.
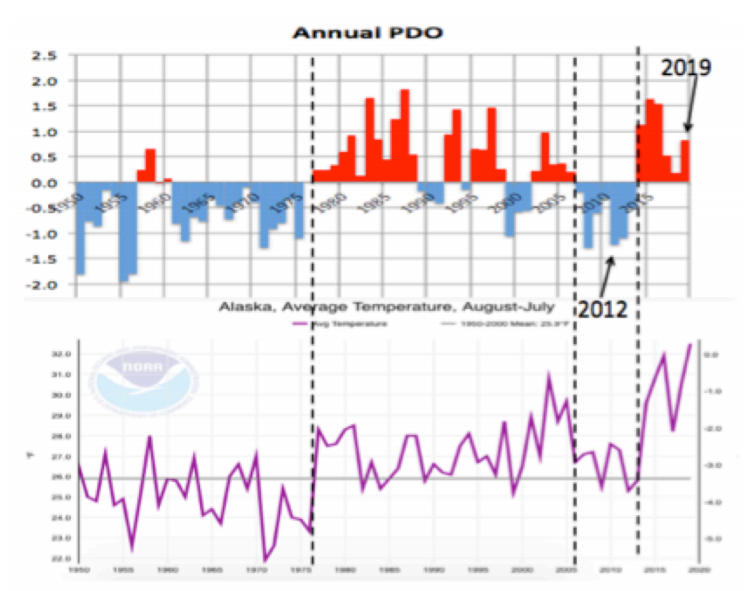
Climate is a dominant control of fire activity in both boreal and tundra ecosystems. The relationship between climate and fire is strongly nonlinear, with the likelihood of fire occurrence within a 30-year period much higher where mean July temperatures exceed 13.4° C (56° F) (Young et al., 2017). High latitude fire regimes appear to be responding rapidly to recent environmental changes associated with the warming climate. Although highly variable, area burned has increased over the past several decades in much of boreal North America (Kasischke and Turetsky, 2006; Gillett et al., 2004). Since the early 1960s, the number of individual fire events and the size of those events has increased, contributing to more frequent large fire years in northwestern North America (Kasischke and Turetsky, 2006). Figure 1 shows annual area burned per year in Alaska (a) and Northwest Territories (b) since 1980, including both boreal and tundra regions.

[Comment: Note that both Alaska and NW Territories see about 500k hectares burned on average each year since 1980. And in each region, three years have been much above that average, with no particular pattern as to timing.]
Recent large fire seasons in high latitudes include 2014 in the Northwest Territories, where 385 fires burned 8.4 million acres, and 2015 in Alaska, where 766 fires burned 5.1 million acres (Figs. 1 & 2)—more than half the total acreage burned in the US (NWT, 2015; AICC, 2015). Multiple northern communities have been threatened or damaged by recent wildfires, notably Fort McMurray, Alberta, where 88,000 people were evacuated and 2400 structures were destroyed in May 2016. Examples of recent significant tundra fires include the 2007 Anaktuvuk River Fire, the largest and longest-burning fire known to have occurred on the North Slope of Alaska (256,000 acres), which initiated widespread thermokarst development (Jones et al., 2015). An unusually large tundra fire in western Greenland in 2017 received considerable media attention.
Large fire events such as these require the confluence of receptive fuels that will promote fire growth once ignited, periods of warm and dry weather conditions, and a source of ignition—most commonly, convective thunderstorms that produce lightning ignitions. High latitude ecosystems are characterized by unique fuels—in particular, fast-drying beds of mosses, lichens, resinous shrubs, and accumulated organic material (duff) that underlie dense, highly flammable conifers. These understory fuels cure rapidly during warm, dry periods with long daylight hours in June and July. Consequently, extended periods of drought are not required to increase fire danger to extreme levels in these systems.
Most acreage burned in high latitude systems occurs during sporadic periods of high fire activity; 50% of the acreage burned in Alaska from 2002 to 2010 was consumed in just 36 days (Barrett et al., 2016). Figure 3 shows cumulative acres burned in the four largest fire seasons in Alaska since 1990 (from Fig. 1) and illustrates the varying trajectories of each season. Some seasons show periods of rapid growth during unusually warm and dry weather (2004, 2009, 2015), while others (2004 and 2005) were prolonged into the fall in the absence of season-ending rain events. In 2004, which was Alaska’s largest wildfire season at 6.6 million acres, the trajectory was characterized by both rapid mid-season growth and extended activity into September. These different pathways to large fire seasons demonstrate the importance of intraseasonal weather variability and the timing of dynamical features. As another example, although not large in total acres burned, the 2016 wildland fire season in Alaska was more than 6 months long, with incidents requiring response from mid-April through late October (AICC, 2016).
3. Wildfires are part of the ecology cycle making the biosphere sustainable.
Forest Fire Ecology: Fire in Canada’s forests varies in its role and importance.
In the moist forests of the west coast, wildland fires are relatively infrequent and generally play a minor ecological role.
In boreal forests, the complete opposite is true. Fires are frequent and their ecological influence at all levels—species, stand and landscape—drives boreal forest vegetation dynamics. This in turn affects the movement of wildlife populations, whose need for food and cover means they must relocate as the forest patterns change.
lThe Canadian boreal forest is a mosaic of species and stands. It ranges in composition from pure deciduous and mixed deciduous-coniferous to pure coniferous stands.
The diversity of the forest mosaic is largely the result of many fires occurring on the landscape over a long period of time. These fires have varied in frequency, intensity, severity, size, shape and season of burn.
The fire management balancing act: Fire is a vital ecological component of Canadian forests and will always be present.
Not all wildland fires should (or can) be controlled. Forest agencies work to harness the force of natural fire to take advantage of its ecological benefits while at the same time limiting its potential damage and costs.
Tundra Fire Ecology
From Arctic tundra fires: natural variability and responses to climate change, Feng Sheng Hu et al. (2015)
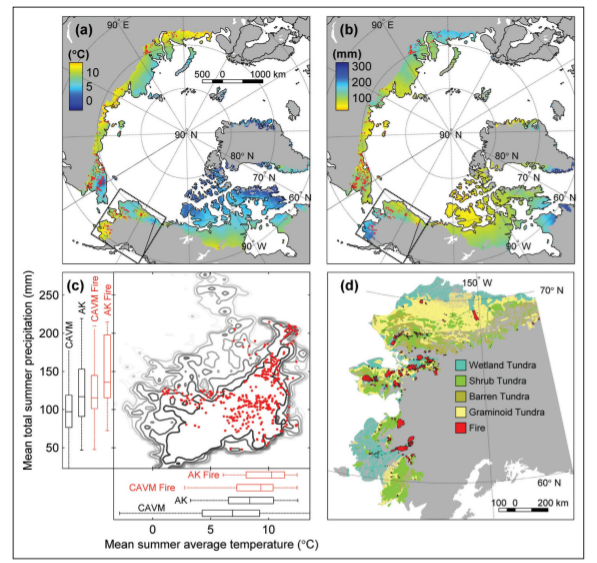
Circumpolar tundra fires have primarily occurred in the portions of the Arctic with warmer summer conditions, especially Alaska and northeastern Siberia (Figure 1). Satellite-based estimates (Giglio et al. 2010; Global Fire Emissions Database 2015) show that for the period of 2002–2013, 0.48% of the Alaskan tundra has burned, which is four times the estimate for the Arctic as a whole (0.12%; Figure 1). These estimates encompass tundra ecoregions with a wide range of fire regimes. For instance, within Alaska, the observational record of the past 60 years indicates that only 1.4% of the North Slope ecoregion has burned (Rocha et al. 2012); 68% of the total burned area in this ecoregion was associated with a single event, the 2007 AR Fire.
The Noatak and Seward Peninsula ecoregions are the most flammable of the tundra biome, and both contain areas that have experienced multiple fires within the past 60 years (Rocha et al. 2012). This high level of fire activity suggests that fuel availability has not been a major limiting factor for fire occurrence in some tundra regions, probably because of the rapid post-fire recovery of tundra vegetation (Racine et al. 1987; Bret-Harte et al. 2013) and the abundance of peaty soils.
However, the wide range of tundra-fire regimes in the modern record results from spatial variations in climate and fuel conditions among ecoregions. For example, frequent tundra burning in the Noatak ecoregion reflects relatively warm/dry climate conditions, whereas the extreme rarity of tundra fires in southwestern Alaska reflects a wet regional climate and abundant lakes that act as natural firebreaks.
Fire alters the surface properties, energy balance, and carbon (C) storage of many terrestrial ecosystems. These effects are particularly marked in Arctic tundra (Figure 5), where fires can catalyze biogeochemical and energetic processes that have historically been limited by low temperatures.
In contrast to the long-term impacts of tundra fires on soil processes, post-fire vegetation recovery is unexpectedly rapid. Across all burned areas in the Alaskan tundra, surface greenness recovered within a decade after burning (Figure 6; Rocha et al. 2012). This rapid recovery was fueled by belowground C reserves in roots and rhizomes, increased nutrient availability from ash, and elevated soil temperatures.
At present, the primary objective for wildland fire management in tundra ecosystems is to maintain biodiversity through wildland fires while also protecting life, property, and sensitive resources. In Alaska, the majority of Arctic tundra is managed under the “Limited Protection” option, and most natural ignitions are managed for the purpose of preserving fire in its natural role in ecosystems. Under future scenarios of climate and tundra burning, managing tundra fire is likely to become increasingly complex. Land managers and policy makers will need to consider trade-offs between fire’s ecological roles and its socioeconomic impacts.
4. Arctic fire regimes involve numerous interacting factors.
Frequent Fires in Ancient Shrub Tundra: Implications of Paleorecords for Arctic Environmental Change
Philip E. Higuera et al. (2008)
Although our fire-history records provide unique insights into the potential response of modern tundra ecosystems to climate and vegetation change, they are imperfect analogs for future fire regimes. First, ongoing vegetation changes differ from those of the late-glacial period: several shrub taxa (Salix, Alnus, and Betula) are currently expanding into tundra [10], whereas Betula was the primary constituent of the ancient shrub tundra. The lower flammability of Alnus and Salix compared to Betula could make future shrub tundra less flammable than the ancient shrub tundra. Second, mechanisms of past and future climate change also differ. In the late-glacial and early-Holocene periods, Alaskan climate was responding to shrinking continental ice volumes, sea-level changes, and amplified seasonality arising from changes in the seasonal cycle of insolation [13]; in the future, increased concentrations of atmospheric greenhouse gases are projected to cause year-round warming in the Arctic, but with a greater increase in winter months [8]. Finally, we know little about the potential effects of a variety of biological and physical processes on climate-vegetation-fire interactions. For example, permafrost melting as a result of future warming [8] and/or increased burning [24] could further facilitate fires by promoting shrub expansion [10], or inhibit fires by increasing soil moisture [24].

5. The Arctic has adapted to many fire regimes stronger than today’s activity.
Fire history in the Noatak also suggests that subtle changes in vegetation were linked to changes in tundra fire occurrence. Spatial variability across the study region suggests that vegetation responded to local-scale climate, which in turn influenced the flammability of surrounding areas. This work adds to evidence from ‘ancient’ shrub tundra in the southcentral Brooks Range suggesting that vegetation change will likely modify tundra fire regimes, and it further suggests that the direction of this impact will depend upon the specific makeup of future tundra vegetation. Ongoing climate-related vegetation change in arctic tundra such as increasing shrub abundance in response to warming temperatures (e.g., Tape et al. 2006), could both increase (e.g., birch) or decrease (e.g., alder) the probability of future tundra fires.
This study provides estimated fire return intervals (FRIs) for one of the most flammable tundra ecosystems in Alaska. Fire managers require this basic information, and it provides a valuable context for ongoing and future environmental change. At most sites, FRIs varied through time in response to changes in climate and local vegetation. Thus, an individual mean or median FRI does not capture the range of variability in tundra fire occurrence. Long-term mean FRIs in many periods were both shorter than estimates based on the past 60 years and statistically indistinct from mean FRIs found in Alaskan boreal forests (e.g., Higuera et al. 2009) (Figure 2). These results imply that tundra ecosystems have been resilient to relatively frequent burning over the past 6,000 years, which has implications for both managers and scientists concerned about environmental change in tundra ecosystems. For example, increased tundra fire occurrence could negatively impact winter forage for the Western Arctic Caribou Herd (Joly et al. 2009). Although the Noatak is only a portion of this herd’s range, our results indicate that if caribou utilized the study area over the past 6,000 years, then they have successfully co-existed with relatively frequent fire.


 Detailed Rebuttal and Authors:


 Detailed Rebuttal and Authors: AC