Climate Alarms LOL

We skeptics enjoyed immensely the expert satire of Yes Prime Minister directed at the foibles of climate hysteria.  That clip was available at my post Laughing at Climate Change.  (That video is also now blocked, but I have added the transcript (here).

Now we find there was another even more skewering into the soft underbelly of the beast.  H/T Global Warming Policy Foundation (here).

“Computer models are no different from fashion models: seductive, unreliable, easily corrupted, and they lead sensible people to make fools of themselves.” –Jim Hacker, Yes, Prime Minister

The video was blocked by BBC in my country (Canada), but GWPF helpfully provides the transcript of the juicy bits:

Later in Act One, Scene Two
The phone rings. They all look at it.

Claire Hello? It’s the BBC again. I see. Thanks. (She hangs up.) Piling on the agony. A big new story about global warming has just broken, they’re adding that to the Sunday programme too. Global warming computer models have been proved wrong.

Humphrey How shocking!

Claire The new models show that it’s even worse than previously thought. Much more severe. And happening faster.

Jim Is that supposed to be my fault too?

Claire Everything is at the moment. They want to know why the government is dragging its feet on CO2 emission controls.

Jim (losing it) Do we have to deal with that tonight? As well as …(much has gone wrong for Jim earlier in the play)… Is there anything else, anything else we can pile on me tonight? Oh yes! Global bloody warming, thank you very much!

Claire It’s just that they’re going to add it to the catalogue of your failures. (He gives her a look.) Alleged failures, I mean.

Humphrey Meanwhile, may I suggest that you don’t worry too much about global warming?

Jim Right. I can’t do anything about that tonight, can I?

Humphrey Tell me, how do they know we’re all going to drown in years when the weather forecast was so wrong last Friday?

Jim Because all the scientists agree.

Humphrey So they say. So do the computer models. I know. But why should global warming computer models be any more accurate than financial ones?

Jim Um…

Humphrey Wall Street computer models were designed to prove sub­prime mortgage derivatives were low risk. These computer models are designed to show global warming is getting worse.

Jim Come off it, Humphrey.

Humphrey Remember mad cow disease? Computer models for that proved that we’d be dying in our hundreds of thousands by now. The only thing is, virtually nobody died, did they? Same with the salmonella-in-eggs computer models. Same with swine flu.

Jim You’re suggesting … what, exactly?

Humphrey Global-Warming models leave out nearly all the other possible causes except CO2. And then they say ‘Look, CO2 has caused all this climate change.’

Jim What other causes are there?

Humphrey If the earth were actually getting warmer, one might start by looking at the sun. Solar activity, water vapour, cosmic rays, sunspots, underwater volcanoes –

Jim If? The world is getting hotter, the science is overwhelming, everyone knows that.

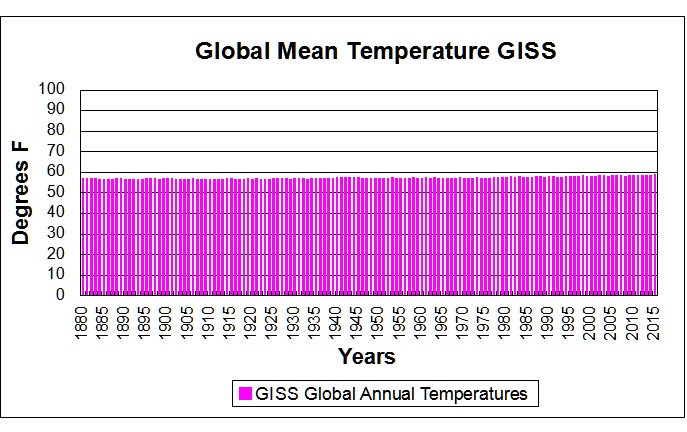
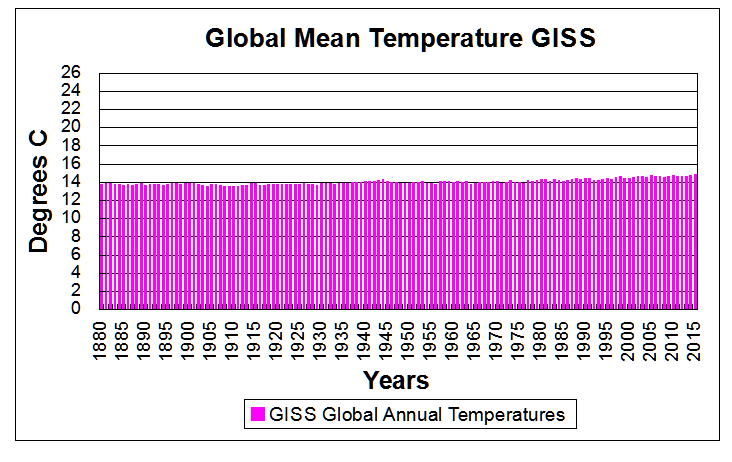
Humphrey There’s been no rise in temperature since 1998.

Jim Really? But it was rising, wasn’t it?

Humphrey From 1975 to 1998, yes, absolutely.

Jim That’s what I mean.

Humphrey But it fell from 1940 to 1975. Even though that was a heavily industrialised period, when CO2 shot up. And overall the temperature isn’t rising at all: the hottest year in the twentieth century was 1934.

Jim I read that two thousand five hundred top climate scientists contributed to the last IPCC survey and they all agreed that man­made global warming is a proven fact and trapped greenhouse gases are the cause.

Humphrey Nearly fifty of them agreed. The others didn’t, actually. But their views were left out of the summaries given to the press.

Claire Haven’t you seen that film of the melting icebergs in the Antarctic?

Humphrey Yes. Beautiful, aren’t they?

Claire That’s caused by CO2.

Humphrey No, that’s caused by warm water masses from the Pacific.

Claire Why are the polar bears becoming extinct?

Humphrey Are they?

Claire The computer models say they are.

Humphrey But the people who actually go and count them have found more than there were thirty years ago.

Jim For heaven’s sake, Humphrey! If it’s all such nonsense why does everyone believe it?

Humphrey (amused) Hard to understand, I agree. But some scientists believe it, lots of others want the billions of pounds you can get for research that seems to show that global warming is caused by greenhouse gases, and most of the scientists who disagree can’t get published. Journalists love shock­horror stories, governments want to look virtuous to the voters, lefties want a way to rubbish big oil, and it makes the tree-huggers, whale-savers, anti-capitalists and everyone at the BBC feel holier than thou and warm and fuzzy inside. What’s not to like?

Jim Why hasn’t anyone else said all this?

Humphrey They have. No one wants to hear it.

Jim So wind farms don’t make sense?

Humphrey (chuckles) They certainly do, for all the businessmen who are getting enormous government grants for them. But there isn’t enough wind to be practical. The total output of all the UK wind turbines put together is one-fifth of one decent sized coal-fired power station.

Claire You don’t believe in global warming?

Humphrey My job is not to believe or disbelieve. My job is to weigh up arguments and produce answers. That’s what the Civil Service is for.

Jim I really think you must be misinformed somewhere. Al Gore got the Nobel Peace Prize for his work on global Warming.

Humphrey So did Dr Kissinger for his work on the Vietnam War.

Jim has no answer to that.

Jim You think it’s all a scam? I can’t get my head around this.

Humphrey For some people it’s a scam. For most, it’s just the greatest outbreak of collective hysteria since the witchcraft trials in the seventeenth century.

Footnote:

Apologies to anyone who didn’t know LOL is an internet reference meaning “Laughing Out Loud.”  Apparently that number includes Vladimir Putin who recently ended an interview with LOL, but he meant “Look Out Latvia.”

PS Further Wit and Wisdom from Sir Humphrey

Opposition’s about asking all the questions.
And government is about not answering them.

The less you intend to do about something, the more you have to keep talking about it.

“Open government” is a contradiction in terms. You can be open or you can have government.

Citizens don’t have a right to know, theirs is a right to be ignorant. Knowledge only means complicity and guilt, ignorance has a certain dignity.

If people don’t know what you’re doing, they don’t know what you are doing wrong.

“Under consideration” means we’ve lost the file. “Under active consideration” means we’re trying to find it.

On the Hubris of Climatism


Canadian Michael Hart speaks out on climatism in his new book, Hubris: The Troubling Science, Economics, and Politics of Climate Change (link to interview with Hart at Tallbloke’s Talkshop)

The wide-ranging interview contains many insights, including this one that IMO gets at a deep, underlying motive:

Alarm over a changing climate leading to malign results is in many ways the product of the hunger for stability and direction in a post-Christian world. Humans have a deep, innate need for a transcendent authority. Having rejected the precepts of Christianity, people in the advanced economies of the West are turning to other forms of authority. Putting aside those who cynically exploit the issue for their own gain – from scientists and politicians to UN leaders and green businesses – most activists are deeply committed to a secular, statist, anti-human, earth-centric set of beliefs which drives their claims of a planet in imminent danger from human activity.

To them, a planet with fewer people is the ultimate goal, achievable only through centralized direction and control. As philosopher of science Jeffrey Foss points out, “Environmental science conceives and expresses humankind’s relationship to nature in a manner that is – as a matter of observable fact – religious.” It “prophesies an environmental apocalypse. It tells us that the reason we confront apocalypse is our own environmental sinfulness. Our sin is one of impurity. We have fouled a pure, ‘pristine’ nature with our dirty household and industrial wastes. The apocalypse will take the form of an environmental backlash, a payback for our sins. … environmental scientists tell people what they must do to be blameless before nature.”

Hart says that unfortunately society has gone a long way down the wrong road, but the outcome can be changed.

I remain cautiously optimistic. Popular support for climate change action peaked a few years ago. In Europe, which has gone furthest in implementing climate change policies, politicians are beginning to look for ways to moderate earlier initiatives. In North America, rhetoric has far outstripped actions while the Obama administration has relied on stealth to implement its climate change agenda. At the same time, climate change has added to the momentum of the broader secularization of society and the pursuit of anti-human policies and programs. We are, sadly, farther down that road than we have ever been before.

Again, it will take a determined effort by people of faith and conscience to convince our political leaders that they have been gulled by a political movement exploiting fear of climate change to push a utopian, humanist agenda that most people would find abhorrent. As it now stands, politicians are throwing money that they do not have at a problem that does not exist in order to finance solutions that make no difference. The time has come to call a halt to this nonsense and focus on real issues that pose real dangers. In a world beset by war, terrorism, and continuing third-world poverty, there are far more important things on which political leaders need to focus.

Read the first chapter here:

https://www.academia.edu/29923495/_Hubris_The_Troubling_Science_Economics_and_Politics_of_Climate_Change_by_Michael_Hart_Chapter_One_here_interview_by_Margaret_Wente_of_Globe_and_Mail_my_comment

From the Preface:

The world will be a better place

  • when governments agree to tame this monster and refocus their energies on issues within their competence;
  • when religious leaders and other elites accept that they have fallen prey to a movement whose motives are much darker and more damaging than they realize;
  • and when the media adopt a more balanced approach and provide the public with the critical assessment that is often missing from their reporting.

It is time for all three to accept that the UN is pursuing a path that can only result in a less prosperous and more divided world.

“Gotcha” Graph from GISS

Lots of buzz over Brian Cox using the latest GISS land and ocean graph to put down Malcolm Roberts in a TV debate in Australia. Likely we will be seeing the image everywhere and alarmists crowing about “deniers” dismissed once and for all. For the record here is the graph showing no pause whatsoever:

This is accomplished by lowering the 1998 El Nino spike relative to 2015 El Nino. To see what is going on, here is a helpful chart from Dr. Ole Humlum at Climate4you

It shows that indeed, GISS is showing 1998 peak lower than several years since, especially 2002, 2010 and 2016. In contrast, the satellite record is dominated by 1998, and may still be in that position once La Nina takes hold later this year. The differences arise because satellites measure air temperature in the lower troposphere, while GISS combines records from land stations with sea surface temperatures (SSTs) to fabricate a global average anomaly, including adjusting, gridding and infilling to make the estimate of Global Mean Temperatures and compare to a 30-year average.

An insight into the adjustments is displayed below.

As we have seen before, the past is cooled, and the present warmed to ensure evidence of global warming. Presently it is claimed that July 2016 is the hottest month ever. But stay tuned for future adjustments necessary to keep the warming going.

Dr. Humlum demonstrates that GISS is an unstable temperature record.

Dr. Humlum:

Based on the above it is not possible to conclude which of the above five databases represents the best estimate on global temperature variations. The answer to this question remains elusive. All five databases are the result of much painstaking work, and they all represent admirable attempts towards establishing an estimate of recent global temperature changes. At the same time it should however be noted, that a temperature record which keeps on changing the past hardly can qualify as being correct. With this in mind, it is interesting that none of the global temperature records shown above are characterised by high temporal stability. Presumably this illustrates how difficult it is to calculate a meaningful global average temperature. A re-read of Essex et al. 2006 might be worthwhile. In addition to this, surface air temperature remains a poor indicator of global climate heat changes, as air has relatively little mass associated with it. Ocean heat changes are the dominant factor for global heat changes. (my bold)

Too much trickery going on. I prefer to see actual temperatures, and this graph presents clearly the GISS record without the distortions:

giss-annual-temps4

Or, if you prefer Celsius degrees (range represents human sensory experience of daily and seasonal temperature variability)

giss-annual-tempsincrev

Conclusion 

Brian Cox defended the GISS graph by saying it was from NASA who put men on the moon.  He forgot to mention that several of those men and many scientists who put them there find NASA increasingly unscientific and untrustworthy on climate matters.

It could also be said about the recent GISS graph:  You show us a graph where the past history is different today than GISS reported it a year ago, and different again from 5 and 10 years ago.  Why should we believe this one any more than the other ones?  And why does GISS contradict temperatures recorded directly by NASA satellites?

He who controls the past controls the future. He who controls the present controls the past.
George Orwell 1984

Footnote

Same point as Orwell, but with a dash of humour:

A soviet university professor addresses his students: “There’s good news and bad news about this year’s History final exam.  The good news is all the questions are exactly the same as last year’s exam.  The bad news: Many of the answers have changed.”

Much Ado About CO2

Following a presentation in London by Dr. Murry Salby, there has been much discussion at several sites: No Tricks Zone, Climate Etc. and WUWT. These threads are always a challenge for a reader because there are exchanges debating various issues between highly convinced people who are seldom explicit about the assumptions underlying their relative positions.

Interesting in this case are the reactions to Salby’s assertion that the observed rise in atmospheric CO2 is caused by effects of rising temperatures upon natural sources/sinks, and not by rising fossil fuel emissions. (Leaving aside for today the whole other issue of climate sensitivity to changes in CO2).

Attacks have been mounted both by supporters of IPCC, and also by skeptics of IPCC alarms who nevertheless accept the notion that all or most of the measured rise in CO2 is from humans, fossil fuels and cement in particular. Still others find flaws in Salby’s argument, but are not convinced by the alternative.

I recently posted a review of Salby’s textbook which touched on this topic. Firstly, I agree with those who say you cannot use static calculations on a dynamic and open system like the atmosphere. That is, both inputs and outputs are interactive and vary in response to each other. The most obvious example is increasing CO2 causing plant growth which in turn consumes more CO2. Thus algebra can mislead us, since it is the differentials over time that accumulate the object of interest at changing rates.

Secondly, it seems to me that the atmosphere itself is too small a subsystem to draw any meaningful conclusions. The ocean and land sources/sinks are orders of magnitude larger than the amount in the atmosphere, and the errors in estimating those flows far exceed the man-made emissions (which are also estimates with larger uncertainties than is usually admitted).

Rather than thinking of the air as a reservoir of CO2, it is more like a tidal pool. Imagine a scientist concerned that this tidal pool is changing volume because of water (unpolluted) leaking from a nearby landfill. So a measuring cup sample is taken periodically and tested. All the while, the pool is repeatedly drenched and drained by waves, currents and tides, along with occasional rains and storms. Whatever the test results, the effect of additional water from the landfill can not be discerned in the absence of markers distinguishing it from ocean and rainwater.

I don’t say Salby has all the answers. I agree with him that at the current state of information, atmospheric CO2 from human sources can not be identified apart from much larger natural fluxes of CO2.

i

Nunavut is Melting, Or not


From Yale Climate Connections we heard last week about Nunavut melting and a theatrical production to spread news and concerns about this dangerous development.

“I come from a place of rugged mountains, imperial glaciers and tender-covered permafrost. But Nunavut, our land, is only as rich as it is cold, and today most of it is melting.”That’s Chantal Bilodeau, reading a passage from “Sila,” a play about the effects of climate change in the Arctic.

The characters in her play include polar bears, an Inuit goddess, scientists, and coast guard officers – all working together to save their land.

No doubt her personal experience and feelings for her Nunavut are sincere and profound. (Originally I thought it was her homeland, but in fact she is a New York playwright and translator, born in Montreal.) And there will be a large audience receptive to her concerns about global warming. (Bilodeau has writen six plays about the Arctic and founded the international network Artists And Climate Change.) But I wonder if scientific measurements support her belief that Nunavut is melting.

After all, we have learned from medical research that individual life experiences (anecdotes) may not be true more generally. That is why drugs are tested on population samples with double-blind studies: neither the patient nor the doctor knows who gets the medicine and who gets the placebo.

So I went looking for weather station records to see what is the warming trend in that region. As curiosity does so often, it led me on a journey of discovery, learning some new things, and relearning old ones with fresh implications.

Where are temperatures measured in Nunavut?

It is by far the Northernmost territory of Canada, just off the coast of Northern Greenland.

According to Environment Canada, weather is reported at 29 places in Nunavut. So I went to look at the record at Iqaluit, the capital of the territory. You get monthly normals for the period 1981 to 2010. Historical data (daily averages) can be accessed only 1 individual month/year at a time, the menu stops at 2004. Even then, some months are filled with “M” for missing. Historical data from which trends can be analyzed is hard to come by.

Disappearing Weather Records

It turns out that Nunavut also suffered from the great purging of weather station records that was noticed by skeptics years ago.

Ave. T vs. No. Stations

Graph showing the correlation between Global Mean Temperature (Average T) and the number of stations included in the global database. Source: Ross McKitrick, U of Guelph

I was aware of this because of a recent study looking at trends at stations around the Arctic circle. Arctic Warming Unalarming.  That study included graphs that showed the dramatic removal of station records in the North.  Though the depletion was not limited to the far North, many Canadian and Russian records disappeared from the global database.

arctic-europe-paper-2015_fig6annual

Fig. 6 Temperature change for annual Arctic averages relative to the temperature during 1961 to 1990 for stations in Europe having more than 150 years of observations. The red curve is the moving 5-year average while the blue curve shows the number of stations reporting in each year. 118 stations contributed to the study. W. A. van Wijngaarden, Theoretical & Applied Climatology (2015)

Eureka, Nunavut, Canada “Last Station above latitude 65N”

Eureka got considerable attention in 2010 due to its surviving the dying out of weather stations. The phrase in quotes above reflects an observation that GISS uses Eureka data to infill across the whole Arctic Circle. That single station record is hugely magnified in its global impact in that temperature reconstruction product. Somewhat like the influence of a single tree in Yamal upon the infamous hockey stick graph.

The first High Arctic Weather Station in history, Eureka was established in April 1947 at 80-degrees north latitude in the vicinity of two rivers, which provided fresh water to the six-man United States Army Air Force team that parachuted in. They erected Jamesway huts to shelter themselves and their equipment until August, when an icebreaker reached Eureka – as it has every year since – and brought permanent buildings and supplies. For decades after that, small, all-male crews would hunker down for entire winters, going a little stir-crazy from the isolation. WUWT 2010

GHCN Records for Nunavut

It turns out that in addition to Eureka, GCHN has data for Alert and Clyde (River), but the latter two histories end in 2004 and 2010, respectively. The adjusted files have a few differences in details, but little change from the unadjusted files. The chart below shows the temperatures measured at Eureka, Nunavut, Canada 79° 98’ N, 85° 93’ W.  The other two stations tell the same story as Eureka, though temperatures at Clyde are warmer in absolute terms due to its more Southerly location.

Eureka temps4

The chart shows Annual, July and January averages along with the lifetime averages of Eureka station from 1948 through 2015.  There is slight variability, and a few years higher than average, but nothing alarming or even enough for people to sense any change.  Note also that annual averages are well below freezing, because only 3 months are above 0° C.  I suppose that someone could play with anomalies and generate a chart that looked scary, but the numbers in the record do not support fears of global warming and melting in Nunavut.

Conclusion

Once again we see media announcements that confuse subjective beliefs with empirical observations of objective reality.  And unfortunately, those observations are less and less available to counter the herd instincts of fearing the future and blaming someone.

Footnote

The map at the top shows how crucial is Nunavut to the Polar Ocean Challenge.  If the Northabout  successfuly negotiates the Northern Sea Route (the Russian side), they then must pass from Beaufort Sea through the Parry Channel (or alternative passages) to get to Baffin Bay.  Laptev is the first hurdle, and Nunavut is the last one.

Making the Climate Case

This post is to highlight two recent high quality documents making the case against climate alarms. These are important additions to anyone’s library of climate science resources.

Jamal Munshi has published papers on atmospheric ozone, and as a professor emeritus is free to speak his mind on the UN Environmental Program. His paper is entitled The United Nations: An Unconstrained Bureaucracy 

He provides the history of the UN’s self-serving growth by exploiting two false alarms, first the “ozone hole”, and then “climate change.” The story needs to be remembered and retold against the tide of alarming claims. Since this paper is posted at Tallbloke’s Talkshop, it will likely be part of the intellectual framework for the rising CLEXIT campaign.

Synopsis of The United Nations: An Unconstrained Bureaucracy

The case study takes a close look at the United Nations Environment Program (UNEP) by tracing its history from its humble and noble beginnings to the phenomenal growth in size, wealth, reach, and power of this taxpayer funded public sector bureaucracy.

Ozone Depletion:
For the UNEP to achieve its ambition of being the EPA for the world it needed a global catastrophic pollution problem which it could tackle and clean up just as the EPA had cleaned up the air and water in the USA. A series of events that began in the 1970s and culminated in 1985 provided them with just such an opportunity.

In view of the data presented here and in the prior studies we would like to think that the theory of ozone depletion by HHC and the ban on HHC to save the ozone layer are derived from bad science by good people who felt that they had to act quickly in accordance with the precautionary principle. However, because of the enormous gains made by the UNEP in implementing a program to solve a nonexistent problem and in view of a history of corrupt practices at the UN (Zaruk, 2014) (Ball, 2015) (Lynch, 2006) (Schaefer, 2012) (Dewar, 1995) (Rossett, 2006) (Rossett, 2008), intentional fraud and corruption for financial and bureaucratic gains by the United Nations cannot be ruled out.

Planetary Environmentalism: Climate Change
For the UNEP the frightening new global warming and climate change narrative served as yet another planetary air pollution crisis in which it could seize global leadership and grow in terms of size, funding, and power at the expense of taxpayers in donor countries. In this case, the global “air pollutant” was identified as the unnatural and extraneous new carbon dioxide from the combustion of fossil fuels. The UNEP responded to the events of 1988 almost immediately. It saw its opportunity and seized it having tasted great success in this kind of situation in the case of HHC pollution and ozone depletion.

The IPCC AR reports are biased. They are primarily concerned with selling the idea of climate change calamity and its mitigation by emission reduction. .Their use of science is limited to its utility in supporting that primary purpose. The bias in IPCC AR documents is documented in a 2010 commentary by the Netherlands Environmental Assessment Agency which took it upon itself to audit the IPCC AR4 WG2 forecasts and concluded that “The IPCC systematically favors adverse outcomes in a way that goes beyond serving the needs of policymakers.” (PBL, 2010). . .Yet another independent audit of the IPCC AR4 was carried out in 2011 by the Inter Academy Council (IAC), an international scientific body. The deficiencies are enumerated below. . . 

From the Summary:
They sold fear of catastrophic global warming and climate change allegedly caused by fossil fuel emissions but failed to duplicate their success in the first episode (ozone depletion) because of methodological flaws and also because their own bureaucratic incompetence created an emissions reduction plan that was too complicated to implement. The complication ensures an endless series of annual meetings of thousands of delegates at exotic locations with the only concrete achievement of each meeting being that of setting the date and place for the next meeting.

These episodes serve as evidence that unconstrained and undisciplined public sector bureaucracies do not serve the interest of the public. We conclude that such UN bureaucracies can safely be dismantled without any harm to the public interest.

The second document is a well-reasoned, well-referenced submission by CEI and allies Coalition Letter against the Council on Environmental Quality’s Draft Guidance on consideration of greenhouse gas emissions and climate change effects in enivronmental (NEPA) Reviews. The Final Guidance has just been proclaimed by the White House, despite the strong evidence presented in their submission.

Synopsis of Coalition Letter Against the CEQ Guidance for Environmental Reviews

National Environmental Policy Act (NEPA) review is an inappropriate framework for making climate policy. Project-related greenhouse gas (GHG) emissions should not be a factor determining whether agencies grant or deny permits for individual projects. The Guidance endorses the alarmist perspective of EPA’s GHG endangerment finding, instructs agencies to quantify indirect (upstream and downstream) as well as direct emissions of individual projects, and recommends the use of social cost of carbon (SCC) calculations in cost-benefit analysis of projects. Each of those elements separately, and especially all in combination, will embolden anti-development groups and politicize rather than improve agency decisions. The Draft Guidance should be withdrawn. A summary of key points follows.(Full text includes extensive supporting evidence)

1.EPA’s greenhouse gas endangerment finding is an inappropriate starting point for project-related environmental risk assessments.

2. NEPA review of project-related GHG emissions will politicize, not improve, agency decisions.

3. Incorporating social cost of carbon (SCC) analysis will turn NEPA review into a pseudo-science.

Conclusion
NEPA review is an inappropriate basis for determining climate change policy, and project-related GHG emissions should not be a factor determining whether agencies grant or deny permits for individual projects.

The Draft Guidance instructs agencies to incorporate analysis of project-related GHG emissions and climate effects in NEPA reviews. That will embolden anti-development groups and politicize rather than improve agency decisions. The Draft Guidance should be withdrawn.

Hollywood’s Climate Fantasy

At the DNC this week, the symbolism was perfect when Hollywood introduced a film presentation on climate change. The classic movie drama arises from one fundamental predicament: the hero confronts the villain threatening the town. It is all make-believe, as when actor Gary Cooper at high noon went out on a stage set to meet his scripted destiny, with the cameras rolling.

Of course, the retelling of the same story requires adding twists and expanded stakes, along with special effects. Now it is the global village at risk, and nature itself turning cancerous because of us. Good people want to stop the industrial poisonous machine, but evil deniers stand in the way. It is a cause for all time, to save the future for our children, and get people into the streets to make the difference.

But it is not science, it is fantasy. Nothing unusual is happening with the weather. There will be cooling as well as warming in the future, and we will need affordable reliable energy, as well as robust infrastructures, to survive and prosper. That will take sustained effort and practical, day-in, day-out attention to details. Not very dramatic stuff.

There is a word for the mental state of confusing make-believe with reality: It is called Delusion. It works as entertainment, but It is not a good frame of mind for policymakers.

Footnote:

If you have been taken in by global warming claims, you should know that temperature records show no unusual warming is occurring. (link below)

The Climate Story (Illustrated)

Climate Whack-A-Mole

The Joys of Playing Climate Whack-A-Mole

Dealing with alarmist claims is like playing whack-a-mole. Every time you beat down one bogeyman, another one pops up in another field, and later the first one returns, needing to be confronted again. I have been playing Climate Whack-A-Mole for a while, and if you are interested, there are some hammers supplied below.

The alarmist methodology is repetitive, only the subject changes. First, create a computer model, purporting to be a physical or statistical representation of the real world. Then play with the parameters until fears are supported by the model outputs. Disregard or discount divergences from empirical observations. This pattern is described in more detail at Chameleon Climate Models

A series of posts here apply reality filters to attest climate models.  The first was Temperatures According to Climate Models where both hindcasting and forecasting were seen to be flawed.

Others in the Series are:

Sea Level Rise: Just the Facts

Data vs. Models #1: Arctic Warming

Data vs. Models #2: Droughts and Floods

Data vs. Models #3: Disasters

Data vs. Models #4: Climates Changing

Climate Medicine

Climates Don’t Start Wars, People Do

virtual-reality-1920x1200

Beware getting sucked into any model, climate or otherwise.

Climatism and Virtual Virtues


Following an alert posted by Lubos Motl, I upgraded my windows operating system from #7 to #10, since the grace period is ending August 1. And it went quite smoothly in retrospect, but with much anxiety in the process. It seems that Windows Defender latest version doesn’t play as nice with other anti-malware programs. Also some head-scratching as to the usage of cpu by strangely named programs that may or may not be malware. And there are the inevitable hiccups and tweaks needed to restore operations as before.

It occurred to me in this process that the internet and the associated tools have become for us a kind of utility, like electricity. When we flip the light switch, the room should light up. And when we boot up our home computers, we expect to be on line and wired in. Any upgrade introduces uncertainty into that dependency, and is uncomfortable.

It also reflects on how much we modern urban dwellers exist within a cocoon of man-made structures, both physical and cyberspace. Extrapolating from our daily experience, it is a small step to thinking that the larger environment beyond our cocoons, if not entirely man-made, is at least hugely subject to human influence. And from that premise comes the climatism faith: the belief that mother Nature is being ruined by humans burning fossil fuels, that the planet will burn up, glaciers will melt, cities and islands will submerge, etc. etc. etc.

For centuries those who farm or otherwise make a living from the land or ocean have accepted and adapted to the uncertainties of weather and variable harvests. They are among the most skeptical concerning man-made climate change.

But the majority of university educated urban dwellers are converts to climatism, and participate more or less in a range of Virtual Virtues; i.e. Supporting abstract causes to protect Nature from humans. Some examples:
Save the Arctic: Support Greenpeace.:
Stop Rising CO2: Support 350.org.
Save Animals from extinction: Support WWF.
Etc.

These and other variations of “fighting Climate Change” give the illusion of “making a difference”, and thus feeling good about doing good. It is truly not about Science any more, it is about being Virtually Virtuous.

Footnote: In his lifetime, Marshall McLuhan foresaw the rise of the Global Village along with the return of tribalism, pre-conditions for the present obsession with climatism. Quotations:

“All media are extensions of some human faculty-psychic or physical.”

“The new electronic interdependence recreates the world in the image of a global village.”

“The world is now like a continually sounding tribal drum, where everybody gets the message…. all the time.”

“Our technology forces us to live mythically.”

“Politics will eventually be replaced by imagery.  The politician will be only too happy to abdicate in favor of his image, because the image will be much more powerful than he could ever be.”

“The more you create village conditions, the more discontinuity and division and diversity. The global village absolutely insures maximal disagreement on all points. It never occurred to me that uniformity and tranquility were the properties of the global village. It has more spite and envy. The spaces and times are pulled out from between people. A world in which people encounter each other in depth all the time. The tribal-global village is far more divisive — full of fighting — than any nationalism ever was. Village is fission, not fusion, in depth all the time.” (McLuhan “The Hot and Cool Interview” 57–58)

That full interview is the best summary of McLuhan’s views and is here.

Climate Lemmings (h/t Beth)


Radiation Myopia

A recent thread comment illustrates how the global warming PR campaign has installed a bogus climate paradigm in public awareness: The Supremacy of Infrared Radiation. In a discussion about clouds and the Arctic, this comment appeared:

I disagree with the comments that clouds at the poles should cause cooling.
In general the earth absorbs heat from the sun near the equator and expels it near the poles via up welling radiation. A low humidity clear sky near the poles allows most gray body radiation from the ice/oceans/land to emit directly to space. Clouds at the poles would interfere with that process and the poles would warm thus melting the ice faster. And in a general sense, that is what we’ve seen over the last 40 years. (linked to a graph of declining ice extent since 1979).

Heat Transfer Mechanisms

It takes some work to untangle the problems with this statement. Because it is true that earth’s climate system takes in solar energy mostly at the equator, which is then transported and expelled mostly at the poles. The myopia is in the notion that this is a purely radiative heat transfer. The misconception arises from confusing the view from the top of the atmosphere (TOA) with the view at the surface where we live. The TOA energy balance is purely radiative.  Incoming: Short Wave (SW) in, minus Outgoing: (SW) reflected/scattered out, and minus Long Wave (LW, mostly Infrared) emitted out.

Nearer the surface, the movement of energy is dominated by other more powerful heat transfers: Conduction (from warm to cool by direct contact), Convection (air moving from warm to cool objects) and Latent Heat (water changing phases from ice to liquid to gas and back again). These processes move massive amounts of energy upward from the surface toward the nearly absolute cold of space. IR active gases, mainly H2O and the minor trace gas CO2, do absorb and re-emit some LW energy, but at a scale orders of magnitude less.

Polar Heat Exchanges

The comment above attributes warming in the Arctic to the radiative properties of H20 in clouds. There is no claim that CO2 is a factor, since it acknowledges that clear dry skies offer no significant impediment to the cooling processes. But do water vapor and clouds delay cooling in the Arctic?

While it is true that moist air in the tropics makes for mild evenings after sundown, the Arctic situation differs. There is a short season when the summer sun shines, and most of the year is dark and extremely cold.

Most people fail to appreciate the huge heat losses at the Arctic pole. Mark Brandon has an excellent post on this at his wonderful blog, Mallemaroking.

By his calculations the sensible heat loss in Arctic winter ranges 200-400 Wm2.

The annual cycle of sensible heat flux from the ocean to the atmosphere for 4 different wind speeds.

As the diagram clearly shows, except for a short time in high summer, the energy flow is from the water heating the air. Transfers by latent heat are in addition to the above.

For a long time I misinterpreted the meaning of charts like the current one below from DMI:

meanT_2016DMI

Those are air temperatures, and if they are above average, it means that the water is losing more heat than past normals. It’s not that warmer air causes ice melt, but the other way around: Oceans are always moving heat, and more open water means more heat loss into the air, resulting in higher air temperatures, though still way below zero most of the year.

For comparison, look at the same chart from 1977 when ice extent was much higher the entire year:

Summary

So if there is to be any warming effect on ice formation from clouds, it can only happen in peak summer, the precise time when their shading effect exceeds any radiative warming.  And the existence of clouds indicates moisture in the air which came from the ocean evaporating.

The myopic focus on radiation and air temperatures leads into a false analogy:  thinking the Arctic is a kind of refrigerator. I explained in some detail why this is not so:  Arctic Is Not a Refrigerator

If one wants to use the refrigerator analogy in relation to earth’s climate, at least do it correctly as Dr. Salby does:

From Physics of the Atmosphere and Climate, pg.82

A closed system that performs work through a conversion of heat that is absorbed by it is a heat engine. Conversely, a system that rejects heat through a conversion of work that is performed on it is a refrigerator.

In Chap. 6, we will see that individual air parcels comprising the circulation of the troposphere behave as a heat engine. By absorbing heat at the Earth’s surface, through transfers of radiative, sensible, and latent heat, individual parcels perform net work as they evolve through a thermodynamic cycle (2.13). Ultimately realized as kinetic energy, the heat absorbed maintains the circulation against frictional dissipation. It makes the circulation of the troposphere thermally driven.

In contrast, the circulation of the stratosphere behaves as a radiative refrigerator. For motion to occur, individual air parcels must have work performed on them. The kinetic energy produced is eventually converted to heat and rejected to space through LW cooling. It makes the circulation of the stratosphere mechanically driven. Gravity waves and planetary waves that propagate upward from the troposphere are dissipated in the stratosphere. Their absorption exerts an influence on the stratosphere analogous to paddle work. By forcing motion that rearranges air, it drives the stratospheric circulation out of radiative equilibrium, which results in net LW cooling to space.

Troposphere=Heat Engine

Stratosphere = Refrigerator