Resilient Arctic Ice September 2021

The animation shows Arctic ice extents on day 248 in 2007 (matching 14 year average), then the same day in 2019, 2020, and yesterday in 2021.  Note that Hudson Bay upper left is open water, and below that Baffin Bay next to Greenland is also ice-free.  In the center Canadian Archipelago holds a lot of ice, especially this year.  Also unusual in 2021 is ice covering Svalbard lower right all the way to Europe mainland.  Also upper right 2021 shows ice in Chukchi touching Russian coastline.

The graph above shows mid-August to mid-Sept daily ice extents for 2021 compared to 14 year averages, and some years of note.  During the 17 days from August 18 to yesterday, the black  line shows Arctic Ice extent declined on average by 1M km2 (1 Wadham).  Meanwhile the cyan line shows MASIE 2021 ice extents lost only 171k km2, and Sea Ice Index (SII) in orange lost 317k km2. Note on day 230 all three lines started at the same value.

Why is this important?  All the claims of global climate emergency depend on dangerously higher temperatures, lower sea ice, and rising sea levels.  The lack of additional warming is documented in a post Adios, Global Warming

The lack of acceleration in sea levels along coastlines has been discussed also.  See USCS Warnings of Coastal Flooding

Also, a longer term perspective is informative:

post-glacial_sea_level
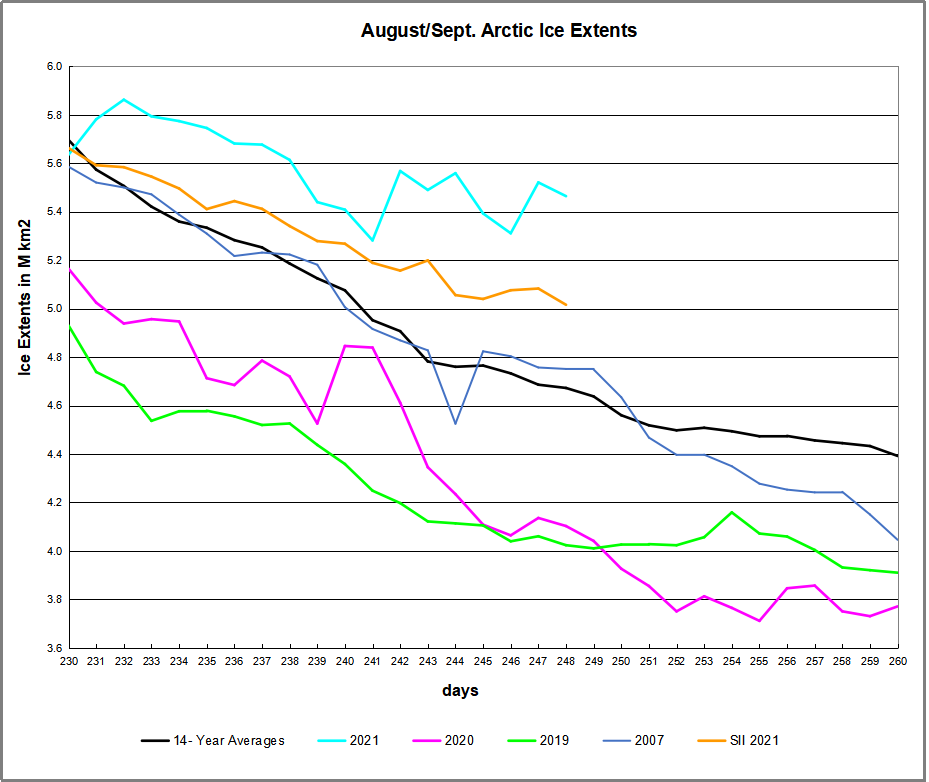
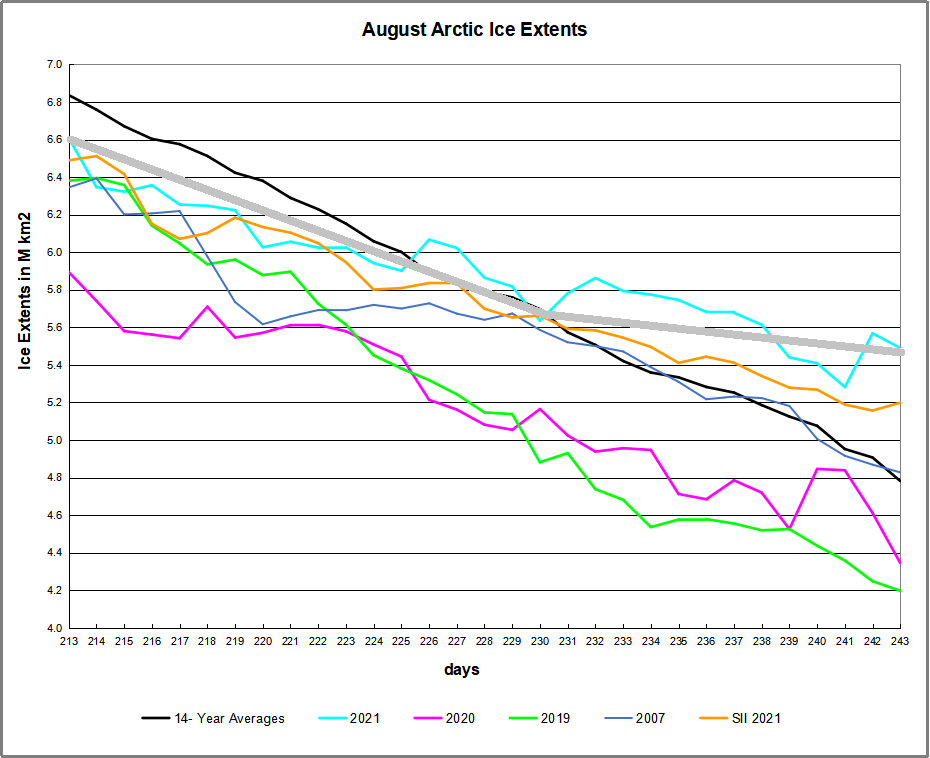
The table below shows the distribution of Sea Ice across the Arctic Regions, on average, this year and 2007.

Region 2021248 Day 248 Average 2021-Ave. 2007248 2021-2020
 (0) Northern_Hemisphere 5464375 4672631 791744 4751076 713299
 (1) Beaufort_Sea 798213 522472 275741 665051 133162
 (2) Chukchi_Sea 524060 202259 321800 116358 407702
 (3) East_Siberian_Sea 408523 310662 97862 6329 402195
 (4) Laptev_Sea 51574 143286 -91712 280600 -229026
 (5) Kara_Sea 122087 30192 91896 103072 19015
 (6) Barents_Sea 18 15631 -15612 10766 -10748
 (7) Greenland_Sea 98270 176374 -78104 334524 -236254
 (8) Baffin_Bay_Gulf_of_St._Lawrence 16983 23131 -6148 31787 -14804
 (9) Canadian_Archipelago 440366 288302 152064 270755 169612
 (10) Hudson_Bay 39285 15338 23947 29961 9324
 (11) Central_Arctic 2963852 2944150 19702 2900617 63235

The overall surplus to average is 792k km2, (+17%).  Note large surpluses of ice in BCE (Beaufort, Chukchi and East Siberian seas).  Meanwhile Laptev on the Russian coast melted out early, as has Greenland Sea.  Kara and CAA (Canadian Arctic Archipelago) are holding considerable ice.  We are about 12 days away from the annual minimum mid September, but at this point it appears that extents will be much greater than the last two years.

See also Abundant August Arctic Ice with 2021 Minimum Outlook

bathymetric_map_arctic_ocean


Illustration by Eleanor Lutz shows Earth’s seasonal climate changes. If played in full screen, the four corners present views from top, bottom and sides. It is a visual representation of scientific datasets measuring Arctic ice extents.

Yes, Daily Mail, You are Discredited by Fake IVM Story

97178-ivermectin

Daily Mail, along with other legacy news published this:

Overdoses from anti-parasite drug ivermectin overwhelm rural Oklahoma hospitals – leaving gunshot victims waiting for emergency rooms

Hospitals in rural southeast Oklahoma are struggling with a surge of ivermectin overdose patients
♦ So many patients are coming in with overdoses of the horse-grade medicine that other serious injuries – like gunshot wounds – have to wait
Ivermectin is FDA approved for human use fighting some parasite-related conditions, but has not demonstrated that it can fight viruses in humans
♦ Many are purchasing versions of the drug meant for horses and other large animals, where doses are dangerous for humans

Rolling Stone, who was also taken in published the facts in this correction:

UPDATE: Northeastern Hospital System Sequoyah issued a statement: Although Dr. Jason McElyea is not an employee of NHS Sequoyah, he is affiliated with a medical staffing group that provides coverage for our emergency room. With that said, Dr. McElyea has not worked at our Sallisaw location in over 2 months. NHS Sequoyah has not treated any patients due to complications related to taking ivermectin. This includes not treating any patients for ivermectin overdose. All patients who have visited our emergency room have received medical attention as appropriate. Our hospital has not had to turn away any patients seeking emergency care. We want to reassure our community that our staff is working hard to provide quality healthcare to all patients. We appreciate the opportunity to clarify this issue and as always, we value our community’s support.”

This cynical, outrageous media campaign appeared in a previous post:  No, Guardian, Ivermectin Not Discredited by Elgazzar Retraction

The hits against Ivermectin keep on coming.  Dr. Colleen Aldous and Dr. Warren Parker explain this latest smear campaign in their article Ivermectin — front-line doctors vs bureaucrats.  Excerpts in italics with my bolds.

Given the safety profile of Ivermectin, there is nothing to lose and there’s a good possibility of saving many lives and slowing the pandemic

The Ivermectin battle of ideologies on safety and efficacy pits a group of doctors who deal with dying patients every day against bureaucrat academic clinicians. These academic clinicians have dismissed all evidence, favouring a single, large randomised trial that is entirely appropriate for novel drug development but not for pandemics.

This is akin to a person suffering a heart attack and refusing to be taken to hospital in a Toyota, choosing to wait for a Rolls-Royce.

If science is pure, there should not really be a debate, but there is, and it’s purely on the interpretation of science. The Ivermectin meta-analyses have shown that subjectivity in science does happen, something the layperson is made to believe is not possible.

Unfortunately, scientific fraud has also muddied the picture on both sides of the Ivermectin divide. The Elgazzar Ivermectin study, which showed Ivermectin to be highly effective, has been removed from the preprint website for unethical scientific reporting. If this is found to be true it is unforgivable and the authors need to be dealt with.

I’ve no doubt that this will be used to discredit Ivermectin, but it is one of many trials showing efficacy and will be shown to have little weight in the meta-analyses. Just because one lawyer is guilty of corruption does not mean all lawyers are corrupt. In the same vein, a study published in leading medical journal Lancet, showed that hydroxychloroquine as a treatment for Covid-19 was associated with an increased risk of death in patients hospitalised with the disease. However, it was found to be fraudulent and the Lancet was forced to retract the paper.

Bias can come in selecting studies to include in the analysis and the interpretation of the results. Ivermectin can be shown to work by a careful selection of studies that support it. It can be discredited by selecting studies that show it is ineffective.

The SA National Essential Medicines List Committee (NEMLC), which has published its methods on its website, has produced an in-house rapid-review on Ivermectin, which continues to find that Ivermectin should not be used outside clinical trials. This review is not peer-reviewed. The scientific community emphasises the importance of peer-review publication, but our regulatory authorities seem not to. To illustrate the degree of subjectivity, I was in a meeting with one of the authors from the Bryant paper and a NEMLC member. In the discussion the latter stated that while they are aware of the work done in their preprint paper, they disagree with it. Simple!

The methods used in the Ivermectin meta-analyses by Bryant et al are exact. They have a very low risk of bias in themselves. Meta-analyses pool data from several studies to report for a larger sample size than the studies themselves. The heterogeneity of the studies is addressed with rigorous methods to reduce the effect of bias from the individual studies. Bryant et al have careers in data and research analysis. They have prepared decision-to-treat recommendations for international and country-level health bodies.

Their analysis included 24 randomised controlled trials that showed both positive and negative outcomes. The recommendation, among others, is that with moderate certainty Ivermectin could reduce mortality by an average of 62%. Moderate certainty means there is a good chance it is effective to this level.

From looking at their methods in their peer-reviewed publication I believe the selection and interpretation of results were unbiased and currently provide us with recommendations that are more than sufficient to validate the positive effects of Ivermectin for treating Covid-19.

Simply put, SA’s response is now guided by the recommendations of an in-house team over a peer-reviewed, rigorously prepared meta-analysis. The NEMLC document is the guidance observed by all health department facilities and also some private hospitals.

Concerning the Ivercor-Covid-19 trial, it’s a pity all those who have stated that this study is proof that Ivermectin doesn’t work did not read the paper in its entirety. The authors themselves declare in the limitations of their research that the doses given are were low.

As the pandemic has progressed, experience on the ground has shown that Ivermectin is effective at higher doses. Initial recommended doses were low, having been informed by the dosages for anti-parasite treatment. Unfortunately, many trials that are now being run or are completed are using low doses based on earlier assumptions. Even the upcoming Oxford Principle trial of Ivermectin follows low dose regimes that may be insufficient to show effect.

The Lopez-Medina study in Colombia is also often cited as demonstrating that Ivermectin is ineffective. Yet it was so fraught with protocol violations that I would not have submitted the article for publication if I were the principal investigator.

The NEMLC has put the health of our people at risk by recommending against the use of Ivermectin even though it is legally available in SA for off-label use or in the compassionate use programme. Proper evidence-based medicine involves looking at all current evidence conscientiously, not just at a few trials.

During the latter half of the last century our ways of doing science have developed in times of stability and relative prosperity. However, we are in chaos now. We need new thinking. Those in authority are still pushing for their conventional methods for science, which insists that “reality must obey our models… otherwise reality cannot be correct”.

We need more than just a few clinical experts making decisions for our country now that we are hitting this third wave. I believe it is time to put together a multidisciplinary team to examine the arguments of those saying that the totality of evidence points to the necessity of making a Type 1 decision now, roll out Ivermectin.

Given the safety profile of Ivermectin, with nearly 4bn doses given since the 1980s, there is nothing to lose. At worst, it would be like taking an aspirin to ease pain for a bee sting. It won’t harm, but it may help.

If Ivermectin is used, there is a good possibility of saving many lives and slowing down the pandemic. But suppose we have to wait for that elusive large double-blind, randomised control trial (the Rolls-Royce) that will provide the ultimate certainty of the gold standard. In that case, there may be many thousands of unnecessary deaths still to come.

• Dr Aldous is a professor and healthcare scientist at the University of KwaZulu-Natal Medical School, where she runs the doctoral academy at the College of Health Sciences. She has published over 130 peer-reviewed articles in rated journals. Dr Parker, an international public health specialist, has worked in more than 20 countries on health and development concerns, with a focus on translating research into strategic policy.

Footnote:  The Bryant et al. meta-analysis study is discussed here:  Ivermectin Invictus: The Unsung Covid Victor

Why Can’t They See that HCQ or Ivermectin + nutritional supplements
is the missing public health pillar?

Pillars Needed Missing

Japanese Medical Chairman Doubles Down on IVM

In February 2021, Dr. Ozaki Chairman of the Tokyo Medical Association declared that Japan’s physicians should get a greenlight to prescribe IVM (Ivermectin) at the first sign of SARS CV infections.

Now in August, Tokyo Medical Association chairman Haruo Ozaki reiterated that ivermectin should be widely used and said that his early recommendations have not been heeded in Japan.  See Lifesite article August 30, 2021 Japanese medical chairman doubles down on ivermectin support after early calls went ignored.  Excerpts in italics with my bolds

In an interview with the The Yomiuri Shimbun on August 5, Ozaki spoke in detail about his opinion that ivermectin should be used in Japan and said that his early calls for usage have seemingly not been heeded.

He stated that there is evidence from multiple countries that ivermectin has proven effective for patients diagnosed with COVID: “I am aware that there are many papers that ivermectin is effective in the prevention and treatment of [coronavirus], mainly in Central and South America and Asia.”

Chairman Ozaki stated that despite evidence suggesting the efficacy of ivermectin, it is difficult to obtain the medication. He added that while ivermectin’s established effectiveness is increasingly clear, the U.S. company that manufactures the drug, Merck & Co., Inc., have currently limited distribution because they claim that the drug is ineffective at treating COVID.

“With the view that it is not effective for the treatment and prevention of sickness, there is an intention that it should not be used for anything other than skin diseases such as psoriasis.”

This has led to a situation where, according to Ozaki, “Even if a doctor writes a prescription for ivermectin, there is no drug in the pharmacy.” He said that this has rendered the drug practically “unusable.”

He contends that the fact that supply has been stopped by Merck & Co. is evidence that it does in fact work at treating COVID: “But (Merck) says that ivermectin doesn’t work, so there shouldn’t be any need to limit supply. If it doesn’t work, there’s no demand. I believe it works, so block supply. It looks like you are.”

He said that he “also told the Japan Olympic Committee that ivermectin should be used effectively when holding the Tokyo Olympics. But the government didn’t do anything.”

He addressed the reluctance on behalf of the medical establishment in using ivermectin to treat COVID. He said “there are problems for researchers in academia and professors in universities. Many do not do anything by themselves, but they are of the opinion of international organizations such as the WHO and large health organizations in the United States and Europe that ‘it is not yet certain whether ivermectin will work for the [coronavirus].’”

“We don’t do it on our own initiative, but only on the opinions of others. Why don’t we try to see for ourselves why ivermectin works? It is deplorable that there are critics, researchers, and scholars who are constantly criticizing without doing anything. I hope that Japanese academics will contribute more actively.”

Evidence that ivermectin is effective in treating COVID has been well attested in developing nations where vaccines are not widely distributed. Another study in France also suggested that ivermectin ought to be used as a remedy for COVID.

On May 25, the Indian Bar Association served a legal notice to Dr. Soumya Swaminathan, a Chief Scientist for the World Health Organization (WHO), relating to the harm she allegedly caused the people of India by campaigning against the use of ivermectin.

In Mexico city, a home-treatment-kit, including ivermectin was created, for its 22 million-strong population on December 28, 2020, following a spike in cases of COVID-19. Also, doctors were encouraged to use Ivermectin and other therapeutic drugs in their practice when dealing with COVID-positive patients. The effort resulted in a 52–76 percent reduction in hospitalizations, according to research by the Mexican Digital Agency for Public Innovation (DAPI), Mexico’s Ministry of Health, and the Mexican Social Security Institute (IMSS).

Following that came a public statement by another prominent Japanese physician, Dr. Kazuhiro Nagao, who appeared on Japanese television proposing that COVID-19 should be treated as a Class 5 illness as opposed to its current classification as a Class 2. In Japan, illnesses are categorized by a classification system; approaching COVID as a Class 5 illness would mean that it could be treated like a seasonal flu.

Dr. Nagao said he has used Ivermectin as an early treatment for over 500 COVID patients with practically a 100% success rate, and that it should be used nationwide.

About the effectiveness of Ivermectin in treating COVID patients, he said: “It starts being effective the very next day… My patients can reach me by message 24/7 and they tell me they feel better the next day.”

Nagao was asked by the TV anchor when patients should take Ivermectin if diagnosed with COVID-19. He replied: “The same day, I mean if you are infected today, you take it today… It is a medication that should be given for mildly ill patients. If you give it to hospital patients, it’s too late. This is also the case for the majority of drugs… So you have to give Ivermectin. I am asking our Prime Minister Suga to distribute this drug ‘made in Japan’ on a large scale in the country.

He added that four pills should be distributed to everyone in the country, so that people can take them “as soon as you are infected.”

Footnote: 

As Dr. Ozaki suggests Big Pharma wants to banish any treatments that are cheap and effective. Doing the math:

An Ivermectin course for COVID is less than twenty dollars.

A course of REMDESEVIR is currently right at $8800.00 dollars. (and often doesn’t work)

An outpatient treatment with monoclonal antibodies is right at $23,000.00 – 25,000.00 dollars with all the infusion costs added.

That’s not to mention obscene vaccine profits.

Exposed: Ballot Trafficking in Georgia and Arizona

Ballot Drop Box in Georgia, USA

Exclusive — True The Vote Conducting Massive Clandestine Voter Fraud Investigation

True The Vote organization has spent the last several months since late last year collecting more than 27 terabytes of geospatial and temporal data—a total of 10 trillion cell phone pings—between Oct. 1 and Nov. 6 in targeted areas in Georgia, Arizona, Michigan, Wisconsin, Pennsylvania, and Texas. The data includes geofenced points of interest like ballot dropbox locations, as well as UPS stores and select government, commercial, and non-governmental organization (NGO) facilities.

“From this we have thus far developed precise patterns of life for 242 suspected ballot traffickers in Georgia and 202 traffickers in Arizona,” True The Vote’s document says. “According to the data, each trafficker went to an average of 23 ballot dropboxes.

In other words, what the document says is that True The Vote was able to take cell phone ping data on a mass wide scale and piece together that several people—suspected ballot harvesters—were making multiple trips to multiple drop boxes, raising potential legal questions in a number of these states.

From there, the document continues, True The Vote gathered surveillance video on the drop boxes in Georgia and is attempting to gather similar such surveillance video from other states. The document states that True The Vote has obtained one full petabyte of surveillance footage on drop boxes—two million minutes of video—which it says is broken into 73,000 individual video files. The group is expected to begin releasing some of these videos, which purportedly show the same people going multiple times to the same drop boxes, in the coming weeks.

“We are building out video stories and have compiled videos of individuals stuffing ballot dropboxes with stacks of ballots, individuals depositing ballots in multiple dropboxes, unauthorized coordination between government workers engaged in the exchange of ballots, and several other tranches of video that capture unusual patterns such as the wearing of gloves to deposit ballots, taking pictures of ballot deposits, etc.,” True The Vote’s document says.

As for states other than Georgia, True The Vote’s document says that the status of such surveillance video is as of now unclear. “Video availability in other states is undetermined; open records requests submitted consistently since January continue to be met with conflicting communications and stalls,” True The Vote’s document says.

The group says also that it has at least three teams of analysts combing through the raw data and the surveillance video seeking out individual stories and other trends, and that it has been in contact with federal and state law enforcement in various states on what it has found and determined already.

There are several reasons why this revelation about True The Vote’s effort is significant. First and foremost, these revelations come amid several ongoing so-called “audits” in a number of states like Arizona nationally—the results of the Arizona audit are imminently expected—and other efforts by some allies of former President Donald Trump to continue the push for illuminating what happened in the 2020 presidential election. Most of the aforementioned have either not been fruitful, or perhaps have even damaged the former president’s cause by either not being factual or by being incomplete in their nature or for other reasons which cast doubt on their credibility. This self-described effort from True The Vote could change the discussion by providing proof—complete with cell phone data and surveillance video—of allegedly illegal activity that could lead to much more drastic action by law enforcement or political leaders in these various states.

These revelations could be coming amid a renewed push from national Democrats in Washington, DC, to pass some form or another of a federal election takeover plan – whether it be HR1, S1, or a new push for the John Lewis Voting Rights Act, which was HR4 in the last Congress. So far this year, such efforts by Democrats have failed and stalled out in the evenly-divided U.S. Senate as the filibuster has prevented their passage.


Biden Wrong, SCOTUS Right re Texas Fetal Heartbeat Law

The best discussion comes from Josh Blackman’s article at Newsweek The Supreme Court Could Not ‘Block’ Texas’ Fetal Heartbeat Law | Opinion. Josh Blackman is a constitutional law professor at the South Texas College of Law Houston and the co-author of An Introduction to Constitutional Law: 100 Supreme Court Cases Everyone Should Know. He explains why the ruling is more about overinflated expectations of judicial authority than about the issue of abortion itself.  Excerpts in italics with my bolds.

On Wednesday, the U.S. Supreme Court declined to intervene in a challenge to S.B. 8, Texas’ new abortion law. This unique statute empowers private citizens to sue those who perform or facilitate abortions. President Biden ripped the 5-4 decision, charging that the conservative justices followed “procedural complexities” “rather than use its supreme authority to ensure justice.”

© Kevin Dietsch/Getty Images A person walks on the steps of the U.S. Supreme Court on September 02, 2021 in Washington, DC

Biden is wrong. The Court has no sweeping, majestic power to “ensure justice.” Indeed, it is a myth that courts can “strike down” laws at all. Rather, judges have a very limited power: to enjoin specific government officials from enforcing laws against specific litigants. The judiciary cannot simply erase statutes from the book. And when the government plays no role at all in enforcing a statute—as with S.B. 8—courts cannot “block” that law from going into effect.

In future cases, the courts can assess the constitutionality of S.B. 8. For now, the Supreme Court was right to reject the premature challenge.

In recent years, abortion laws in Texas have all met a similar fate. At each session, the conservative legislature imposes a suite of new restrictions on abortion. But before the law even goes into effect, Planned Parenthood and other abortion providers sue the Texas attorney general. Federal judges in Austin agree, and prevent the attorney general from enforcing the law. And as the litigation drags on for years, all the way up to the Supreme Court, the law remains a dead letter.

But this session, Texas tried something new. S.B. 8 allows private citizens to sue those who perform abortions. The government itself is expressly barred from enforcing the law.

With a clever flip, S.B. 8 spiked Planned Parenthood’s playbook. It is now impossible to sue the attorney general, because the attorney general cannot enforce the law. The law can only be enforced by millions of Texans. And there is no way to know in advance who would sue which abortion providers. So Planned Parenthood tried a different strategy: It sued Judge Jackson of Tyler, Texas, who might one day hear a case involving S.B. 8.

This suit never made any sense. Judges do not enforce laws. They can only adjudicate specific disputes between plaintiffs and defendants. If a Texan actually sued Planned Parenthood for performing a seven-week abortion, the judge would have to dismiss that suit. After all, S.B. 8 expressly stipulates that citizens’ suits must comply with Roe v. Wade. And you don’t sue a judge to stop him from hearing a case in the first place. You let him decide and then appeal, if need be.

Despite these problems, a federal judge in Austin still ruled that Planned Parenthood could sue Judge Jackson. The Austin court was poised to block Judge Jackson from even accepting a case emanating from S.B. 8. But the U.S. Court of Appeals for the Fifth Circuit promptly put that federal court’s proceedings on hold. Planned Parenthood then filed an emergency appeal to the Supreme Court.

This appeal was doomed from the start. Because Planned Parenthood only sued one judge, the Supreme Court could only have issued an order against that single jurist. No other judge in Texas was a named party to the case. An order against Judge Jackson would have been meaningless for Planned Parenthood, as all other judges in the state would have been able to accept suits based on S.B. 8. The abortion rights group was stuck.

Late Wednesday evening, the Supreme Court split 5-4. The majority opinion was joined by Justices Clarence Thomas, Samuel Alito, Neil Gorsuch, Brett Kavanaugh and Amy Coney Barrett. The conservative quintet recognized that Planned Parenthood likely could not prevail. The justices explained that “federal courts enjoy the power to enjoin individuals tasked with enforcing laws, not the laws themselves.” In short, the justices cannot erase S.B. 8 from the statute books. They can only prevent a specific person—in this case, Judge Jackson—from hearing a case involving S.B. 8 against Planned Parenthood and other groups. That’s it. Even then, the Supreme Court recognized that the suit against Judge Jackson was on shaky ground, as “it is unclear whether” he “can or will seek to enforce the Texas law against” the abortion clinics.

The Supreme Court could not, as President Biden suggested, exercise “supreme authority to ensure justice could be fairly sought.” No such power exists. In this case, the Court could only enter an order against one state judge—and that judge had no role in actually enforcing the law. The justices were absolutely correct for declining to intervene.

Indeed, this case should have been unanimous. Alas, it was not. Chief Justice John Roberts and the Court’s three progressives each wrote separate dissents. Chief Justice Roberts would have “grant[ed] preliminary relief to preserve the status quo ante.” But a remedy to preserve the status quo ante would be impossible in this case, which only concerned Judge Jackson. Roberts wrote that he would “preclude enforcement of S.B. 8 by” Judge Jackson. But, again, Judge Jackson cannot actually enforce the law in the first place. The chief justice, usually a stickler for procedure, was willing to invent new procedural rules to stop what he saw as an “unprecedented” law.

Justice Sonia Sotomayor made similar mistakes in her own dissent. She said the “Court should have stayed implementation of” S.B. 8. But courts cannot block laws. Courts can only prevent specific parties from enforcing the law against specific litigants. None of the dissenters had any clue how to actually stop S.B. 8—not even Justice Elena Kagan, a brilliant former civil procedure professor. She had bupkus. Indeed, Chief Justice Roberts acknowledged that Texas “may be correct.”

Why, then, did the dissenters offer a remedy that simply could not be granted? This quartet endorsed President Biden’s mythical account of the Supreme Court.

At least three of the four dissenters deeply felt that this law was substantively unjust, so there must be a way to stop it. But not every alleged wrong has a remedy in federal court. In time, actual Texans will file suit against abortion clinics, and those who fund the organizations. And the courts can then decide, at that time, if those suits are consistent with Roe v. Wade and its progeny.

But for now, the Supreme Court was right to stay on the sidelines.

Footnote:

Regarding the delusion of judicial authority for social engineering, do read Francis Menton’s expose of the same mythology running rampant in Europe with respect to global warming/climate change (not to mention genderism and diversity).  More On European Climate Change Litigation: These People Are Crazy

And once again Team Biden acts to divide and destroy anything they touch.  How prescient was I when creating this image a year ago.


Covid19–You’re Safer than You Think

The political and media messaging about the coronavirus prevents the citizenry from connecting the dots and realizing how fear is exaggerated in order to impose social controls.  Let’s put the pieces together.

1.  Natural Immunity is as Good or Better Than Vaccine Immunity

Michael Nadler explains at American Thinker Director of the National Institutes of Health grossly misstates the science on vaccination vs. natural immunity.  Excerpts in italics with my bolds.

On the August 12, 2021 Special Report, Bret Baier asked NIH director Francis Collins: “Can you definitely say to somebody that the vaccine provides better protection than the antibodies you get from actually having had COVID-19?”

Dr. Collins replied to Bret and the almost 2 million viewers of Special Report:

“Yes, Bret, I can say that. There was a study published by CDC just ten days ago in Kentucky, and they looked specifically at people who had had natural infection and people who had been vaccinated and then ended up getting infection again. So what was the protection level? It was more than two-fold better for the people who had had the vaccine in terms of protection than people who had had natural infection. That’s very clear in that Kentucky study. You know that surprises people. Kind of surprised me that the vaccine would actually be better than natural infection. But if you think about it, it kinda makes sense[.] … That’s a settled issue.”

I was one of those who did find this quite surprising, given my familiarity with studies such as this one from the Cleveland Clinic and my basic understanding of how immunity is conferred by mRNA vaccines versus the natural immunity arising from prior infection.

However, based on the unequivocal statement on national TV by Dr. Collins, a highly respected scientist leading one of our nation’s pre-eminent public health agencies, that the issue is settled, I adjusted my thinking about vaccine immunity versus natural immunity from prior infection.

Fast-forward to the following night’s Special Report to watch and listen to Admiral Brett Giroir, former assistant secretary for health during the Trump administration while concurrently serving in several other public health positions. Dr. Giroir responded to a question about the confusion that arose from Dr. Collins’s conversation on Special Report the night before. He pointed out that Dr. Collins’s statement the previous night about the superiority of vaccine immunity over natural immunity and his citation of the Kentucky/CDC study as evidence were “factually incorrect.”

It is worth watching the whole conversation, but key points made by Dr. Giroir include the following:

It has not been shown that natural immunity, the immunity you have after infection, is any inferior to the immunity you have after vaccination. And, in fact, there is growing evidence that natural immunity lasts a long time and is highly protective against infection and hospitalization[.] … The study that Dr. Collins quoted did not have anything to do with people who had been vaccinated or who had natural immunity. What it proved [is] that if you were previously infected, your chance of getting COVID in the middle of Delta in Kentucky was about 1 in a thousand to get COVID again. If you got vaccinated that dropped it to 1 in 2500 so that’s a reduction but still your risks were very, very low[.] … This does not deal with people who were naturally immune vs. vaccinated. That’s a whole different question and it begs the question about whether you have antibodies, is that as good as being vaccinated? And the data right now pretty much say it is.

To clarify, the CDC published a report on a Kentucky study of people who had previously been infected with COVID-19. The study addressed the question of whether being vaccinated after already being infected provides additional protection; and the findings suggest that vaccination does provide additional protection when added to immunity provided by previous natural infection. But Dr. Collins relied on this study to make a definitive statement in response to an entirely different question: whether vaccination of people who were not previously infected provides better protection than does immunity obtained from previous infection. This study sheds absolutely no light on that question.

Given the factually incorrect statements made by the head of the NIH on national TV, we are left to wonder how much we can trust about what our highest-level public health officials tell us. And when they do mislead us, is it intentional, is it carelessness in communications, or is it because they are mistaken in their understanding of the science? In the case of Dr. Collins’s statement on Special Report, all but the most cynical have to conclude it is the third.

This then raises the question as to how such an eminent scientist can get it so wrong. This is a much tougher question to answer without discussing the issue directly with Dr. Collins. I would speculate that we have a case of confirmation bias, the tendency to interpret new evidence as confirmation of one’s existing beliefs or theories. What might the source of this bias be?

The Biden administration has made vaccination numbers a key measure of its progress in leading the fight against COVID-19, as it should. However, in order to keep the public focused on vaccination as a universal necessity, and in its apparent approval of vaccine mandates, the public health bureaucracy has been quite conspicuous in minimizing any mention of the role, effectiveness, and extent of natural immunity arising from previous infection.

According to a number of outside experts such as Marty Makary, “[r]equiring the vaccine in people who are already immune with natural immunity has no scientific support.” So as part of the public health bureaucracy which is invested in President Biden’s objective of universal vaccination, Dr. Collins might easily have misread the Kentucky/CDC study as strong evidence that natural immunity is not nearly as effective as vaccination.

In this regard, I don’t hold the CDC blameless. For example, I’m not sure if the CDC has even acknowledged studies like the one at the Cleveland Clinic showing strong protection due to natural immunity arising from previous infection. And particularly after Dr. Collins’s misreading, it would behoove the CDC to add a statement in the Summary or Discussion sections of its report on the Kentucky study making it clear that it does not address the question of the relative effectiveness of vaccination vs. natural immunity.

2.  One of Three Americans Have Natural Immunity

Columbia Public Health published this report One in Three Americans Already Had COVID-19 by the End of 2020.  Excerpts in italics with my bolds.

Undocumented Infections Accounted for Estimated Three-Quarters of Infection Last Year

A new study published in the journal Nature estimates that 103 million Americans, or 31 percent of the U.S. population, had been infected with SARS-CoV-2 by the end of 2020. Columbia University Mailman School of Public Health researchers modeled the spread of the coronavirus, finding that fewer than one-quarter of infections (22%) were accounted for in cases confirmed through public health reports based on testing.

The study is the first to comprehensively quantify the overall burden and characteristics of COVID-19 in the U.S. during 2020. The researchers simulated the transmission of SARS-CoV-2 within and between all 3,142 U.S. counties using population, mobility, and confirmed case data.

The portion of confirmed cases reflected in the study’s estimates, i.e. the ascertainment rate, rose from 11 percent in March to 25 percent in December, reflecting improved testing capacity, a relaxation of initial restrictions on test usage, and increasing recognition, concern, and care-seeking among the public. However, the ascertainment rate remained well below 100 percent, as individuals with mild or asymptomatic infections, who could still spread the virus, were less likely to be tested.

“The vast majority of infections were not accounted for by the number of confirmed cases,” says Jeffrey Shaman, PhD, professor of environmental health sciences at Columbia University Mailman School of Public Health. “It is these undocumented cases, which are often mild or asymptomatic infections, that allow the virus to spread quickly through the broader population.”

Comment:  

A person infected but without enough viral load to be sick is not likely to be contagious.  The exception is the first few days for someone who goes on to be severely ill afterward. All of these people (infected but not “cases”) had immune systems that stopped the virus from replicating in their bodies.  Ironically, had they been subjected to PCR tests, they would have shown as positives, and then mislabeled as “cases” despite their wellness.

Because of the political drive to vaccinate everyone, the powers-that-be deny that nearly a third of the population is already blessed with immunity without being vaccinated.  And this goes without considering the evidence that youngsters’ immune systems are superior to adults when it comes to coronaviruses (SARS-CV2 being the fifth one in circulation).  Superior here means preventing illness severe enough to be life-threatening, or to require hospital or extended care.  Neither vaccines nor natural immunities prevent infections, only limit the effects to runny noses and/or coughs.

For a discussion of natural immunity mechanisms see SARS Cross-Immunity from T-cells

3.  Vaccine Mandates Are Not Justified

Evidence is building that immunity after infection is superior to vaccine-induced immunity.  This Israeli study is a recent example: Comparing SARS-CoV-2 natural immunity to vaccine-induced immunity: reinfections versus breakthrough infections.  Excerpts below with my bolds.

Background Reports of waning vaccine-induced immunity against COVID-19 have begun to surface. With that, the comparable long-term protection conferred by previous infection with SARS-CoV-2 remains unclear.

Methods We conducted a retrospective observational study comparing three groups: (1)SARS-CoV-2-naïve individuals who received a two-dose regimen of the BioNTech/Pfizer mRNA BNT162b2 vaccine, (2) previously infected individuals who have not been vaccinated, and (3) previously infected and single dose vaccinated individuals. Three multivariate logistic regression models were applied. In all models we evaluated four outcomes: SARS-CoV-2 infection, symptomatic disease, COVID-19-related hospitalization and death. The follow-up period of June 1 to August 14, 2021, when the Delta variant was dominant in Israel.

Results SARS-CoV-2-naïve vaccinees had a 13.06-fold (95% CI, 8.08 to 21.11) increased risk for breakthrough infection with the Delta variant compared to those previously infected, when the first event (infection or vaccination) occurred during January and February of 2021. The increased risk was significant (P<0.001) for symptomatic disease as well. When allowing the infection to occur at any time before vaccination (from March 2020 to February 2021), evidence of waning natural immunity was demonstrated, though SARS-CoV-2 naïve vaccinees had a 5.96-fold (95% CI, 4.85 to 7.33) increased risk for breakthrough infection and a 7.13-fold (95% CI, 5.51 to 9.21) increased risk for symptomatic disease. SARS-CoV-2-naïve vaccinees were also at a greater risk for COVID-19-related-hospitalizations compared to those that were previously infected.

Conclusions This study demonstrated that natural immunity confers longer lasting and stronger protection against infection, symptomatic disease and hospitalization caused by the Delta variant of SARS-CoV-2, compared to the BNT162b2 two-dose vaccine-induced immunity. Individuals who were both previously infected with SARS-CoV-2 and given a single dose of the vaccine gained additional protection against the Delta variant.

Martin Kulldorf of Harvard weighs in:

“In Israel, vaccinated individuals had 27 times higher risk of symptomatic COVID infection compared to those with natural immunity from prior COVID disease [95%CI:13-57, adjusted for time of vaccine/disease]. No COVID deaths in either group.”

Jon Miltimore draws the implications: Harvard Epidemiologist Says the Case for COVID Vaccine Passports Was Just Demolished. Excerpts in italics with my bolds.

A Death Blow to Vaccine Passports?

The findings come as many governments around the world are demanding citizens acquire “vaccine passports” to travel. New York City, France, and the Canadian provinces of Quebec and British Columbia are among those who have recently embraced vaccine passports.

Meanwhile, Australia has floated the idea of making higher vaccination rates a condition of lifting its lockdown in jurisdictions, while President Joe Biden is considering making interstate travel unlawful for people who have not been vaccinated for COVID-19.

Vaccine passports are morally dubious for many reasons, not the least of which is that freedom of movement is a basic human right. However, vaccine passports become even more senseless in light of the new findings out of Israel and revelations from the CDC, some say.

Harvard Medical School professor Martin Kulldorff said research showing that natural immunity offers exponentially more protection than vaccines means vaccine passports are both unscientific and discriminatory, since they disproportionately affect working class individuals.

“Prior COVID disease (many working class) provides better immunity than vaccines (many professionals), so vaccine mandates are not only scientific nonsense, they are also discriminatory and unethical,” Kulldorff, a biostatistician and epidemiologist, observed on Twitter.

Nor is the study out of Israel a one-off. Media reports show that no fewer than 15 academic studies have found that natural immunity offers immense protection from COVID-19.

The Bottom Line

Vaccine passports would be immoral and a massive government overreach even in the absence of these findings. There is simply no historical parallel for governments attempting to restrict the movements of healthy people over a respiratory virus in this manner.

Yet the justification for vaccine passports becomes not just wrong but absurd in light of these new revelations.

People who have had COVID already have significantly more protection from the virus than people who’ve been vaccinated. Meanwhile, people who’ve not had COVID and choose to not get vaccinated may or may not be making an unwise decision. But if they are, they are principally putting only themselves at risk.


Abundant August Arctic Ice with 2021 Minimum Outlook

The images above come from AARI (Arctic and Antarctic Research Institute) St. Petersburg, Russia. Note how the location of remaining ice at end of August varies greatly from year to year.  The marginal seas are open water, including the Pacific basins, Canadian Bays (Hudson and Baffin), and the Atlantic basins for the most part.  As discussed later on, other regions retain considerable ice at the annual minimum, with differences year to year.

The annual competition between ice and water in the Arctic ocean is approaching the maximum for water, which typically occurs mid September.  After that, diminishing energy from the slowly setting sun allows oceanic cooling causing ice to regenerate. Those interested in the dynamics of Arctic sea ice can read numerous posts here.  This post provides a look at end of August from 2007 to yesterday as a context for anticipating this year’s annual minimum.  Note that for climate purposes the annual minimum is measured by the September monthly average ice extent, since the daily extents vary and will go briefly lowest on or about day 260. In a typical year the overall ice extent will end September slightly higher than at the beginning.

The melting season in August up to yesterday shows 2021 melted slower than average and the month end extents were much higher than average.  I have added a hockey stick to dramatize the abundance of August Arctic ice this year.


Firstly note that on average August ice declines 205k km2 but in 2021 only 112k km2 was lost. The decline in Sea Ice Index in orange  was only slightly more, 130k km2.  The table for day 243 show how large are the 2021 surpluses and how the ice is distributed across the various seas comprising the Arctic Ocean. Since 2007 was the same as average, 2020 day 243 is shown for comparison.  The surplus this year over last is more than 1 Wadham.

Region 2021243 Day 243 Average 2021-Ave. 2020243 2021-2020
 (0) Northern_Hemisphere 5489976 4823907 666069 4345398 1144577
 (1) Beaufort_Sea 855409 543972 311437 763281 92128
 (2) Chukchi_Sea 573897 221139 352758 212438 361459
 (3) East_Siberian_Sea 454688 337359 117328 176996 277692
 (4) Laptev_Sea 24500 164608 -140107 1029 23471
 (5) Kara_Sea 120346 41181 79165 23958 96387
 (6) Barents_Sea 598 20645 -20047 0 598
 (7) Greenland_Sea 63956 172538 -108583 192361 -128406
 (8) Baffin_Bay_Gulf_of_St._Lawrence 16313 26222 -9909 5016 11297
 (9) Canadian_Archipelago 431968 300878 131089 273116 158852
 (10) Hudson_Bay 44909 23291 21618 23611 21298
 (11) Central_Arctic 2902324 2971236 -68912 2672904 229421

The main deficits to average are in Laptev and Greenland Seas, overcome by surpluses almost everywhere, especially in BCE (Beaufort, Chukchi, East Siberian seas), Kara and Canadian Archipelago.  And as discussed below, the marginal basins have little ice left to lose.

The Bigger Picture 

We are close to the annual Arctic ice extent minimum, which typically occurs on or about day 260 (mid September). Some take any year’s slightly lower minimum as proof that Arctic ice is dying, but the image above shows the Arctic heart is beating clear and strong.

Over this decade, the Arctic ice minimum has not declined, but since 2007 looks like fluctuations around a plateau. By mid-September, all the peripheral seas have turned to water, and the residual ice shows up in a few places. The table below indicates where we can expect to find ice this September. Numbers are area units of Mkm2 (millions of square kilometers).

Day 260 14 year
Arctic Regions 2007 2010 2014 2015 2016 2017 2018 2019 2020 Average
Central Arctic Sea 2.67 3.16 2.98 2.93 2.92 3.07 2.91 2.97 2.50 2.90
BCE 0.50 1.08 1.38 0.89 0.52 0.84 1.16 0.46 0.65 0.89
LKB 0.29 0.24 0.19 0.05 0.28 0.26 0.02 0.11 0.01 0.16
Greenland & CAA 0.56 0.41 0.55 0.46 0.45 0.52 0.41 0.36 0.59 0.46
B&H Bays 0.03 0.03 0.02 0.10 0.03 0.07 0.05 0.01 0.02 0.04
NH Total 4.05 4.91 5.13 4.44 4.20 4.76 4.56 3.91 3.77 4.39

The table includes two early years of note along with the last 7 years compared to the 14 year average for five contiguous arctic regions. BCE (Beaufort, Chukchi and East Siberian) on the Asian side are quite variable as the largest source of ice other than the Central Arctic itself.   Greenland Sea and CAA (Canadian Arctic Archipelago) together hold almost 0.5M km2 of ice at annual minimum, fairly consistently.  LKB are the European seas of Laptev, Kara and Barents, a smaller source of ice, but a difference maker some years, as Laptev was in 2016.  Baffin and Hudson Bays are inconsequential as of day 260.

For context, note that the average maximum has been 15M, so on average the extent shrinks to 30% of the March high before growing back the following winter.  In this context, it is foolhardy to project any summer minimum forward to proclaim the end of Arctic ice.

Resources:  Climate Compilation II Arctic Sea Ice

Fear Not Warming from CO2

Yellow dot is the present day ppm CO2 and the Green dot is double present ppm CO2. NASA estimates CO2 was 300 ppm in 1910 and 400 ppm in 2015. Exhibit from Coe et al. with added information.

Consensus climate science asserts as given a difference of 33°K between earth surface temperature average 288°K and top of the atmosphere temperature average 255°K. It further claims that IR active gases in the atmosphere (so-called “greenhouse gases”) cause the entire 33°K by their absorption of IR emitted from the earth.  A recent peer-reviewed paper took without challenging that presumption and proceeded to attribute the warming effect to the various GHGs:  H2O, CO2, CH4, and N2O.  The researchers are expert with measures of atmospheric radiation activity and use of the HITRAN database.  The paper is The Impact of CO2, H2O and Other “Greenhouse Gases” on Equilibrium Earth Temperatures by David Coe et al.  Excerpts in italics with my bolds.  H\T Paul Homewood

Abstract

It has long been accepted that the “greenhouse effect”, where the atmosphere readily transmits short wavelength incoming solar radiation but selectively absorbs long wavelength outgoing radiation emitted by the earth, is responsible for warming the earth from the 255K effective earth temperature, without atmospheric warming, to the current average temperature of 288K. It is also widely accepted that the two main atmospheric greenhouse gases are H2O and CO2.

What is surprising is the wide variation in the estimated warming potential of CO2, the gas held responsible for the modern concept of climate change. Estimates published by the IPCC for climate sensitivity to a doubling of CO2 concentration vary from 1.5 to 4.5°C based upon a plethora of scientific papers attempting to analyse the complexities of atmospheric thermodynamics to determine their results.

The aim of this paper is to simplify the method of achieving a figure for climate sensitivity not only for CO2, but also CH4 and N2O, which are also considered to be strong greenhouse gases, by determining just how atmospheric absorption has resulted in the current 33K warming and then extrapolating that result to calculate the expected warming due to future increases of greenhouse gas concentrations.

The HITRAN database of gaseous absorption spectra enables the absorption of earth radiation at its current temperature of 288K to be accurately determined for each individual atmospheric constituent and also for the combined absorption of the atmosphere as a whole. From this data it is concluded that H2O is responsible for 29.4K of the 33K warming, with CO2 contributing 3.3K and CH4 and N2O combined just 0.3K. Climate sensitivity to future increases in CO2 concentration is calculated to be 0.50K, including the positive feedback effects of H2O, while climate sensitivities to CH4 and N2O are almost undetectable at 0.06K and 0.08K respectively. This result strongly suggests that increasing levels of CO2 will not lead to significant changes in earth temperature and that increases in CH4 and N2O will have very little discernable impact.

Discussion

Unlike water vapour, the mean CO2 concentration will remain constant at all atmospheric levels, although its density will reduce as altitude increases and pressure and temperature decrease. CO2 concentration however will vary considerably with location and with seasons, as biospheric photosynthesis removes substantial seasonal amounts of CO2 from the atmosphere. A mean level of 400ppm has been assumed for the following calculations of atmospheric absorptivity. Similarly, CH4 and N2O concentrations will be considered to remain constant at current average levels of 1.8ppm and 0.32ppm respectively.

CH4 and N2O are indeed very powerful absorbers of infra-red radiation. Increasing the concentrations of each gas to 30ppm (a 16fold increase in the case of CH4 and an almost
100fold increase in N2O) would result in a combined absorption of 15%, close to the value of 18% for 400ppm of CO2. The combined absorptive impact in the presence of
H2O and CO2 however reduces this absorption to less than 3% as can be seen in Figure 11 due to the overlap of the absorption bands of CO2 and H2O. It would thus take a huge increase in atmospheric concentrations of these gases to have any significant impact on total atmospheric infra-red absorption.

Figures 4, 5 and 6 show the transmission of the spectral radiation Eλ, through current atmospheric concentrations of CO2 and H2O and through the combination of the two gases. Absorptivities of both CO2 and H2O, as well as CH4 and N2O, have been determined over the range 3 to 100µm to a resolution of 0.1cm-1. It is clear that significant amounts of radiated energy are absorbed by both CO2 and H2O. It is also clear that there is considerable overlap of the absorption bands of CO2 and H2O with the H2O absorption being the dominant factor.

Coe et al. Figures 4, 5 and 6.

It is of some interest to calculate the increase in temperature that has occurred due to the increase in atmospheric CO2 levels from the 280ppm prior at the start of the industrial revolution to the current 420ppm registered at the Mona Loa Observatory. (K. W. Thoning et. al. 2019) [17]. The HITRAN calculations show that atmospheric absorptivity has increased from 0.727 to 0.730 due to the increase of 140ppm CO2, resulting in a temperature increase of 0.24Kelvin. This is, therefore, the full extent of anthropogenic global warming to date.

Conclusions

From this it follows that the 33Kelvin warming of the earth from 255Kelvin, widely accepted as the zero-atmosphere earth temperature, to the current average temperature of 288Kelvin, is a 29.4K increase attributed to H2O, 3.3K to CO2 and 0.3K to CH4 and N2O combined. H2O is by far the dominant greenhouse gas, and its atmospheric concentration is determined solely by atmospheric temperature. Furthermore, the strength of the H2O infra-red absorption bands is such that the radiation within those bands is quickly absorbed in the lower atmosphere resulting in further increases in H2O concentrations having little further effect upon atmospheric absorption and hence earth temperatures. An increase in average Relative Humidity of 1% will result in a temperature increase of 0.03Kelvin.

By comparison CO2 is a bit player. It however does possess strong spectral absorption bands which, like H2O, absorb most of the radiated energy, within those bands, in the lower atmosphere. It also suffers the big disadvantage that most of its absorption bands are overlapped by those of H2O thus reducing greatly its effectiveness. In fact, the climate sensitivity to a doubling of CO2 from 400ppm to 800ppm is calculated to be 0.45 Kelvin. This increases to 0.50 Kelvin when feedback effects are taken into account. This figure is significantly lower than the IPCC claims of 1.5 to 4.5 Kelvin.

The contribution of CH4 and N2O is miniscule. Not only have they contributed a mere 0.3Kelvin to current earth temperatures, their climate sensitivities to a doubling of their present atmospheric concentrations are 0.06 and 0.08 Kelvin respectively. As with CO2 their absorption spectra are largely overlapped by the H2O spectra again substantially reducing their impact.

It is often claimed that a major contributor to global warming is the positive feedback effect of H2O. As the atmosphere warms, the atmospheric concentration of H2O also increases, resulting in a further increase in temperature suggesting that a tipping point might eventually be reached where runaway temperatures are experienced. The calculations in this paper show that this is simply not the case. There is indeed a positive feedback effect due to the presence of H2O, but this is limited to a multiplying effect of 1.183 to any temperature increase. For example, it increases the CO2 climate sensitivity from 0.45K to 0.53K.

A further feedback, however, is caused by a reduction in atmospheric absorptivity as the spectral radiance of the earth’s emitted energy increases with temperature, with peak emissions moving slightly towards lower radiation wavelengths. This causes a negative feedback with a temperature multiplier of 0.9894. This results in a total feedback multiplier of 1.124, reducing the effective CO2 climate sensitivity from 0.53 to 0.50 Kelvin.

Feedback effects play a minor role in the warming of the earth. There is, and never can be, a tipping point. As the concentrations of greenhouse gases increase, the temperature sensitivity to those increases becomes smaller and smaller. The earth’s atmosphere is a near perfect example of a stable system. It is also possible to attribute the impact of the increase in CO2 concentrations from the pre-industrial levels of 280ppm to the current 420ppm to an increase in earth mean temperature of just 0.24Kelvin, a figure entirely consistent with the calculated climate sensitivity of 0.50 Kelvin.

The atmosphere, mainly due to the beneficial characteristics and impact of H2O absorption spectra, proves to be a highly stable moderator of global temperatures. There is no impending climate emergency and CO2 is not the control parameter of global temperatures, that accolade falls to H2O. CO2 is simply the supporter of life on this planet as a result of the miracle of photosynthesis.

Footnote:

Coe et al. confirm what Ångström showed experimentally a century ago. He stated in 1900:
“Under no circumstances should carbon dioxide absorb more than 16 percent of terrestrial radiation, and the size of this absorption varies quantitatively very little, as long as there is not less than 20 percent of the existing value.”  See Pick Your A-Team: Arrhenius or Ångström

Independently, W. A. van Wijngaarden, W. Happer published findings this year similar to Coe et al. in their study Relative Potency of Greenhouse Molecules

COVID-19 Status in US: Statistics vs. Hype

The complete report by statisticians Kevin Dayaratna and Norbert Michel is A Statistical Analysis of COVID-19 Breakthrough Infections and Deaths.  

Summary of Principal findings:

According to estimates by the Centers for Disease Control and Prevention (CDC), the Delta variant represented more than 80 percent of new U.S. COVID-19 cases at the end of July 2021. This fact has almost surely added to Americans’ concerns about the efficacy of COVID-19 vaccines since coverage of breakthrough cases has permeated the news. The CDC has also sent mixed messages, creating confusion and unnecessary fear. The overall evidence remains clear: Vaccines provide people with significant protection against serious illness or death from the coronavirus, including the Delta variant. Public health guidelines should reflect this reality.

  • The CDC announced new COVID-19 guidelines for the vaccinated based on data that allegedly imply that vaccines offer little protection against the Delta variant.
  • The new data simply do not support such evidence, and the CDC’s latest move to re-impose mask mandates runs the risk of increasing vaccine hesitancy.
  • Health guidelines must reflect the reality that vaccines provide significant protection against serious illness or death from the virus, including the Delta variant.
COVID-19 Cases, Deaths, and Vaccines

Chart 1 presents new daily cases and deaths over the course of the pandemic.

As Chart 1 demonstrates, COVID-19 cases and deaths declined significantly for much of the first half of 2021 as more Americans were vaccinated. While the U.S. is experiencing a surge in cases due to the Delta variant, most of these cases are among the unvaccinated, and COVID-19 deaths are nowhere near the levels before vaccines were authorized.

Furthermore, as of August 4, 2021, more than 164 million Americans were fully vaccinated against COVID-19, with 191 million people having acquired partial immunity through at least one dose. More than 80 percent of Americans 65 and older are fully vaccinated

Yet, among those fully vaccinated, the CDC reports 7,525 COVID-19 patients who either were hospitalized or died, a figure representing 0.005 percent of the fully vaccinated.  This CDC statistic reflects data as of August 2, 2021. 

According to the CDC, 74 percent of these cases were people ages 65 and older, 26 percent of these hospitalizations were reported as asymptomatic or not related to COVID-19, and 21 percent (316) of the 1,507 fatal cases were reported as asymptomatic or not related to COVID-19.

The CDC “Study” of Barnstable County, Massachusetts

According to The New York Times, the State of Massachusetts and Barnstable County have adult vaccination rates of 74.8 percent and 76 percent, respectively.  These statistics assume full vaccination.  The town of Provincetown itself (where many of the celebratory events took place) has a vaccination rate of 95 percent.  Although it is unclear what the actual vaccination rate was among the attendees, Dr. Ingu Yun, who attended the festivities and engaged in a similar analysis associated only with fully vaccinated people, suggests that the vaccination rate of attendees was well above 90 percent.

That is, assuming a 90 percent vaccination rate, only 1.21 percent of the estimated 54,000 vaccinated attendees, and 4.67 percent of the estimated 6,000 unvaccinated, tested positive for COVID-19. Of course, the festivities had many out-of-town visitors, making it difficult to ascertain the true vaccination rate among attendees.

What Are Your Odds Now

Of course, there will continue to be breakthrough cases, but the CDC’s own data indicate that the truth is the vaccines have had over 90% efficacy against hospitalization and death.

Not surprisingly, however, among the unvaccinated, COVID-19 can still be quite deadly, especially for the elderly and those with chronic conditions. The following chart puts those odds in perspective with other causes of death.

As the chart illustrates, however, the odds of dying of COVID-19 despite being fully vaccinated, although not zero, are slim to none. In fact, those under 65 have significantly higher odds of getting struck by lightning.


Media Hype about “Long Covid”

Science Norway reports Poor studies on long Covid are sensationalized by the media  Excerpts in italics with my bolds.

Many recent reports in the media have given the impression that people are experiencing major long-term effects after having even mild Covid-19. This impression does not correspond with the knowledge we have accumulated so far.

We must dedramatise the long-term effects of Covid-19, often referred to as long Covid. The media have a responsibility in this regard. They must become more critical of the research methods used in the studies they refer to.

Most infectious diseases with severe symptoms will to some extent be accompanied by long-term effects. Most infectious diseases with mild symptoms will cause few short-term effects.

More and more studies are showing that this is probably also the case for Covid-19. It is vital that more high-quality studies are carried out to examine this problem.

Data from the Norwegian Institute of Public Health’s emergency preparedness register (BeredtC19) includes around two million Norwegians who have been tested for SARS-CoV-2. It shows a short-term and temporary rise in the number of contacts with general practitioners – GPs and emergency medical centres – after mild Covid-19.

The study suggests there has been no increase in use of the specialist health service when compared with those who have tested negative.

The media have overdramatised studies which have not included suitable comparison groups.

The fact that the effects can exclusively be investigated and treated by GPs means that most effects are likely to be mild, even though they might seem unpleasant for the people concerned.

This Norwegian data is supported by a major Danish register study, which found a low risk of serious complications after mild Covid-19.

Mental Health Problems Not Greater with Covid

An example of the importance of having a comparison group is that we find a sharp increase in mental health problems amongst those who have had Covid-19 in Norway between March and November 2020.

This would typically have led to a headline along the lines of “Mild Covid-19 causes mental health problems”. However, when we study a comparison group consisting of people who tested negative over the same period of time, we find an even greater increase.

This means that both those who have had and those who have not had Covid-19 may have suffered long-term mental health problems as a result of isolation and loneliness during lockdown, rather than of having had Covid-19. Instead, the headline would then be “Mild Covid-19 does not give rise to mental health problems”.

Comparison groups are useful precisely when they are comparable. In other words, the group that has had Covid-19 must be as similar as possible to the group that has not had it.

So, when the next study of long-term effects is published and journalists consider using the headline “Mild Covid-19 can cause death after six months”, perhaps they could start by asking themselves the question: Did the study also investigate deaths after six months amongst those who have not had Covid-19?

This is about the lives and health of many people. Intimidation and unnecessary fear are the last thing we need.

Footnote:  People with Severe Covid Illnesses Doing Surprisingly Well 3 months Later

Also from Science Norway People who were seriously ill with Covid-19 are doing surprisingly well today.  Excerpts in italics with my bolds.

Three months after having been discharged from the hospital following serious Covid-19, researchers tested the oxygen uptake of 156 patients.

20 per cent of the participants had been treated in the intensive ward, 13 per cent needed ventilators.

“We were worried about the effects on those who were admitted to hospital with serious Covid-19 disease”, Ingunn Skjørten says to the Norwegian broadcaster NRK. She is a specialist in internal medicine and lung diseases at the LHL-hospital at Gardermoen.

“We were particularly worried that the patients might have long lasting damages of their lungs”, she says.

When they analyzed the results of the tests however, the researchers were positively surprised.

Of the 156 participants, only a third still had low oxygen uptake three months after being discharged from the hospital.

“Considering how ill they actually were when in hospital, we expected a lot more of them to still experience this problem”, Skjørten says to NRK.

And there is more good news:

For the majority of those who did still experience problems with oxygen uptake, the solution is seemingly easy: they have to work out.   Because this was the other positive surprise: among the majority of those who still had a low oxygen uptake, their lungs were not the problem.

When the researchers took a closer look at those who struggled with low oxygen uptake, the most important factor – observed in 63 per cent – was the fact that they were out of shape due to inactivity.

The fact that most of the participants still experience low oxygen uptake due to being out of shape is good news, according to Skjørten.

It means that exercise can be used in order to deal with some of the long-term effects of serious Covid-19, NRK writes. And it means that the illness hasn’t caused as large and as permanent damages as the researchers feared.